Abstract
The Intersecting Canonical Boundary Approximation (ICBA) [T. Scotti A. Wirgin (1995). Shape reconstruction using diffracted waves and canonical solutions Inverse Probs. 11, 1097; A. Wirgin T. Scotti (1996). Wide-band approximation of the sound field scattered by an impenetrable body of arbitrary shape J. Sound Vibr.,194, 537.] is employed as the estimator to recover the location, size, orientation and shape of an acoustically-rigid body from both simulated data obtained from a boundary element code, and real data obtained by means of experiments appealing to audible monochromatic sound as the probe radiation. It is shown, both empirically and theoretically, that the cost functional of the discrepancy between the estimated and measured data exhibits more than one minimum for each measurement point which implies nonuniqueness of boundary identification. The underlying theory by which this nonuniqueness is made evident indicates that the use of scattering data at two or more frequencies makes it possible to reduce the ambiguity of the reconstruction. It is shown that once the nonuniqueness issue is addressed, the quality of the identification is determined by a complex interplay of data and estimator error.
1 Introduction
This investigation concerns aspects of boundary-identification inverse problems that arise in various contexts such as nondestructive testing of industrial objects, underwater imaging, ultrasound imaging of biological objects, robotics, etc. [Citation3–Citation5]. An oft-used method for solving such problems [Citation1,Citation6] is to generate a cost functional expressing the discrepancy between the actual (simulated or measured) data and what the estimator predicts the scattered field to be for a set of trial location and boundary parameters of the body; the sought-for parameters are then chosen to be those trial parameters which give rise to the minimum of the cost functional. A major difficulty with this approach, rarely alluded-to in previous studies (see [Citation7–Citation9] for exceptions), is that the cost functional often exhibits not one, but many minima (in [Citation8] the global minimum is chosen to pinpoint the solution, but as shown hereafter, this method for resolving the nonuniqueness is not foolproof), so that the procedure cannot provide a unique solution. We exhibit this fact empirically for simulated data, and observe that the distribution of minima follows a regular pattern, which in fact suggests that there exists a simple law relating the position of the minima to some or all of the sought-for parameters. Through a close examination of a discrepancy functional, under the assumption that the cylindrical scattering body is circular or close to being circular, we are able to obtain, in theoretical manner, a simple relation between the estimated radii of the cylinder, the actual radius of the cylinder, and the frequency of the probe radiation. This relation holds for bodies of other shapes (within reasonable limits) and thereby predicts fairly accurately the position of both the global and relative minima of the cost functional for these bodies. Furthermore, the simple relation also suggests that it is possible to eliminate the nonuniqueness of the reconstruction by employing monochromatic data obtained at two or more probe radiation frequencies. This elimination procedure is shown to be very effective with both simulated and real data, but does not resolve instability problems due to data and/or estimator errors.
2 Scattering configuration and governing equations
Let be an incident monochromatic plane-wave (pressure) wavefield (the
time (t) factor, with ω the angular frequency, is hereafter implicit) at point
of the xOy plane (i.e., the field in the absence of the body B),
the scattered and total fields in response to ui, Ω the subdomain of xOy occcupied by the sound-hard cylindrical body in its cross-section (xOy) plane, and Γ = ∂ Ω the boundary of the object, assumed to be representable by the parametric equation r = ρ(θ) (ρ = ρ(θ) a continuous, single-valued function of θ). Let Γb be a circle of radius b that circumscribes the object in its cross-section plane, i.e.,
(see ). The wavefields satisfy the following relations:
(--2-1)
(--2-2)
(--2-3)
wherein
and c are the wavenumber and sound speed respectively in the (light fluid, e.g., air) medium outside the object,
, θi the angle of incidence, ∂ν the normal derivative,
and
.
3 Forward and inverse problems
The forward scattering (measurement) problem is : given ω, c, and Γ; determine
at all points on the circumscribing circle Γb (see ).
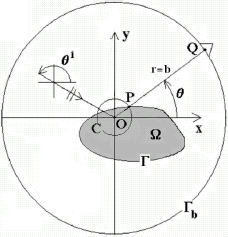
FIGURE 1 Scattering configuration in the x − y cross-section plane. θi is the incident angle, θ the diffracted angle, Q the position of the receiver on the measurement circle Γb of radius b and center O, P the point of intersection of the segment joining Q to O with the boundary Γ of the scattering body B occupying the domain ΩC is the intersecting canonical body (ICB, a circle) centered at O and passing through P, with the distance from O to P being ρ (θ). The employment of the ICBA in the estimator enables to determine ρ (θ) from the scattered field at Q.
The problem of particular interest here is to solve the inverse scattering problem: given ω, c, , b, and the simulated or measured total field u on Γb; determine the location, size, orientation and shape of the object, embodied in the so-called shape function ρ (θ), knowing a priori that: (i) the origin O is somewhere within the object, and (ii)
(--3-1)
wherein ρ0 is assumed to be a known positive real constant (as is b). Note that in the inverse problem, u(x, ω) is unknown everywhere except on Γb.
4 Solution of the inverse scattering problem relative to a circular cylinder for simulated data
In order to get a feel of how inverse scattering problems are solved, it proves useful to examine one of the simplest such problems in which the body is a circular cylinder. We assume that: (i) the cylinder has radius a, (ii) the center of the cylinder is at the origin O, and (iii) the data is exact, i.e., the experiment produces no error and is identical to the data generated by the exact theory of scattering by the cylinder. The cylinder is subjected to the plane wave described in Section 2 and the object is to recover a from scattered field data on Γb.
The first task is to simulate data by the exact theory. The latter tells us that the field can be represented by the sum of outgoing cylindrical partial waves:
(--4-1)
wherein
is the nth order Hankel function of the first kind, Jn the nth order Bessel function, and Yn the nth order Neumann function. Making use of the identity
(--4-2)
and the boundary condition (2.2), yields
(--4-3)
wherein a dot over a function signifies a derivative with respect to its argument, so that the simulated scattered field data on Γb (i.e., the solution of the forward scattering problem) is
(--4-4)
The reason for choosing the circular cylinder is that we know the exact solution (given in (Equation4.1(--4-1) ) and (Equation4.3
(--4-3) )) for scattering from such a body. It is thus very convenient to employ this solution to estimate the measured (here identical to simulated) data. The main ingredient of the estimator is the real function τ(θ) which is the trial solution for the sought-for shape function ρ(θ) = a (with a a positive real constant). Intuitively, one would expect τ(θ) to be all the closer to ρ(θ) = a the closer the estimated field
is to the measured field
. This suggests identifying ρ (θ) with the τ(θ) which minimizes some discrepancy functional
. As stated in Section 3, the incident field is assumed to be known at the outset in the process of solving the inverse problem, so that the discrepancy functional reduces to
. Considering what was written above, the estimated scattered field is
(--4-5)
which can be recognized as being none other than
when a is replaced by τ(θ) and the latter is implicitly thought to be some real constant d.
To illustrate the inversion procedure, let us discretize by the set
and choose
to be the set of cost functionals
(--4-6)
which, on account of (Equation4.4
(--4-4) ) and (Equation4.5
(--4-5) ), can be written as:
(--4-7)
The numerical treatment (i.e., search for the minima) of (Equation4.7
(--4-7) ) requires that the infinite limits of the sums therein be replaced by finite values so that what we actually compute is
(--4-8)
wherein L < ∞. Note that the mth member of the set of functionals in (Equation4.8
(--4-8) ) is in terms of only one member of the set
so that the different functionals are uncoupled and each functional is nonlinear in terms of τ(θm).
When the mth functional is plotted as a function of τ(θm), it is found to have oscillatory behavior, meaning that the functional exhibits not one, but several more or less deep minima in the interval . In fact this functional attains an absolute minimum equal to zero when τ(θm) = a, as can easily be ascertained analytically by inspection of (Equation4.8
(--4-8) ). Let the ℓmth minimum at angle θm have radial position
, with, by definition, ℓm = 0 corresponding to the (correct) solution τ(θm) = a. A polar plot of all the points
typically takes the following form: one discerns a circle, which is the locus of ℓ = 0 minima and represents the correct boundary of the body, and which is accompanied by a series of more-or-less homothetic, more-or-less equally-spaced, deformed-circles representing other possible boundaries of the body. The deformation of these curves is found to vary with θ (i.e., less deformation for θ ≈ θi than at other angles).
The upshot of this empirical discovery is that there exists not one solution (the centered circle with correct radius) to the problem, but a series of solutions (deformed circles), which means that the solution to the inverse problem is not unique. The question is now: where do these spurious solutions come from and are they a feature of the intrinsic nonuniqueness of the problem due, for instance, to insufficient or badly-chosen data, or to some other causes? Note that the cause ought not to be data error because the data was taken to be exact, nor should it be estimator error because the latter appealed to the exact solution of the scattering problem.
5 Causes of apparent nonuniqueness of the inverse problem of the recovery of the radius of a circular cylinder from scattered field data
Rather than search for the minima of in (Equation4.6
(--4-6) ), we now choose
to be the identity operator and require it to be nil for all θ, i.e.,
(--5-1)
As previously, we reduce this to a series of M relations by discretizing θ
(--5-2)
which can be recognized as being an uncoupled system of nonlinear equations for the unknowns constituted by the members of the set
.
At this stage, rather than attempt to solve this system, we prefer to return to its continuous form (Equation5.1(--5-1) ) which we project onto the set of Fourier basis functions
. Furthermore, we make use of the a priori information that the scattering body is a circular cylinder with center at O, which means that
, with d some positive real constant. The inverse problem thus reduces to the recovery of d from the set of equations:
(--5-3)
from which we find
(--5-4)
Since
are complex functions that do not generally vanish, we must have:
(--5-5)
A consequence of this expression, from which we now try to determine d, is: if d is a solution of (Equation5.5
(--5-5) ) for a finite subset of
, then it must be a solution of (Equation5.5
(--5-5) ) for the remainder of values of m in
. Note that an obvious solution of (Equation5.5
(--5-5) ) is d = a, but this does not necessarily mean that it is the only solution.
First consider the subset of the Eq. (Equation5.5(--5-5) ) for which |n| ≪ kd. We shall also assume that ka is such that |n| ≪ ka. We make use of the general formula:
(--5-6)
(wherein Z is a Bessel or Neumann function or a linear combination of these two functions) and the following asymptotic forms of the Bessel and Neumann functions:
(--5-7)
to find the following relation encompassed in the asymptotic form of (Equation5.5
(--5-5) ):
(--5-8)
the solutions of which are
(--5-9)
This shows that there exists an infinite number of solutions of (Equation5.5
(--5-5) ) in the asymptotic regime |m| = kd, ka, but this finding does not necessarily mean that the set of Eq. (Equation5.5
(--5-5) ) does not possess a unique solution.
To pursue this question, we now turn to the case |m| ≈ kd, ka. As written previously, an obvious solution of (Equation5.5(--5-5) ) is, in this regime (as in all other regimes), d = a, but this may not be the only solution. Let's say that this might happen for m = μ and that the corresponding solution is dμ ≠ a; then it is highly unlikely that the same solution dμ occurs for all other m satisfying |m| ≈ kd, ka. This is not to say that another solution
may not occur for
, but it must not be forgotten that in order for a solution of (Equation5.5
(--5-5) ) to be valid, it must be valid for all
.
To get a clearer picture of the situation, we finally turn to the case . It suffices to look at what happens for m ≥ 0. We make use of the following asymptotic forms:
(--5-10)
to find the following relation encompassed in the asymptotic form of (Equation5.5
(--5-5) ):
(--5-11)
the only solution of which, for positive real d and a, is d = a.
From what has been found in these three regimes, we must conclude that the only solution which satisfies (Equation5.5(--5-5) ) for all
is d = a. This is satisfying in that it shows that the solution of the inverse problem is not only unique, but the correct solution. Unfortunately, it is in contradiction with what was found in empirical manner in Section 4.
How can we reconcile these two seemingly-contradictory results? The first point that can be made is that in Section 4 we employed truncated series for the data and estimator whereas here infinite series were assumed. If we proceed as in Section 4, then instead of obtaining (Equation5.5(--5-5) ), we are led to
(--5-12)
A consequence of this expression is: if d is a solution of (Equation5.5
(--5-5) ) for a subset of
, then it must be a solution of (5.12) for the remainder of values of m in
. Now, all depends on the choice of L. If L is large, i.e., L ≫ ka, kd then the same reasoning as before leads to the conclusion that the only possible solution is d = a. If L is such that L ≈ ka, kd then it might be that there exists more than one solution satisfying (5.12). If L is small, i.e., L ≪ ka, kd, then we are sure, from (Equation5.9
(--5-9) ), that there exist more than one (amongst which the correct) solutions to the problem (except at very low frequencies). This suggests that in order to avoid the type of nonuniqueness we are concerned with here, L should be chosen in such a way that L ≫ ka, kd, which is not always easy to do if we have only a vague a priori idea of the size of the scattering body.
Another point about the previously-mentioned contradiction: the discussion relative to the projected cost functionals Km under examination in this section is concerned with minima of a functional (the one in (Equation5.5(--5-5) ) and (5.12)) that is different, and in a different space, than the (unprojected) functionals K and J. A given equation of the set (Equation5.2
(--5-2) ) ignores the crucial fact (employed in (Equation5.3
(--5-3) )) that one disposes of scattered field data for all
, so that it is not surprising that any K of the set (Equation5.2
(--5-2) ) or J of the set (Equation4.6
(--4-6) ) exhibits multiple minima.
Nevertheless, there exists a close relation between the small-m solutions of (Equation5.5(--5-5) ) and the positions of the minima of the J cost function, as can be verified by computing ℓπ/k for ℓ = −1, 0, 1, 2, 3. This relation depends on ka, and is near-exact for small
, although less so for other angles. This has also been found to be the case in many other numerical examples (notably for other ka). We identify this as being the principal result of our analysis, since it serves as a guide in interpreting (and predicting the positions of) the multiple solutions that are generated when seeking to solve the problem via the J cost function.
6 More on the inverse problem of the recovery of the radius of a circular cylinder from scattered field data
The material in this section is concerned with a more detailed analysis of the features of the J cost functional, and of how data and/or estimator errors affect the latter.
We proceed as in Section 4, albeit with the difference that the series in the data and in the estimator are now taken to be finite rather than infinite:
(--6-1)
(--6-2)
Here, the difference
represents the data error and the difference
the estimator error. The equivalent of (Equation4.8
(--4-8) ) is
(--6-3)
Let us first consider the case , i.e., the error of the data is the same as the error of the estimator. This is a highly unlikely situation in practice, because one usually does not know what the error of the data is, and, in any case, it is not always easy to tailor the estimator error. Nevertheless, we treat this case because it enables us to obtain an explanation of some of the features of the graph of the J cost functional. The cost functionals become
(--6-4)
wherein
(--6-5)
(--6-6)
We can write (Equation6.4
(--6-4) ) as:
(--6-7)
or, on account of the material in Section 5, as:
(--6-8)
wherein
(--6-9)
with a similar meaning for
, and
(--6-10)
with a similar meaning for
. With the help of (Equation5.8
(--5-8) ) and (Equation5.9
(--5-9) ) we find
(--6-11)
so that
(--6-12)
from which we infer that
does not generally vanish (except for ℓm = 0), this meaning that
probably does not coincide with the location of a minimum of
for ℓm ≠ 0. However, the previously-mentioned graph of the J cost functional relative to a centered circular cylindrical body shows that
might be close to the value of τ(θm) for which
attains a minimum. Also, when
, and this entails (via (6.12))
(--6-13)
which means that
attains a global minimum at τ(θm) = a, for all m = 1, 2, …, M, which is another way of saying that the ℓm = 0 solutions correspond to the correct circular boundary of the scattering body. Thus, when the error in the data is equal to the error in the estimator (i.e.,
), we are sure of being able to reconstruct a host of solutions, one of which is necessarily the correct circular cylinder boundary, and the correct solution can be spotted by noting that it is the one for which the discrepancy functional attains a global minimum.
The question that naturally arises is whether this conclusion holds in the usual situation (in practice) in which . Consider the case
. then
(--6-14)
from which we find
(--6-15)
Thus, when
, the correct solution τ(θm) = a can no longer be spotted by looking for a global minimum of the discrepancy functional because the latter does not generally vanish for τ(θm) = a. In fact, we are not even sure that the discrepancy functional attains any kind of minimum for τ(θm) = a.
The same procedure leads, for , to the same result. Thus, when
, the correct solution τ(θm) = a cannot be spotted by looking for a global minimum of the discrepancy functional because the latter does not generally vanish for τ(θm) = a. Moreover, τ(θm) = a may not correspond to any kind of minimum of the discrepancy functional. Finally, it is also probable that when
, the minima of the discrepancy functional do not align themselves in such a regular manner as when
. These findings indicate that another method must be found, even for a body as simple as the circular cylinder with center at O, for the unambiguous reconstruction of its boundary.
7 Perturbation analysis of the Km discrepancy functionals for scattering bodies that differ slightly from circular cylinders with center at the origin
We assume that: (i) any plausible wave–body interaction model is used for simulating the data, (ii) the same model is employed in the estimator, and (iii) the actual and trial shape functions of the body are of the form:
(--7-1)
where a, d and ϵ are positive real constants, f(θ) has the same functional properties as τ(θ), g(θ) has the same functional properties as ρ (θ),
, and
(--7-2)
To zeroth order in
is just the field scattered by a circular cylinder of radius a and center at O, which, if it were simulated or measured in near-exact manner, would be of the form (see Section 4):
(--7-3)
To zeroth order in
is just the field scattered by a circular cylinder of radius d, so that the estimated scattered field takes the same form as (Equation7.3
(--7-3) ), with d replacing a. Consequently, from here on, the analysis is identical to that in Section 5, and leads to the result expressed in (5.12).
Thus, we can expect that for scattering bodies having shapes and locations (slightly) different from those of a circular cylinder with center at O, the results obtained something like those observed in the graph of the J cost functional for the centered circular object. We shall see further on that this is actually the case, even for bodies whose shape and location are substantially different from those of a circular cylinder with center at O.
8 Solving the inverse problem for bodies of nearly-arbitrary size, location, orientation and shape by use of the J discrepancy functional in conjunction with the ICBA estimator
When the 2D scattering body B is no longer a circular cylinder with center at the origin (but whose boundary is nevertheless representable by ρ (θ)), the exact theory does not give rise to (Equation4.1(--4-1) ), but rather to
(--8-1)
and it is no longer possible to obtain a closed-form expression for the coefficients An.
A way to tackle this problem is to hypothesize that the scattered field at a generic point of the hard body B in response to ui is nearly the same as the field scattered by a hard circular cylinder C of radius ρ (θ) with center at O, in response to the same uiC is termed the Intersecting Canonical Body (ICB) because it intersects B at P and because we know the closed-form solution to the problem of the scattering of by C (given in (Equation4.1
(--4-1) ) and (Equation4.3
(--4-3) )). In fact, to each θ corresponds a different canonical body (see wherein the depicted ICB is that circle whose center is at O and whose radius is the distance from O to P ∈ C), this radius being equal to ρ (θ).
A more radical hypothesis employed herein is that the field scattered by B in response to ui at any point is nearly the same, at Q, as the field scattered by C (intersecting B at P, with P and Q being collinear, as in ) in response to the same ui. The mathematical translation of this so-called Intersecting Canonical Body Approximation (ICBA) [Citation1,Citation2] is:
(--8-2)
wherein
(--8-3)
Rather than use the ICBA for simulating data, we employ it as the estimator, i.e.,
(--8-4)
wherein
(--8-5)
As previously, we can either search for the roots τ (θ) of the discrepancy functional equation:
(--8-6)
or search for the trial functions τ (θ) which minimize the discrepancy functional
(--8-7)
wherein
represents either simulated (by any method) or real scattered field data, which, in any case, can be represented by the series
(--8-8)
where the
can be determined from the simulated or measured scattered field via
(--8-9)
Rather than deal directly with K, we proceed as in Section 5, by projecting the latter onto the set of Fourier basis functions
so as to obtain the set of equations
(--8-10)
It is not possible to go further with the analysis (i.e., find the roots) of this set of relations as was done in Section 5, except within the framework of perturbation theory as in Section 6. The latter indicates that if (i) the data is simulated, (ii) the model employed in this simulation is the same as the one (ICBA) used in the estimator, and (iii)
, then the roots of (8.10) are located as per the relation
(--8-11)
In the next section we shall examine whether or not this relation is substantiated for simulated data.
9 The distribution of minima of the J discrepancy functional relative to a noncircular cylindrical body for an ICBA estimator and data simulated by a boundary element method
The discussion relative to the graph of the J cost-functional of the centered circular cylinder body was concerned with a (simulated) experiment in which the body and emitter (of what was considered to be a plane wave) are fixed, and the receiver was rotated around the body on the circle Γb. Henceforth, we shall be concerned with another type of (thought) experiment (see ) in which the emitter and receiver are fixed, but the body rotates around the z-axis at O, this being equivalent to the situation in which the body is fixed and the emitter–receiver pair rotates around the z-axis at O such that the angle between them, i.e., is fixed, with, as before, θi the incident angle (defining the angular position of the emitter), θ the diffracted angle (defining the angular position of the receiver), and b being the fixed distance of the emitter (at all angular positions) from O. In fact, all the subsequent experimental results and simulations thereof will apply to the (backscattering) configuration ψ = 0.
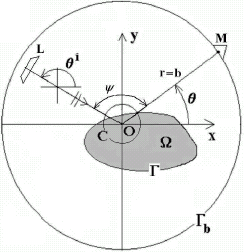
FIGURE 2 Experimental scattering configuration for constant . L is the loudspeaker-emitter, assumed to radiate a plane wave, and M is the microphone-receiver, assumed to be located on the circle Γb of radius b. The other symbols are as in .
The numerical simulation of the experiment was carried out for the ideal situation in which the cylindrical body is infinitely long and situated in the air medium filling free space (i.e., no account was taken of diffraction from the ends of what in a real experiment is a finitely-long cylinder, and the spurious echos from foreign objects in, and the sidewalls of, the enclosure in which the real experimental device is placed). Furthermore, the incident radiation was assumed to be delivered in the form of a perfectly plane wave (i.e., the sources are at infinite distance from the body, which is not so in any real experiment). Actually this assumption could have been relaxed (since the theory accomodates quite well any kind of incident field), but this was not done.
The numerical resolution of this idealized 2D forward problem of scattering by an acoustically rigid body of arbitrary (although given) shape was carried out with the help of the SYSNOISE boundary element (BEM) code (option BEM Indirect Frequency Fluid, Two-dimensional), which solves the rigorous boundary integral equation for the pressure with arbitrary accuracy (all the higher, the larger the chosen number of boundary elements (knots) on Γ). The solutions furnished by SYSNOISE are generally not identical to those provided by the ICBA, except when the body is a circular cylinder with center at O (for which the ICBA furnishes the exact solution), so that the estimator usually provides a solution which is different from the data for the same scattering body, meaning that the inverse crime (situation in which the data is identical to the estimation thereof) is avoided [Citation6,Citation10,Citation11].
In –, we exhibit polar representations of the locations of (all) the minima (within the interval [ρ0,b]) of the cost functional JICBA defined in (Equation8.7(--8-7) ) wherein
is the scattered field data obtained from SYSNOISE. This is done for data obtained at two frequencies of the probe radiation, for reasons that will become apparent in the next section.
FIGURE 3 Polar representation of the locations of the minima of the cost functional JICBA in the backscattering configuration for an elliptical cylinder whose major axis is 2c2 = 0.24 m and minor axis is 2c1 = 0.16 m. c = 340 m/s, b = 0.26 m. The data was simulated with 412 BEM knots. L = 24 in the ICBA estimator. The dots and crosses apply to minima for probe radiation at 4 and 6 kHz respectively.
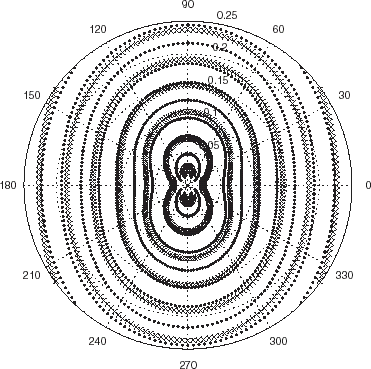
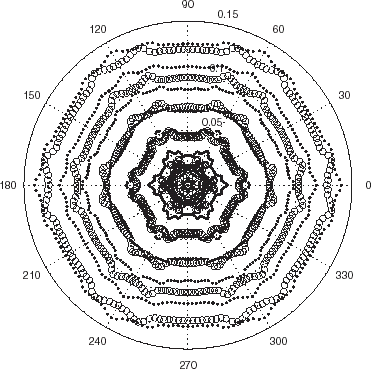
FIGURE 4 Polar representation of the locations of the minima of the cost functional JICBA in the backscattering configuration for an elliptical cylinder whose major axis is 2c2 = 0.3 m and minor axis is 2c1 = 0.12 m. c = 340 m/s, b = 0.26 m. The data was simulated with 412 BEM knots. L = 24 in the ICBA estimator. The dots and crosses apply to minima for probe radiation at 4 and 6 kHz respectively. The figure delineated by a continuous curve with dots is the to-be-identified ellipse.
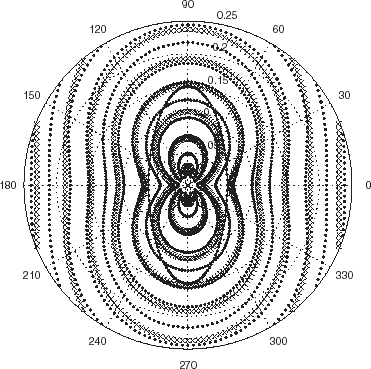
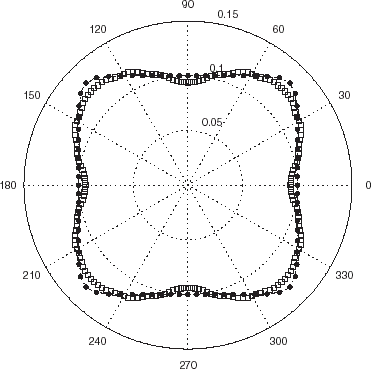
FIGURE 5 Polar representation of the locations of the minima of the cost functional JICBA in the backscattering configuration for a nearly-square cylinder such that c1 = 0.1 m. c = 340 m/s, b = 0.26 m and L = 24. The data was simulated with 420 BEM knots. The dots and crosses apply to minima for probe radiation at 6 and 4 kHz respectively.
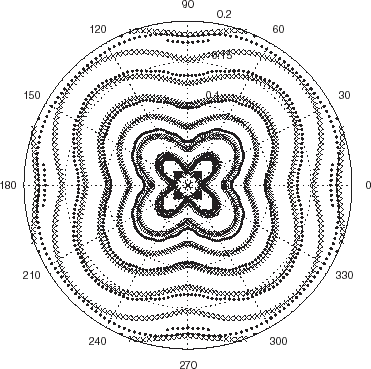
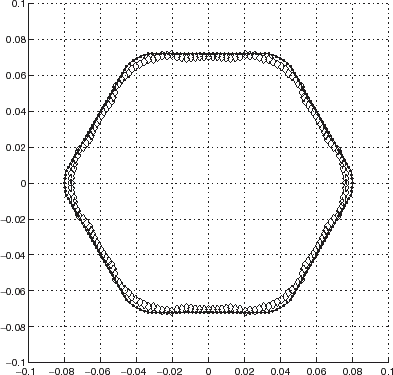
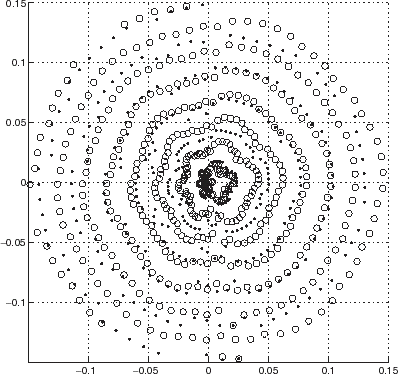
FIGURE 6 Polar representation of the locations of the minima of the cost functional JICBA in the backscattering configuration for an equilateral hexagonal cylinder such that c1 = 0.05 m, c2 = 6°. c = 340 m/s, b = 0.26 m and L = 24. The data was simulated with 204 BEM knots. The circles and dots apply to minima for probe radiation at 4 and 6 kHz respectively.
applies to a cylinder with elliptical shape and center at O, representable by the parametric equation
(--9-1)
wherein 2c1 and 2c1 are the lengths of the minor and major axes respectively. At present, c2 = 1.5c1. One observes that the minima align themselves along a series of nearly-homothetical, nearly equi-spaced elliptical curves at each frequency, in agreement with the prediction of (8.11). One also observes that the position of the minima along these curves changes with frequency (i.e., with k), as is also predicted by (8.11).
applies to another cylinder with elliptical shape and center at O, the major axis of the ellipse now being two and a half times larger than its minor axis. Again, the minima align themselves along a series of nearly-homothetical, nearly equi-spaced more-or-less elliptical curves at each frequency, but none of these curves seem to correspond to the actual boundary of the scattering boundary, probably because the ICBA estimator gives a poor approximation of the field scattered from such a body whose shape is very different from that of a circular cylinder with center at O.
applies to a cylinder with nearly-square shape and center at O, describable by the parametric equation
(--9-2)
wherein 2c1 is the nominal length of a side of the square. The same comments apply to this case as to the previous two. Now, the ICBA estimator gives a poor approximation of the scattered field because of the rather large curvature at the “corners” of the body.
applies to a cylinder with nominally-equilateral hexagonal shape, rounded corners, and center at O, which is constructed algorithmically by a series of straight line segments connected by circular arcs of angular opening 2c2, whilst the largest circle with center at O that can be inscribed within the hexagon has radius c1. The minima align themselves along a series of nearly-homothetical, nearly equi-spaced more-or-less hexagonal-shaped curves at each frequency. The positions of the minima along these curves change with frequency (i.e., with k), as is predicted by (8.11). None of these curves correspond accurately to the actual boundary of the scattering boundary, because the ICBA estimator gives a poor approximation of the field scattered from such a body having corners at which there are discontinuities in curvature.
10 A method for reducing the ambiguity of the solutions to the inverse problem
The principal result of the preceding section was that (8.11) gives a satisfactory description of the way the solutions of the inverse problem organize themselves in a τ versus θ representation.
Let us recall that (8.11) signifies that the inversion process should lead to a series of reconstructed bodies, one of which (i.e., the one for which ℓ = 0) is nearly the real body. Thus, we are faced with the problem of eliminating, or at least reducing, the ambiguity expressed by (8.11).
Let us term the curves for which ℓ ≠ 0 “artifacts”. Eq. (Equation8.11(--8-11) ), and the numerical results in the preceding section, tell us that the artifact curves, contrary to the one relative to the boundary of the real body, depend on the wavenumber of the probe radiation. This suggests that the boundary we are looking for is the only one that does not change when the frequency of the probe radiation is changed.
A possible approach to minimization of the cost function J is as follows [Citation12,Citation13]. First, divide the interval [0, 2π[ into S sectors which amounts to discretizing θ according to: , where
. Secondly, divide the interval [ρ0,b] into I subintervals Ii, which amounts to discretizing τ (confounded with the radial variable r) according to:
, where
. Thirdly, compute the discretized form of the cost function
, i.e.,
, for
, call this set J, and locate the minima (relative and absolute) by simply scanning J. For a given frequency of operation ωj, this procedure suggests (at each θs) forming the discretized representation of the possible locations of the possible solutions τ (corresponding to the occurrence of minima of the cost function at angle θs):
(--10-1)
wherein:
(--10-2)
(--10-3)
(--10-4)
This amounts, for each θs, to generating a sequence of ones and zeros, with the ones occurring in intervals Ii in which the cost function exhibits a minimum and the zeros occurring in the intervals Ii in which the cost function does not exhibit a minimum.
We now apply the hint as to the nondependence of the correct solution on the frequency to remove the ambiguity expressed in (8.11). The idea is to operate at two (or more) frequencies ω1 and ω2. Then, from (10.1) we obtain:
(--10-5)
This amounts, for each θs, to generating a sequence of zeros, ones and twos, with the zeros occurring in intervals Ii in which the cost function exhibits no minimum at either frequency, the ones occurring in intervals Ii in which the cost function exhibits a minimum at either of the two frequencies and the twos occurring in the intervals Ii in which the cost function exhibits a minimum at both frequencies. According to (8.11) and the remarks that accompany this formula, by finding the i for which Ti = 2, one locates the correct value of τ, i.e., ρ. Equation (Equation8.11
(--8-11) ) tells us that this can only occur for one value of i. Thus, the proposed scheme, which is carried out automatically on the computer, should enable the removal of the ambiguity of the reconstruction of the radius of a circular cylinder with center at O and of the local radii of cylinders having other shapes. In the figures which follow, we show this to be true when the data is obtained by numerical simulation (using SYSNOISE).
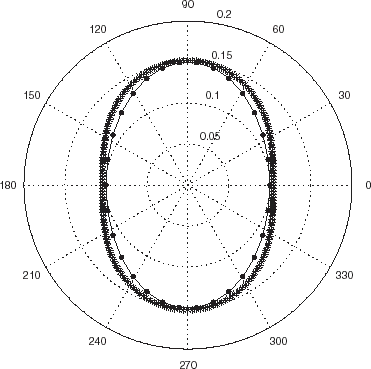
exhibits the nonambiguous reconstruction obtained by the artifact removal scheme (ARS) for the elliptic cylinder of .
FIGURE 7 Polar representation of the locations of the minima of the cost functional JICBA in the backscattering configuration for an elliptic cylinder. Same parameters as in . The data is synthetic. The asterisks apply to the reconstructed boundary after application of the ARS and the continuous curve with dots to the actual boundary.
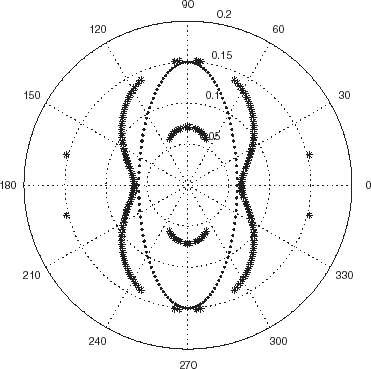
shows that the ARS cannot produce miracles when the estimator is manifestly not up to the task, as in . Nevertheless, it produces a solution devoid of artifacts, although this solution corresponds to a boundary which is rather far-removed from the actual boundary of the body.
FIGURE 8 Polar representation of the locations of the minima of the cost functional JICBA in the backscattering configuration for an elliptic cylinder. Same parameters as in . The data is synthetic. The dark asterisks apply to the reconstructed boundary after application of the ARS and the dots to the actual boundary.
shows the nonambiguous reconstruction obtained by the ARS for the almost-square cylinder of .
FIGURE 9 Polar representation of the locations of the minima of the cost functional JICBA in the backscattering configuration for a nearly-square cylinder. Same parameters as in . The data is synthetic. The □ apply to the reconstructed boundary after application of the ARS and the dashed curve with dots to the actual boundary.
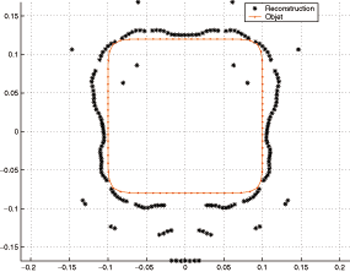
shows that the ARS is still successful in eliminating the artifacts for a displaced (vertically from the origin O) almost-square cylinder. Actually (as shown hereafter), the gaps in the boundary reconstruction are not the fault of the ARS, but rather that of the ICBA estimator which is having some trouble in correctly accounting for scattering from such a body.
FIGURE 10 Polar representation of the locations of the minima of the cost functional JICBA in the backscattering configuration for a nearly-square cylinder whose center is displaced vertically by 0.025 m from the origin O. Otherwise, the parameters are the same as in . The data is synthetic. The asterisks apply to the reconstructed boundary after application of the ARS and the continuous curve with dots to the actual boundary.
illustrates how the ARS acts to eliminate some of the possible solutions already shown in for the hexagon with rather “sharp” corners (i.e., corners that are rounded by circular arcs with 12° angular openings). Contrary to appearance, in this and in the previous figures (i.e., Figs. –), the ARS succeeds in producing only one solution τ (θ) for each angle θ, so that the fact that the solutions appear to lie on two curves (here a circle and a hexagon) does not betray the failure of the ARS, but rather is a sign of the inadequacy of the ICBA estimator, probably due, in this example, to the presence of the rather “sharp” edges on the boundary of the body.
FIGURE 11 Polar representation of the locations of the minima of the cost functional JICBA in the backscattering configuration for an equilateral hexagonal cylinder. c1 = 0.07 m, c2 = 6°, c = 340 m/s, b = 0.26 m. The data was simulated with 204 BEM knots. L = 24 was chosen in the ICBA estimator. The ⋄ apply to the reconstructed boundary after application of the ARS to data obtained from 6 and 8 kHz probe radiation and the continuous curve with dots to the actual boundary.
To substantiate this hypothesis, we progressively reduced the “sharpness” of the corners of the hexagon by increasing the angular openings of the circular arcs of the rounded corners. , which applies to 20° circular arcs, indicates an improvement in that a lesser amount of the reconstructed points are on the circular boundary and a greater amount are very close to the correct hexagonal boundary. is the result for 30° circular arcs, and indicates that no apparent ambiguity persists in that that now all the points are very close to the correct hexagonal boundary. In this example, the ICBA reveals itself to be a good estimator and the ARS a very effective artifact elimination device. In the next sections we shall find out whether the ICBA–ARS tandem is as effective when the data is real (instead of being simulated numerically).
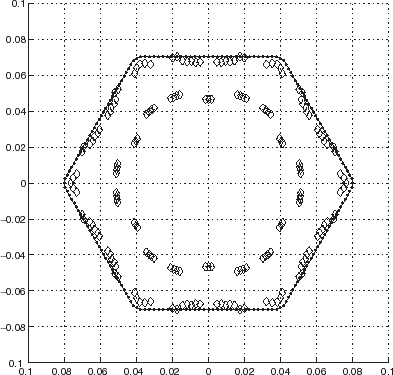
FIGURE 12 Polar representation of the locations of the minima of the cost functional JICBA in the backscattering configuration for an equilateral hexagonal cylinder with rounded corners. c1 = 0.07 m, c2 = 10°, c = 340 m/s, b = 0.26 m. The data was simulated with 204 BEM knots. L = 24 was chosen in the ICBA estimator. The data is synthetic. The ⋄ apply to the reconstructed boundary after application of the ARS and the continuous curve with dots to the actual boundary.
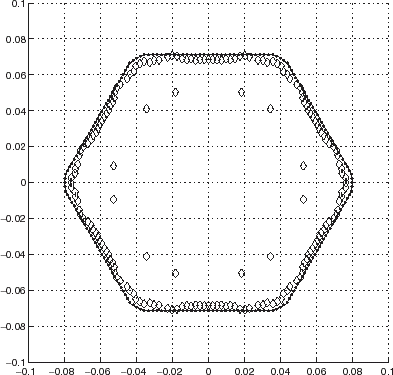
FIGURE 13 Polar representation of the locations of the minima of the cost functional JICBA in the backscattering configuration for an equilateral hexagonal cylinder with rounded corners. c1 = 0.07m, c2 = 15°, c = 340 m/s, b = 0.26 m . The data was simulated with 204 BEM knots. L = 24 was chosen in the ICBA estimator. The data is synthetic. The ⋄ apply to the reconstructed boundary after application of the ARS and the continuous curve with dots to the actual boundary.
11 Experimental procedure for acquiring real scattered field data
The experiment took place in an anechoic chamber in order to avoid, as much as possible, reflected radiation from the walls of the enclosure which might attain the microphone whose role is to detect only the sum of the incident field and the field scattered by the body. This (total) field is the response of the body, assumed to be in free space, to monochromatic audible sound radiated by a fixed (in terms of position) loudspeaker. The (pressure) wave associated with the incident sound field is practically plane because the distance between the loudspeaker and the body was chosen to be sufficiently large compared to the wavelength for the body to be in the Fraunhofer (far-field) zone of the loudspeaker. Moreover, an arrangement was sought such that the wavevector associated with the plane wave be perpendicular to the (z-) axis of the cylindrical object, this axis being assumed to be located somewhere within the body. The latter was made of a thick steel sheet and was thus acoustically rigid. The diffracted field is practically invariant with respect to the z-coordinate, as long as the length of the cylinder is much larger than its diameter (i.e., diffraction from the ends of the cylinder can be neglected, which was nearly the case herein). Thus, the experiment conformed rather well to the two-dimensional (2D) nature of the problem assumed in the theory (and notably in the ICBA model for the estimator).
The object of the experiment was to acquire data pertaining to the diffracted field in the x − y plane (see ). More precisely, the loudspeaker was fixed and the pressure field was picked up by a fixed microphone (such that the angle ψ between the two is nil), while the object made a complete revolution about its (z-) axis. As mentioned previously, this measurement procedure is equivalent to the one in which the object is fixed and the loudspeaker/microphone set is rotated about the z-axis, assuming that the angle between the loudspeaker and microphone with respect to the origin in the x − y plane is fixed. We adopted this second interpretation of the experimental procedure, except that we chose, amongst the continuum of pressure measurements, only a discrete set of M pressures. To each of these pieces of data (i.e., the amplitude and phase of the total pressure (
) corresponds an angle (polar) of incidence
(defined by the position of the loudspeaker) and an angle (polar) of diffraction θm (defined by the position of the microphone), the difference between these two angles, as well as the distances object/microphone (in fact, b) and loudspeaker/object, being constant.
The electroacoustic components of the experiment are depicted in . The loudspeaker was a BST 200 W high frequency wideband tweeter connected to an EMB power amplifier. The Bruel&Kager 4190 microphone was connected to a B&K2690A Nexus conditioning amplifier. Its distance (b) from the center of rotation O (within the object) was a few tens of centimeters. A Hewlett Packard HP3314 signal generator was used to synthesize the amplitude modulated signal. A HP Paragon spectrum analyzer with a source module provided the low frequency signal used by the HP3314 generator for the amplitude modulation and at the same time was used to measure all the the fields in the time capture mode.
FIGURE 14 Electroacoustic components of the experimental setup.
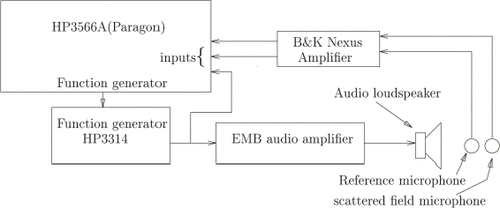
FIGURE 15 Comparison between real and synthetic data: polar representation of the modulus of the scattered pressure fields in the backscattering configuration for a 2 mm thick steel hexagonal cylinder (height 1.3 m) such that c1 = 0.07 m. c = 340 m/s, b = 0.26 m, f = ω/2π = 6 kHz. The synthetic data was obtained with 204 BEM knots. The continuous curve represents the synthetic data. The continuous curve with dots designates the experimental (real) data.
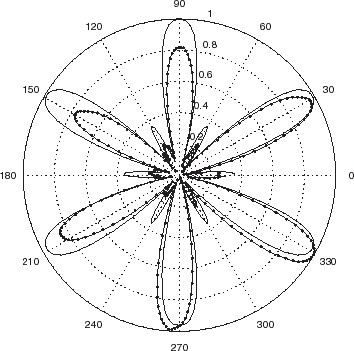
FIGURE 16 Comparison between real and synthetic data: polar representation of the phase of the scattered pressure fields in the backscattering configuration for a 2 mm thick steel hexagonal cylinder. Same parameters as in . The continuous curve represents the synthetic data. The continuous curve with dots designates the experimental (real) data.
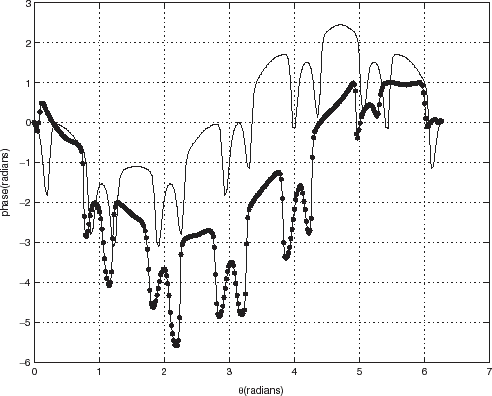
FIGURE 17 Comparison between real and synthetic data: polar representation of the modulus of the scattered pressure fields in the backscattering configuration for a 2 mm thick steel hexagonal cylinder (height 1.3 m) such that c1=0.07 m. c = 340 m/s, b = 0.26 m, f = ω/2π = 8 kHz. The synthetic data was obtained with 204 BEM knots. The continuous curve represents the synthetic data. The continuous curve with dots designates the experimental (real) data.
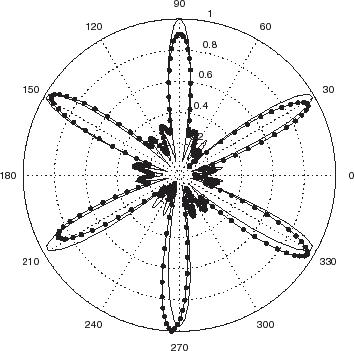
FIGURE 18 Comparison between real and synthetic data: polar representation of the phase of the scattered pressure fields in the backscattering configuration for a 2 mm thick steel hexagonal cylinder. Same parameters as in . The continuous curve represents the synthetic data. The continuous curve with dots designates the experimental (real) data.
The cylindrical body was placed vertically and attached firmly to a B&K3921 motorized turntable which is remotely controlled by a B&K2305 level recorder. It took 80 s to do one revolution. All the signals were acquired and subsequently processed in the MATLAB environment using the signal processing toolbox. The signals associated with the probe radiation were time-harmonic i.e., monochromatic. According to what was written in the previous section, two of these signals, at two frequencies ω1 and ω2, are required to eliminate the artifacts. These signals were produced by an amplitude-modulation technique. The files containing the time captured signals (80 s duration and sampled at most at maximum 1 048 576 Hz rate) were divided into blocks of N points (512, 1024 … i.e., powers of 2) each. A fast Fourier transform is then carried out on these blocks. This information was displayed as a spectrogram, i.e., a discrete temporal Fourier transform computed using a sliding window. The signal being a double sided band, carrier transmitted amplitude modulated, three distinct peaks make their appearance on the frequency axis. Access to the amplitude and phase of each frequency (in fact, only two of these are needed) for the whole sequence was obtained by choosing the corresponding column number in the time–frequency table. In order to avoid the Gibbs phenomenon which arises from the truncation of an infinite series, a window was applied to reduce the side lobes. The rectangular (Box-Car) function was chosen for this purpose. When determining the phase, it is crucial to have at one's disposition a second signal which serves as a reference to the incident and the total fields. Our reference signal was taken from the output of the signal generator that synthesizes the amplitude modulated wave. This output is not polluted by the diffracted field as would be a microphone placed at the mouth of the speaker in the anechoic chamber. The complex diffracted field was obtained by subtraction of the incident field (in the absence of the body) from the total field (in the presence of the body). This was done using the amplitudes and phases of the incident and total fields which were computed from the real and imaginary parts of the Fourier transforms of the corresponding signals.
To get an idea of how the experimental results match their simulated counterparts, we compare the two (i.e., amplitudes and phases of the scattered fields), for two frequencies of the probe radiation, in –. One notes therein a pronounced similarity of the main features of the scattered fields, but significant quantitative differences, especially in the phases. Most of these differences appear to have a systematic (i.e., nonstochastic) nature, which suggests that adding random noise to synthetic data is not the proper way (often employed in inverse scattering studies such as [Citation7,Citation9]) of simulating the errors in real data.
12 Recovery of the boundary of the body from real scattered field data
The procedure is similar to the one described in Section 8. This means that the analysis is based on the employment of the JICBA cost functional defined in (Equation8.7(--8-7) ) wherein
is now the scattered field data acquired experimentally in the manner described in the preceding section.
constitutes a polar representation of the positions of the minima of JICBA for real data obtained by scattering of audible sound from a hexagonal cylinder at two rather high frequencies. The comparison of this figure with and shows that when the frequency is lowered the number of candidate solutions in the interval [ρ0,b] diminishes. This is in agreement with the prediction of (Equation8.11(--8-11) ) and with what is found in [Citation7].
FIGURE 19 Polar representation of the locations of the minima of the cost functional JICBA obtained from experimental data with 14 kHz and 16 kHz probe radiation in the backscattering configuration for the 2 mm thick steel hexagonal cylinder (height 1.3 m) such that c1 = 0.07 m. c = 340 m/s, b = 0.26 m, L = 24. The crosses pertain to 16 kHz and the asterisks to 14 kHZ probe radiation.
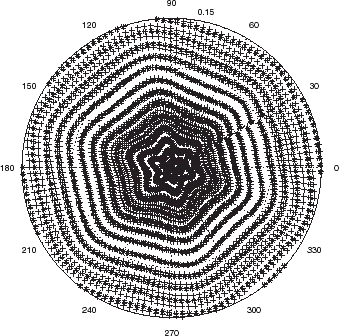
FIGURE 20 Same as except that the two probe frequencies are 10 kHz (crosses) and 8 kHz (asterisks).
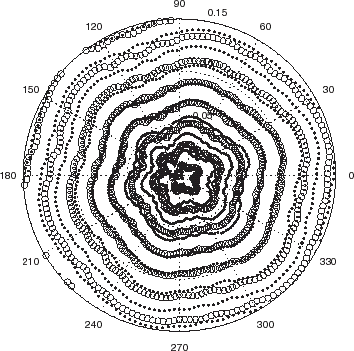
FIGURE 21 Same as except that the two probe frequencies are 8 and 6 kHz.
As in the case of simulated data, we are faced with the task of eliminating the artifacts. When the data is real, the method (ARS) we described in Section 10 is not very successful because it is based on the assumption that, at each angle, there exists one and only one value of τ which does not change when the frequency is changed from ω1 to ω2. A more oft-encountered situation is that even the ℓ = 0 solution changes somewhat when the frequency changes. We hypothesize, on the basis of (Equation8.11(--8-11) ), that this change must be smaller for the ℓ = 0 solutions than for the ℓ ≠ 0 solutions. Unfortunately, there is no way of knowing which, amongst the various solutions, is the one corresponding to ℓ = 0. Typically, after scanning the cost function at a given angle and frequency ωj, one finds minima at positions
, with there being no relation between ℓ and nj. Actually, the indices attached to the roots only indicate their order of appearance, i.e.,
. Let
designate the distance between a generic root at frequency ω1 and another generic root at frequency ω2. The index n2 for which
in the set
is minimal is designated by
. The index n1 for which
in the set
is minimal is designated by ν. Thus, finding the index ν by successive minimization enables finding the root rν. The latter is the one (in order of appearance when increasing r) that changes by the smallest amount when the frequency is changed from ω1 to ω2. This root is chosen, by hypothesis, to be the correct solution at the given angle.
This procedure is illustrated graphically in and is repeated at the other angles so as to obtain the full discretized shape function in unsupervised manner on the computer.
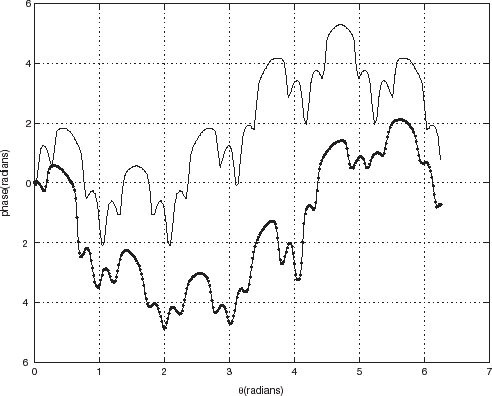
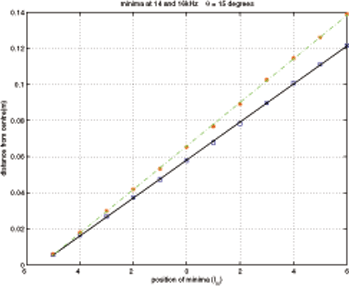
FIGURE 22 Positions (ℓ, r) of the minima of the cost function JICBA at θ = 15° for the 2 mm thick steel hexagonal cylinder obtained from experimental (real) data. The two lines are the result of applying linear regression for the points corresponding to 14 kHz (squares) and 16 kHz (asterisks) data. The slopes of these lines are found to be very close to the theoretical slope π/k of the simple formula (Equation8.11(--8-11) ). The correct radius corresponds to the ordinate at which two points on the two lines are at the same height (i.e., more specifically, the difference of their heights is minimal with respect to the difference of heights of any other pairs of points on the two lines). In this example, the correct radius is 0.09 m, corresponding to the ℓ = 2 minimum at 16 kHz and to the ℓ = 3 minimum at 14 kHz.
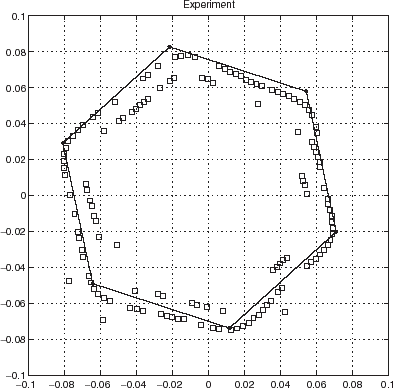
We carried out this procedure (termed hereafter “modified artifact removal scheme” (MARS)) for a metallic equilateral hexagonal cylinder probed by various pairs (two different frequencies) of audible sound signals. depicts the result for the two lowest frequencies. One observes a rather low resolution reconstruction as well as the presence of jumps at a few angles. Note should be taken of the fact that MARS shares with ARS the feature of providing a single solution τ at each angle θ. Thus, when a boundary reconstruction appears to alternate between two curves, this does not mean that two solutions are obtained at certain angles, but is rather indicative of data error and/or estimator error. In fact, this oscillation between two curves is seen to increase with the frequencies of the pair of probe radiations in –, but the solutions on the “correct” curve also seem to get closer to the actual boundary as the frequency is increased. The same holds true for the “false” curve, so that the pair of candidate curves actually approaches the right boundary when the frequency increases. The resolution of the “correct” boundary also increases when the frequency of the pair of probe radiations increases. This is in agreement with what has been found in [Citation7]. Finally, it should be pointed out that the orientation of the hexagonal cylinder was changed (actually, it was the loudspeaker/microphone pair that was rotated by a certain amount about the z-axis) in going from the experiment relative to to the one relative to . It can be observed that this new orientation is correctly detected by the ICBA/MARS inversion procedure.
FIGURE 23 Polar representation of the locations of the minima, after application of MARS, of the cost functional JICBA obtained from experimental data with 6 and 8 kHz probe radiation in the backscattering configuration for the 2 mm thick steel hexagonal cylinder (height 1.3 m) such that c1 = 0.07 m. c = 340 m/s, b = 0.26 m, L=24. The □ designate the reconstructed boundary while the dark continuous lines delineate the true boundary of the body.
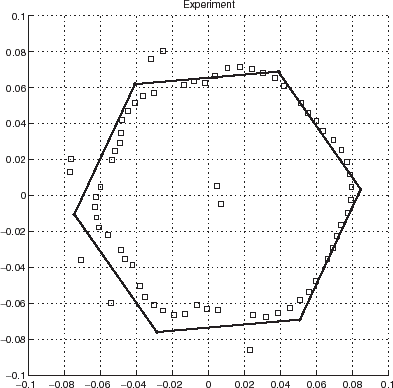
FIGURE 24 Same as except that the two probe frequencies are 8 and 10 kHz. Moreover, now the ⋄ designate the reconstructed boundary while the dark continuous lines again delineate the true boundary of the body.
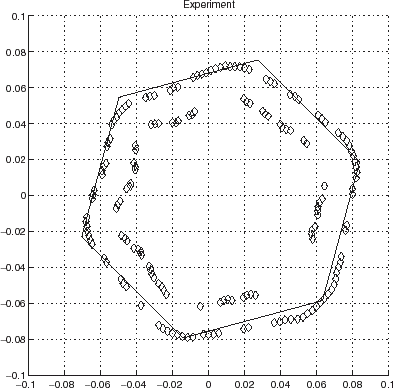
FIGURE 25 Same as except that the two probe frequencies are 14 and 16 kHz.
It is often stated that solving inverse problems is an unstable process [Citation14], meaning that the reconstruction is highly sensitive to data error. Consider the reconstruction of , recall the error (depicted in –) of the experimental data used to obtain this reconstruction, and compare to the reconstruction of obtained with (near-exact) synthetic data. If the jumps along the profile are any measure of instability, then there is no significant change resulting from the use of real instead of synthetic data. However, if one adopts the more obvious measure of stability, which is the proximity of the reconstruction to the original, then it is seen that the use of error-ridden (real) data instead of near-exact (synthetic) data has produced some, although not a catastrophic amount of, instability.
Another form of instability should result from estimator error since the data and the estimator are on a similar footing in the discrepancy functional J. This issue was illustrated in the series of – corresponding to reconstructions employing what amounts to estimators with different amounts of error. In this case, the instability appears to manifest itself more strongly by increased amounts of jumps in the profile function of the boundary for increased estimator error.
Finally, we make a remark concerning the choice of the probe radiation frequencies. Figures – show that the data error varies with frequency. The same is obviously true of the estimator error. It would appear to be most reasonable to employ, in the ARS and MARS, two sets of data that have approximately the same magnitude of error, the same holding true for the estimators. The only foolproof way to do this is to choose the two frequencies to be as close as possible to each other. But when the two frequencies are close, the two sets of reconstructions are close which makes it more difficult to apply the ARS and MARS procedures. Thus, a compromise must be made. Other than this, whether the two chosen frequencies should be high, medium or low, as a general rule (see the previous discussion) the resolution (i.e., finesse of the details in the boundary of the body) increases with the frequency of the probe radiation, but this advantage may be offset by the increased amounts of artifacts and any errors that might accrue in the data and/or estimator due to the use of high frequencies. As concerns the case of experimental data, the choice of frequency is generally dictated by the availablility and performances of the equipment.
13 Discussion
This investigation was concerned with the recovery of the boundary of a cylindrical body from both synthetic (i.e., simulated by a boundary element code) and real (i.e., measured in an experimental setup employing audible sound probe radiation) scattered field data. We list hereafter some of the results of our study.
| 1. | R1 It was first shown empirically (for synthetic data relative to scattering from a circular cylinder) that the solutions of the inverse problem, embodied by the locations at which a certain discrepancy functional has minima (both local and global), are not unique and seem to organize themselves in regular patterns. | ||||
| 2. | R2 A detailed mathematical analysis was carried out to explain this result, and it was found that if a sufficient amount of (exact) data is available, and the totality of this data is employed (using an exact estimator) to solve the boundary-identification problem, then the latter should have a unique solution. | ||||
| 3. | R3 By the same token, if either the estimator is not exact and/or not all the data is taken into account during the inversion, then it is possible to account for the observed nonuniqueness. | ||||
| 4. | R4 Moreover, a simple formula was found which accounts for the previously-mentioned regular patterns along which the multiple solutions organize themselves. | ||||
| 5. | R5 It was shown theoretically (for a circular cylindrical body, but probably applicable to other body shapes) that when data and estimator errors are equal, then amongst the possible solutions there exists one for which the discrepancy functional attains a global minimum and this solution is the correct solution to the inverse problem. | ||||
| 6. | R6 On the contrary, when the data and estimator errors are not equal, then the correct solution does not generally correspond to a global minimum, nor even to a relative minimum of the discrepancy functional. | ||||
| 7. | R7 It was also shown by means of a perturbation analysis and computationally, with synthetic data and an estimator appealing to the ICBA description of the wave–body interaction, that the nonuniqueness makes its appearance, and the simple formula is applicable with trivial changes, when cylindrical bodies have more general shapes (elliptical, square, hexagonal, etc.). | ||||
| 8. | R8 The simple formula suggests that only one, amongst the above-mentioned solutions, does not depend on the frequency of the probe radiation, and this fact was used to eliminate the spurious solutions (termed artifacts) by employing synthetic data obtained with probe radiation at two frequencies. | ||||
| 9. | R9 The capacity of this technique (termed ARS) to filter out the unwanted solutions was demonstrated for cylindrical bodies with various shapes and locations. | ||||
| 10. | R10 It was suggested that a type of instability (not to be confounded with non-uniqueness which is resolved by the ARS) which appears for bodies with corners, or that are very different from circular cylinders (e.g., elongated elliptical cylinders), is attibutable to the inability of the ICBA to accurately describe the body–wave interaction (for these bodies). | ||||
| 11. | R11 The experimental device and procedure for acquiring real data for audible acoustic probe radiation was described and the data so obtained was compared to the corresponding simulated data. | ||||
| 12. | R12 It was thus shown that real data can differ substantially from synthetic data, and this difference shows up most strongly in the phase of the scattered field. These differences turn out to be not due to (random) noise, as is usually assumed in theoretical/numerical studies of inverse scattering problems, but to systematic errors in the experimental procedure. Many of these errors were eliminated with respect to those in a previous set of experiments (see [Citation13]), but there is always a residual that it is very difficult and costly to get rid of. | ||||
| 13. | R13 The locations of the minima of the discrepancy functionals, for real data and an ICBA estimator, were exhibited for a hexagonal cylinder submitted to probe radiation having various frequencies. It was shown that these locations follow the same type of pattern as for synthetic data and the number of spurious solutions increases with frequency, in agreement with the theoretical prediction (i.e., the simple formula). | ||||
| 14. | R14 A modified form of the ARS (called the MARS) was employed to eliminate the artifacts and it was shown that the errors due to both the employment of the ICBA as the estimator, and those inherent in the experimental data, account for the above-mentioned instabilities of the reconstruction of the boundary, but these instabilities turn out to be within reasonable limits considering the amplitude of the estimator and data errors. | ||||
It is appropriate at this stage to provide answers to the following questions: what is the progress obtained in this investigation and/or the change of perspective with respect to former studies treating problems of the kind addressed herein?
| 1. | A1 The great majority of studies concerning inverse scattering problems have relied on synthetic data (e.g., [1,6–9]). Often, reconstructions of the boundary of the target have turned out to be surprisingly accurate, considering that it is known that the inverse problem is fundamentally ill-posed ([6,14]), and that, in some cases, accurate reconstructions were obtained with relatively small amounts of data. This may have been one of the reasons why researchers in this field have been admonished by the authors of [6] not to commit the inverse crime, i.e., not to employ the same theoretical model for generating data as for estimating the latter. To avoid this “crime”, researchers generally add random noise to their synthetic data (e.g., [7,9]), with the additional implication that, in so doing, they simulate experimental error. R12 shows that this may not be a valid assumption. Even before this finding, it was felt by the pioneers in this research community, such as Kleinman [15], that the only convincing way to test an inversion scheme is by making use of real data (i.e., obtained experimentally). This point of view slowly gained more and more adepts before culminating in a special issue of the journal Inverse Problems in 2001 entitled “Testing inversion algorithms against experimental data” [16]. | ||||
| 2. | A2 The present investigation is in line with the contributions in [Citation16], but applies to acoustic instead of electromagnetic wave data, and to impenetrable bodies instead of both penetrable and impenetrable bodies treated in [Citation16]. Furthermore, in most of the studies in [Citation16], either exact or linearized (e.g., based on the Born approximation) models are used in the estimator, whereas here we employ a nonrigorous (ICBA) model which preserves the intrinsic nonlinearity of the estimator with respect to the sought-for parameters (discretized form of the boundary shape function). | ||||
| 3. | A3 The ICBA, in its present form, is a very particular scattering model which applies only to scattering by a single homogeneous or coated object, each boundary or interface of which can be described by a function such as | ||||
| 4. | A4 The advantage of the ICBA over other models that could be employed to evaluate the effect of estimator error on boundary reconstructions is that it lends itself readily to a mathematical analysis which is exact for a circular cylinder and asymptotic for bodies of near-circular shape. Such evaluations appear to be absent in the papers in [Citation16] although there is clear evidence of artifacts in several of the papers of this special issue [Citation17–Citation20]. Actually, some of these artifacts (i.e., those associated with the use of the Born approximation in the estimator) have already been observed for a long time. A few years ago, an effort was made to account for the existence and positions of these artifacts theoretically [Citation21] and another contribution was devoted to a scheme for eliminating the artifacts [Citation22]. The present work is in the spirit of [Citation21] although it applies to a different type of estimator error. | ||||
| 5. | A5 As pointed out previously, most works on inverse problems do not overly stress the nonuniqueness issue. The reason for this can be sought in the following. Although the point of departure in these studies is similar to the one herein, i.e., minimize a discrepancy functional, the point of arrival is different, in that these studies employ algorithms such as the ones of Nelder–Mead, Levenberg–Marquardt, etc. (see [Citation1,Citation9,Citation13] for applications of these algorithms) to find the minimum, implicitly assuming that there is only one such minimum. These algorithms require starting values of the sought-for parameters (i.e., location of the minimum) and they actually hone in on the minimum closest to these starting values, which means that if a different starting value is provided, the solution is different. This was observed in investigations such as [Citation7–Citation9]; in most other publications it either was not observed due to the fact that only one set of starting values was used, or was not considered to be a noteworthy issue. This problem is at the very heart of our contribution, and we show that the observed non-uniqueness is due to data and/or estimator error. | ||||
| 6. | A6 Other contributions [Citation10,Citation11] dealing with simpler inverse problems also place stress on this particular aspect of boundary recovery via scattered waves. In these works, it was shown that the key to success in resolving the problem is that the error in the data be identical to that in the estimator (substantiated by R5). However, this situation, which is equivalent to that of the inverse crime, is impossible to attain in a real-life setting appealing to real data, because there is no way to know the error of the data, nor to tailor the error of the estimator to the error of the data (if this was known). In [Citation10] it was stated that the best way to solve the problem is to use data that is as accurate as possible, and a model for the estimator which is as exact as possible. Herein, we took no heed of this recommendation, in that we relied on an approximate model and made use of (experimental) data that was obtained carefully, but not overly so (probably less so than in the experiments giving rise to the data employed in the studies of [Citation16]). The result of this procedure is that the reconstructions are far from being perfect. This may be unsettling for theorists, but familiar to those (e.g., geophysicists, radiologists, industrial engineers, etc.) who constantly deal with imperfect data (resulting from pre-existing acquisition devices that cannot be improved for economical or practical reasons) and approximate models (to speed up the inversions) in their down-to-earth practice. | ||||
Acknowledgements
This work benefited from financial support coming from two programs sponsored by the French Ministry of Research: (i) Programme Pluri Formations Recherche Multidisciplinaire sur les Problèmes Inverses de Champs, 1996-99 and (ii) Programme Pluri Formations Contrôle Non Destructif et Imagerie, 2000-2003.
- Scotti, T, and Wirgin, A, 1995. Shape reconstruction using diffracted waves and canonical solutions, Inverse Probs. 11 (1995), p. 1097.
- Wirgin, A, and Scotti, T, 1996. Wide-band approximation of the sound field scattered by an impenetrable body of arbitrary shape, J. Sound Vibr. 194 (1996), p. 537.
- Lesselier, D, and Wirgin, A, 1999. "Identification d'objets ou milieux par inversion de signaux acoustiques ouélectromagnétiques". In: Problèmes Inverses. 1999. p. p. 143, In: M. Bonnet (Ed.), N° 22 de la série Arago, OFTA/Tec et Doc, Paris, p. 143.
- Wirgin, A, 2000. Special issue: inverse problems in underwater acoustics, Inverse Probs. 16 (2000), p. 1619, (Ed.).
- Wirgin, A, 2002. "Acoustical imaging: classical and emerging methods for applications in macrophysics". In: Scattering. San Diego. 2002. p. p. 95, In: R. Pike and P. Sabatier (Eds.).
- Colton, D, and Kress, R, 1993. Inverse Acoustic and Electromagnetic Scattering Theory, Springer. Berlin. 1993.
- Kirsch, A, Kress, R, Monk, P, and Zinn, A, 1988. Two methods for solving the inverse acoustic scattering problem, Inverse Probs. 4 (1988), p. 749.
- Ghosh Roy, DN, Couchman, L, and Warner, J, 1997. Scattering and inverse scattering of sound-hard obstacles via shape deformation, Inverse Probs 13 (1997), p. 585.
- Scotti, T, and Wirgin, A, 1996. Shape reconstruction of an impenetrable scattering body via the Rayleigh hypothesis, Inverse Probs 12 (1996), p. 1027.
- Wirgin, A, 2002. Ill-posedness and accuracy in connection with the recovery of a single parameter from a single measurement, Inverse Probs. Engng. 10 (2002), p. 105.
- Buchanan, J, Gilbert, R, Wirgin, A, and Xu, Y, 2002. Depth sounding: an illustration of some of the pitfalls of inverse scattering problems, Math. Comput. Modell. 35 (2002), p. 1315.
- Ogam, E, Scotti, T, and Wirgin, A, 2001. Non-ambiguous boundary identification of a cylindrical object by acoustic waves, C. R. Acad. Sci. IIb 329 (2001), p. 61.
- Ogam, E, and Wirgin, A, 2001. "Caractérisation de forme et de taille d'objets par inversion nonlinéaire de données portant sur le son diffracté". In: Systèmes pour la Caractérisation. Vol. 2. Paris. 2001. p. p. 447, In: F. Lepoutre, D. Placko and Y. Surrel (Eds.), C2I 2001.
- Bui, HD, 1993. Introduction aux Problèmes Inverses en Mécanique des Matériaux, Eyrolles. Paris. 1993.
- McGahan, RV, and Kleinman, RE, 1996. Special session on image reconstruction using real data, IEEE Antenn. Prop. Mag. 38 (1996), p. 39.
- Belkebir, K, and Saillard, M, 2001. Special issue: testing inversion algorithms against experimental data, Inverse Probs. 17 (2001), p. 1565, (Eds.).
- Duchêne, B, 2001. Inversion of experimental data using linearized and binary specialized nonlinear inversion schemes, Inverse Probs. 17 (2001), p. 1623.
- Marklein, R, Balasubramanian, K, Qing, A, and Langenberg, KJ, 2001. Linear and nonlinear iterative scalar inversion of multi-frequency multi-bistatic experimental electromagnetic scattering data, Inverse Probs. 17 (2001), p. 1597.
- Testorf, M, and Fiddy, M, 2001. Imaging from real scattered field data using a linear spectral estimation technique, Inverse Probs. 17 (2001), p. 1645.
- Tijhuis, AG, Belkebir, K, Litman, ACS, and de Hon, BP, 2001. Multiple-frequency distorted-wave Born approach to 2D inverse profiling, Inverse Probs 17 (2001), p. 1635.
- Delamare, S, Lefebvre, J-P, and Wirgin, A, 2000. Ghosts in Born images of a layer probed by acoustic waves, Ultrasonics 37 (2000), p. 633.
- Delamare, S, 1999. Une amélioration de la tomographie ultrasonore en réflexion, C. R. Acad. Sci. Paris IIb 327 (1999), p. 475.