
ABSTRACT
This study examines the deterrent effects of neighbourhood watch signs and police signs as measures of symbolic guardianship on burglars versus non-offenders. In a virtual reality experiment, 181 burglars and 172 non-offenders scouted a virtual neighbourhood and were exposed to neighbourhood watch signs and/or signs suggesting police surveillance in the area. With neighbourhood watch signs present, both burglars and non-offenders perceived the neighbourhood residents as more likely to intervene. Burglars were also more likely to select a target closer to the exit than non-offenders when neighbourhood watch signs were present. The presence of police signs reduced the time spent scouting and the distance travelled for both burglars and non-offenders. Furthermore, as compared to non-offenders burglars selected houses with easier access, travelled less distance, and reported higher anticipation of neighbourhood resident intervention. Symbolic guardianship through neighbourhood watch or police sign seems to elicit only small effects in deterring burglars. They should not immediately be discounted as preventive measures, however, as small-effect interventions may be valuable as additions to well-established interventions.
The presence of people has been shown to be one of the most robust factors deterring offenders, including burglars (Coupe & Blake, Citation2006; Cromwell et al., Citation1991; Wright et al., Citation1995). This presence is often captured by the term guardianship, which refers to ‘any spatiotemporally specific supervision of people or property by other people which may prevent criminal violations from occurring’ (Felson & Cohen, Citation1980, p. 392). Although generally interpreted in terms of the physical presence of individuals, guardianship can also be symbolic in nature, for example through neighbourhood watch signs or CCTV (closed-circuits cameras), which signals, or serves as a reminder, that offenders may be watched. Indeed, like Hollis et al. (Citation2013, p. 66) argue, the most important mechanism involved in guardianship may be the feeling that someone is watching and could observe criminal behaviour.
The main goal of the present research is to examine the deterrent effects of signs suggesting symbolic guardianship. We distinguished between two types of signs: (1) neighbourhood watch signs signalling residents are vigilant and keep an eye out for suspicious behaviour, and (2) signs suggesting police surveillance in the area. We capitalise on the possibilities of virtual reality (VR) to experimentally examine these effects among an offender sample. In the experiment, incarcerated domestic burglars were invited to scout a virtual neighbourhood for committing a potential burglary and to select a target. During this process, they were exposed to either neighbourhood watch signs, police signs, both types of signs, or neither. Responses were compared between experimental conditions, and with the responses of a group of undergraduate students undertaking the same assignment.
Symbolic guardianship
Cohen and Felson’s (Citation1979) Routine Activity Theory (RAT) revolves around the assumption that when a suitable target and a motivated offender converge in time and space in the absence of a capable guardian, crime is most likely to happen. Guardians can operate in a formal or informal role: formal guardians exercise guardianship in some official capacity, such as police and security personnel, whereas informal guardians, such as neighbourhood residents and passers-by, do not (Elffers & Ruiter, Citation2016). Although increasing the number of guardians has consistently been shown to negatively impact crime rates, including residential burglary (e.g. Cohen & Cantor, Citation1981; Miethe et al., Citation1987), achieving permanent and ubiquitous guardian presence is practically unfeasible.
Extensions of the original notion of guardianship stretch beyond the physical presence of individuals (Hollis-Peel et al., Citation2011). These extensions assume that guardianship does not have to be rooted in the objective properties of the situation, but can also be based on the suggestion of being watched (Hollis et al., Citation2013). An example is CCTV. Although it is unknown to a would-be offender whether or not someone is actively monitoring the CCTV footage, the mere possibility implies that any criminal activity in the field of view of the camera runs the risk of being observed (Jones & Pridemore, Citation2019). Guardianship can even be illusory, as with signs that warn of dogs when no dogs are present, or when a supposed CCTV camera is just a dummy (Hollis et al., Citation2013). Suggesting a possible presence of inhabitants in a house, leaving the burglar unsure if this is actually the case, thus also reflects symbolic guardianship.
A phenomenon showing resemblance to symbolic guardianship is the ‘watching eyes effect’ (Bateson et al., Citation2006). Research into this phenomenon uses pictures of eyes or stylised eye images to cue this illusion with the goal of reducing antisocial behaviour or, conversely, encouraging prosocial behaviour (Bourrat et al., Citation2011; Cai et al., Citation2015; Pfattheicher & Keller, Citation2015). The assumption here is that the images of eyes serve as a reminder that someone might be watching (Bourrat et al., Citation2011). For example, in the first study to test this effect, people paid 2.76 times as much in donations to an honesty box in a university break room when a picture of eyes was attached to the cupboard door above the honesty box (Bateson et al., Citation2006).
The Watching Eyes phenomenon also has been found in studies on antisocial and criminal behaviour (Dear et al., Citation2019). For example, in an intervention study on bicycle theft (Nettle et al., Citation2012) signs which showed a pair of male eyes, paired with the headlines ‘Cycle Thieves: We Are Watching You’ and the logo of the local police force were placed on a campus where bicycle theft was high. The results showed a reduction of 62% in the number of bicycles stolen compared to the same time the previous year.
Neighbourhood watch signs and police signs
In the Netherlands, where the present study was conducted, the use of neighbourhood watch signs (see ) is a common occurrence. These signs suggest that residents may report suspicious behaviour via mobile phone chat groups (Lub, Citation2018; Pridmore et al., Citation2019). These mobile chat groups and signs have been around since 2005, and since 2015 over 7,520 of such groups have been registered online (Lub, Citation2018; Pridmore et al., Citation2019); neighbourhood watch signs have become prominently present in many Dutch streets, although their exact number is unknown. As such, these signs constitute a form of symbolic guardianship by referring to the existence of a neighbourhood watch in an area and suggesting resident’ vigilance. Although neighbourhood watch schemes have been associated with crime reduction (Bennett et al., Citation2008), neighbourhood watch signs may not reflect the actual existence of neighbourhood prevention or chat groups in a certain area. Hence, neighbourhood watch signs are more similar to ‘beware of dog’ signs or CCTV cameras where the observer is ignorant of the actual level of objective guardianship involved.
Figure 1. Neighbourhood Watch Sign (Translation: ‘Attention, WhatsApp neighbourhood prevention’) and Police Sign (Translation: ‘Burglars pay attention! We are watching you’).

An early correlational study by Akkermans and Vollaard (Citation2015) on the effectiveness of neighbourhood watch signs immediately following their introduction in a medium-sized city in the Netherlands reported a reduction of 40% in burglary rates (Akkermans & Vollaard, Citation2015). However, as this study was publicly announced, it may have raised public awareness and influenced social norms contaminating the results of the study. In addition, neighbourhood watch signs have since become a common in the Netherlands, which might reduce the credibility of the notion that there is an actual neighbourhood watch. In the present study, we used an experimental design and randomly varied the presence or absence of neighbourhood watch signs as a measure of informal symbolic guardianship.
Symbolic guardianship can also be formal, such as by suggesting possible police presence (Elffers & Ruiter, Citation2016). Being able to exert formal symbolic guardianship via signs could be a valuable addition to formal physical guardianship. In the Netherland one attempt has been made with police signs acting as a symbolic guardianship measure. This sign states ‘Burglars pay attention! We are watching you’ (see ), and has the logo of the Dutch police below this message. The signs have only been placed for a brief period in one city in the Netherlands, and no data are available on their effectiveness.
The signs contain a similar message as the one used in the bicycle theft study, but without the pair of eyes (Nettle et al., Citation2012). The question is whether burglars will believe a sign that states the police is potentially watching, as the presence of a police officer in a neighbourhood is far less likely than that of a neighbourhood resident (Reynald, Citation2014). Contrasting the effect of the presence of neighbourhood watch signs with signs signalling the police is watching will highlight which source of guardianship – formal or informal – deters burglars and to what extent.
Deterrence of symbolic guardianship in burglars vs. non-offenders
Experimental studies on symbolic guardianship ideally involve actual burglars as research participants, as they possess unique expertise which has been shown to critically impact their decision-making (Nee & Ward, Citation2015). Burglars automatically scout their environment for potential targets and display effective and largely automatic recognition and assessment of cues related to burglary (Nee, Citation2015). Indeed, differences between novices and experts in burglary decision-making have become apparent in research comparing burglars with non-offenders (Clare, Citation2011). Expert burglars, for example, tend to select different targets than novices (Nee & Meenaghan, Citation2006), target houses further away from their home (Snippe et al., Citation2014), take routes towards their target that are less risky, and steal smaller but more valuable items (Nee et al., Citation2015, Citation2019).
Burglars also differ from non-offenders in their response to actual guardians (van Sintemaartensdijk et al., Citation2021). The presence of guardians has been argued to be the most relevant cue in the decision-making process to commit burglary (Bennett & Wright, Citation1984; Homel et al., Citation2013; Nee & Taylor, Citation2000). One key question is to what extent burglars are influenced by symbolic (and potentially illusory) guardianship, especially given experience-based expertise. For example, are they quick to dismiss signs as no immediate physical guardianship is visible, or might they be more attuned to the signs to assess whether guardians are actually present? Based on the research literature on burglars, it is likely that burglars are more attuned to assess the level of guardianship (Reynald, Citation2017). If signs can effectively elicit symbolic guardianship, burglars hence are more likely to be aware of the signs and adjust their behaviour accordingly. Comparing burglars to non-offenders concerning the deterrent effect of neighbourhood watch and police signs can highlight how burglar expertise plays a role in the deterrent effects of (symbolic) guardianship.
The current research
The present study was part of a larger research programme, the Virtual Burglary Project (VBP), which studies burglar decision-making using virtual environments. The present study examines the effect of signs reflecting symbolic guardianship on burglar deterrence and differences in responses of burglars versus non-offenders, capitalising on the various affordances of VR to study offender decision making. VR allows for experimentally manipulating the effect of signs in simulated neighbourhoods that are rich in contextual detail (Mania & Chalmers, Citation2001; van Gelder et al., Citation2014). Furthermore, the portable nature of VR technology enables researchers to set up a research lab inside prison facilities, and hence to bring the scene of the crime to the offender and study their behaviour in real-time. Finally, the use of VR allows for combining multiple data sources, such as (subjective) questionnaire data and (behavioural) spatial data.
In two consecutive trials, participants were immersed in the same virtual neighbourhood in which they were exposed to signs representing informal (neighbourhood watch) or formal (police) symbolic guardianship. In the first trial, participants were instructed to scout the virtual neighbourhood for burglary opportunities. In the second trial, they were instructed to select the most attractive house to burgle in the neighbourhood. After finishing both trials, participants responded to a deterrence questionnaire. Additionally, we analysed the spatial movement patterns of participants (time spent scouting and distance travelled) in the neighbourhood and target selection (selected target). We examined the deterrent effects of neighbourhood watch signs and police signs and compared the responses and spatial behaviour of burglars with those of non-offenders. We anticipated higher perceived deterrence in burglars for both signs, given their heightened awareness towards guardianship (Reynald, Citation2017) and the previous established effects of neighbourhood watch signs (Akkermans & Vollaard, Citation2015) and police signs to deter bicycle thieves (Nettle et al., Citation2012). We further explored whether the signs would reduce burglars’ time scouting and distance travelled, and increase selection of targets with easier access and proximity to escape routes.
Method
Participants and design
In total 353 participants, 181 burglars and 172 university students, took part in this study. University students were chosen as a control group to highlight the differences between burglars and non-offenders in their response to neighbourhood watch and police signs. Mean participant age was 28.1 (SD = 9.0) for the overall sample, with 32.9 years (SD = 9.2) for burglars and 22.9 years (SD = 5.2) for non-offenders. The country of origin was the Netherlands for 43% of burglars and 81% of non-offenders. In exchange for participation, burglars were paid €5 according to the policy specified by the prison, whereas non-burglar participants received €7.50 in line with university guidelines. All participants were male, as data collected for the burglar sample occurred in male-only prisons. Prior to participation, participants received information about the general nature of the study – establishing what attracts and deters burglars in virtual neighbourhoods.
The study used a 2 (neighbourhood watch signs: present versus absent) x 2 (police signs: present versus absent) x2 (burglars vs. non-offenders) design. The experiment consisted of two consecutive trials. Trial 1 assessed scouting behaviour (time spent in the neighbourhood and distance travelled) and Trial 2 target selection (selected house to burgle). Dependent variables were perceived deterrence, time spent and distance travelled in Trial 1, and target selection in Trial 2. Inclusion criteria for both samples were being proficient in Dutch, being 18 years or older, and not suffering from epilepsy. Participants were randomly assigned to the experimental conditions.
Materials
Virtual neighbourhood
The virtual environment (VE) was developed using Unity Pro programming software (version 2017.3.1f1). The Oculus Rift DK2, a head-mounted display (HMD) with stereoscopic view, was used to view the environment. Furthermore, participants wore noise-cancelling over-ear headphones that delivered immersive audio, which included, for example, sounds of birds, cars, and the footsteps of the participant. Participants navigated the VE using a game controller and remained seated throughout the experiment.
The VE was designed to resemble a typical middle-class neighbourhood and consisted of several street segments, public squares, front and back gardens, and alleys (see ).
Figure 2. Neighbourhood lay-out.
Note: Yellow round indicates the starting point for all participants; red rounds indicate the placement of the signs; blue square indicate the exit points.
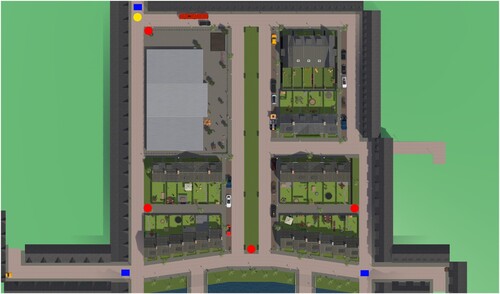
Houses in the VE were detailed and high-resolution terraced houses, each with a unique interior and with minor decorative variations on the outside in order to approximate a real-life neighbourhood as much as possible. Participants could enter the front and back gardens to look through the windows.
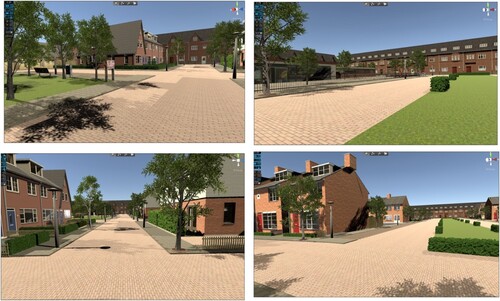
Several cars were parked in the neighbourhood and one car could be seen driving away at the start of Trial 1 (see ). Furthermore, two avatars (one female, one male) walked around the neighbourhood, and were in sight of participants but never came near them. We explicitly chose for these two avatars and one car driving away as presence of others in the neighbourhood, to ensure the signs would be the only token of (symbolic) guardianship. Implementing more avatars could confound the manipulation by introducing physical guardianship into the virtual environment.
Figure 3. Images of the virtual neighbourhood.
When participants had finished scouting the environment, they could leave the neighbourhood via one of three exits, which ended the trial. In the second trial, participants entered the virtual neighbourhood at the same location and were instructed to select the house they considered most suitable to burgle by clicking on it with the game controller. The target selection took place in a second trial to ensure Trial 1 only involved the scouting process. No limits were set to the time spend scouting or the when selecting the target.
Symbolic guardianship manipulation. The symbolic guardianship signs (see ) were placed at four locations in the neighbourhood to ensure a high probability of participants noticing them given the different possible spatial trajectories (see ). The first of these four locations was where participants entered the neighbourhood.
Spatial data. Throughout Trial 1, for each second in the virtual neighbourhood, x and y coordinates of each participant were tracked. These data yielded time spent (in seconds) in the virtual neighbourhood, as well as the distance travelled (in meters). These measures allowed examining whether police or neighbourhood watch signs would impact scouting behaviour.
Target selection. In Trial 2, participants were asked to select the house they considered most attractive to burgle. We coded if the house was located on the corner or not (allowing for easier access), size of the house (signalling affluence), the presence of a package in the front yard (signalling the likely absence of the homeowners), the presence of a ladder in the front yard (which in real life could be used for accessing the top floor), the distance of the house to the closest exit (reflecting if escaping the house when necessary would be easier), and distance to the nearest sign. We also coded the door through which participants would have entered the house, since entering the backdoor offer more cover. In addition, we coded what the door looked like (no glass panels, medium glass panels, or consisting mostly of glass) as glass panels can be broken and hence provide easier access.
Questionnaires
Perceived deterrence
Perceived deterrence was measured using 5-point scales (1 = strongly disagree; 5 = strongly agree). Items were developed for the current purposes and reflected key deterrent features: perceived difficulty to burgle (1 item, ‘This neighbourhood appears difficult to burgle’), neighbourhood attractiveness (1 item, ‘This neighbourhood is attractive to burgle’), chances of getting caught (1 item, ‘If you burgle in this neighbourhood, the chances of getting caught are small’), anticipated punishment (1 item, e.g. ‘If you burgle in this neighbourhood, the punishment will be low’), perceived social cohesion (2 items, α = .68, ‘Neighbourhood residents know each other well’ and ‘Neighbourhood residents look out for each other’), likelihood of calling the police (1 item, ‘Neighbourhood residents will call the police when they see a burglary taking place’), likelihood of intervening (1 item, ‘Neighbourhood residents will intervene when they see a burglary taking place’) and willingness to burgle (1 item, ‘If this neighbourhood would have existed in real life, would you have committed a burglary right now?’).
We then investigated the factor structure of perceived deterrence. A Kaiser-Meyer-Olkin measure of sampling adequacy indicated adequate sampling at .69. A principal-axis factor extraction – conducted to determine the factor structure with orthogonal rotation – yielded two factors with Eigenvalues larger than 1. The first factor (encompassing the items: difficulty to burgle the neighbourhood, neighbourhood attractiveness, chances of getting caught and willingness to burgle) had an Eigenvalue of 2.3 and explained 25.4% of variance. Factor loadings ranged from .50 to .70. The second factor (encompassing the items: resident willingness to call the police, resident willingness to intervene and social cohesion) had an Eigenvalue of 1.6 and explained 17.7% of variance. Factor loadings ranged from .40 to .60. No cross-loadings above .4 were observed. Factor 1 (4 items; M = 3.1, SD = 1.0, α = .66) was labelled ‘perceived neighbourhood deterrence’. Factor 2 (3 items; M = 3.3, SD = .9, α = .42) was labelled ‘resident deterrence’. Analyses were performed for both the two aggregate factors and the underlying individual items.
Manipulation checks
To check if participants had noticed the signs as intended, participants were shown the neighbourhood watch and police signs as well as two similar signs unrelated to the study after Trial 1. Participants were asked to provide a numerical estimate of how often they had encountered the signs in the virtual neighbourhood in Trial 1. Of those in the neighbourhood watch or both signs condition, 72% indicated to have seen the neighbourhood watch signs, for those in the police or both signs condition 60% indicated to have seen the police signs. In addition, they also indicated how often they had encountered the signs in the real world on a scale of 1–3 (never, a few times, often) to check for familiarity.
Gaming experience
To rule out the potential confounding effect of gaming experience, participants indicated the average number of hours per week they played games on a gaming console. For non-offenders, this was 3.06 h (SD = 5.5). Due to the restricted access to gaming consoles in prison, burglars rated the number of hours they played games on consoles before entering prison, which was on average 7.8 (SD = 21.8) hours per week.
Presence
An adapted version of the 8-item Short Spatial Presence Experience Scale (α = .75) (Hartmann et al., Citation2016) was used (1 = strongly disagree; 5 = strongly agree) (M = 3.1, SD = .6). Presence reflects the degree to which participants sense being physically present in the VE (Yildirim et al., Citation2019). The questionnaire was translated into Dutch, and for each question, the phrasing was adapted, from ‘ … the action of the presentation’ to ‘ … . the virtual neighbourhood’ for clarity purposes. One item from the original scale was removed for being too difficult for the burglar sample (e.g. ‘It was as though my true location had shifted into the action of the presentation’).
Cyber-sickness
To measure cyber-sickness, an abbreviated version of the 15-item Simulator Sickness Questionnaire (Kennedy et al., Citation1993) was used. To reduce participant burden, each core area of discomfort (nausea, stomach-ache, dizziness, lack of focus and blurry vision) was measured by a single item on a 5-point scale (strongly disagree-strongly agree) (e.g. ‘The virtual environment made me dizzy’).
Burglary expertise
To estimate expertise, burglars were asked to estimate the number of burglaries they had committed in their life-time (M = 62.5, SD = 281.6; see Nee et al., Citation2019). Burglars also indicated the number of burglaries they had committed during the last five years prior to incarceration (M = 16.2, SD = 79.8).
Self-reported delinquency
Participants in the non-burglar sample also filled out a 22-item self-report delinquency scale to identify possible offenders (Svensson et al., Citation2013) (e.g. ‘How often in the last 2 years have you damaged something that did not belong to you?’ (never, 1–2 times, 3–5 times, 6–10 times, more than 10 times), α = .84). The threshold was set on 4 or more items to have exhibited delinquent behaviour, which was not the case.
Procedure
Data collection for the burglar sample took place in four prisons in the Netherlands. Recruitment took place using flyers, by directly approaching inmates during leisure time, and via word of mouth. Informational flyers were worded in general terms asking for people with burglary experience. Burglars were asked if they were aware of the nature of the study prior to participating and were requested not to disclose any information to fellow inmates after participation. Data collection for the non-burglar sample took place at two universities in the Netherlands.
Before participating, an informed consent form was read to participants. After a brief instruction regarding the use of the game controller and the HMD, participants entered the virtual neighbourhood for Trial 1. Participants were instructed to walk around the neighbourhood as if they were scouting it for a potential burglary. Non-offenders were asked to imagine being a burglar and given the same instructions.
Upon completion of Trial 1, participants responded to the perceived deterrence questionnaire. Participants then proceeded with Trial 2, and were asked to select the house they considered most attractive to burgle. Upon completion, participants responded to the remaining questionnaires before receiving a full debriefing. Prisoners were offered support if the exercise had raised issues they wished to discuss. In total, the study took approximately 45 min.
Results
Manipulation checks and covariates
Poison regression analyses revealed that the number of times participants had seen the signs show significant effects for both neighbourhood watch signs (χ2 (3, N = 348) = 101.73, p < .001) and police signs (χ2 (3, N = 348) = 68.78, p < .007). Participants noticed the neighbourhood watch sign more often in the neighbourhood watch sign (M = 1.4, SD = .1) and both signs conditions (M = 1.1, SD = .1), compared to the control condition (M = 0.6, SD = .3) or the police sign condition (M = .08, SD = .2). Participants also noticed the police sign more often in the police sign (M = .9, SD = .1) and both signs conditions (M = .8, SD = .1) compared to the control condition (M = .4, SD = .02) or the neighbourhood watch sign condition (M = .04, SD = .08). These findings suggest that our manipulations were successful.
GLM analyses revealed no significant differences for presence, cyber-sickness, or game experience for the experimental conditions of symbolic guardianship. Gaming experience did differ between samples, F(1, 341) = 7.46, p = .007, η2 = .02, with burglars reported more experience than non-offenders. Presence, cyber-sickness, and gaming experience were therefore added as covariates for all subsequent analyses.
Plan of analysis
Analyses were performed on the survey data, the spatial data, and target selection (see for means and SDs for burglars, and for means and SDs for non-offenders). We performed a series of General Linear Models with symbolic guardianship signs and sample (burglars versus non-offenders) as independent variables, and as dependent variables deterrence (i.e. the eight deterrence items or the two aggregated deterrence scales) and the spatial data (i.e. travelled distance and time spent in the virtual neighbourhood in Trial 1). For target selection, we conducted multinomial regression analyses with the same independent variables and features of the selected target (e.g. corner house yes or no) as dependent variables. Finally, we conducted a General Linear Model with distance in meters of the selected house to the nearest signs, distance to the nearest exit, and size of the house as dependent variables. Holm–Bonferroni corrections were applied to control for multiple comparisons. All reported p-values are the adjusted p-values (see for an overview of p-values and effect sizes for all analyses). In addition, we ran all analyses also controlling for those who had correctly reported to either have seen the sign.. Unless indicated otherwise, controlling for this manipulation check did not impact the results (see for an overview of which effect became non-significant).
Table 1. Means and standard deviations of responses to the deterrence questionnaire and spatial data for burglars.
Table 2. Means and standards deviations of responses to the deterrence questionnaire and spatial data for non-offenders.
Table 3. Overview of significant tests and effect sizes for all analyses.
Main analyses
Perceived deterrence
Eight core features of perceived deterrence
For the full sample, an effect of the presence of the neighbourhood signs, (F(1, 330) = 8.70, p = .027, η2 = .026), revealed that perceived likelihood of resident intervention was greater when the neighbourhood watch sign was present (M = 2.8, SD = .07) rather than absent (M = 2.5, SD = .07). Burglars and non-offenders did differ in their appraisal of the neighbourhood, in which burglars perceived the anticipated punishment for getting caught while committing a burglary as higher (M = 3.8, SD = .8) than non-offenders (M = 2.3, SD = .8) in the neighbourhood (F(1, 330) = 211.55, p < .001, η2 = .39). No other significant differences emerged, signalling few differences in the perceived deterrence items for burglars versus non-offenders.
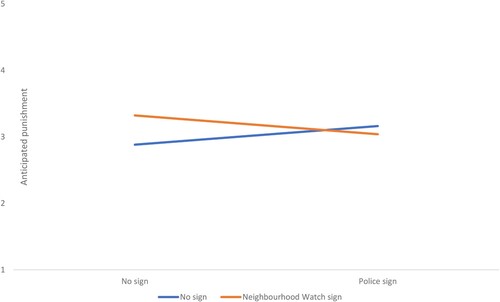
Considering both signs, we found an impact on anticipated punishment (F(1, 330) = 9.91, p = .018, η2 = .029) (see ). Contrast analyses show that contrasted when no signs are present (M = 2.9, SD = .09), anticipated punishment increases with the presence of a neighbourhood watch sign (M = 3.3, SD = .09) (F(1, 333) = 11.85, p = .001). When only a police sign is present (M = 3.2, SD = .09), the addition of a neighbourhood watch sign does not impact anticipated punishment (M = 3.0, SD = .09), (F(1, 333) = .86, p = .356). No other main differences emerged for the full sample for either the presence of the neighbourhood watch sign, or the police sign. For the full sample, the presence of the signs hardly elicited differences in perceived deterrence. In addition, we find no interaction effects between the different signs. Altogether, these results indicate only minor differences of the presence of symbolic guardianship with small effect sizes, in which no clear differences between burglars and non-offenders emerged.
Figure 4. Interaction police sign and neighbourhood watch sign for the full sample on anticipated punishment.
Note. This figure shows the interaction effect of the presence of both neighbourhood watch signs and police signs on burglars and non-offenders.
Perceived deterrence aggregated scales
When examining the two scales of perceived deterrence, only one effect emerged. Burglars and non-offenders differed in their appraisal of the likelihood of neighbourhood residents intervening, in which burglars perceived this intervention to be more likely (M = 3.5, SD = .09) than non-offenders (M = 3.0, SD = .09), (F(1, 330) = 16.38, p < .001, η2 = .05). No other main or interaction effects emerged, once again signalling the lack of effect of symbolic guardianship signs on perceived deterrence in burglars and non-offenders..
Spatial data
Analyses of the spatial data revealed no impact of neighbourhood watch signs on the distance travelled or time spent in the neighbourhood for the full sample. Differences did emerge for police signs regarding time spent in the neighbourhood (F(1, 330) = 7.92, p = .010, η2 = .02) as well as for distance travelled (F(1, 330) = 5.03, p = .026, η2 = .01). When a police sign was present, time spent scouting the neighbourhood (M = 359.0, SD = 173.2) and travelled distance (M = 537.6, SD = 227.6) were lower compared to the absence of a police sign (M = 398.3 SD = 184.2; M = 603.4 SD = 243.3). These effects were small, however, and became non-significant when analysing only those correctly reporting the manipulation. Burglars also scouted the neighbourhood using less distance (M = 532.6, SD = 228.2) than non-offenders (M = 607.6, SD = 241.2), (F(1, 330) = 10.27, p = .002, η2 = .03). No other effects emerged.
Target selection
No significant main effects emerged for symbolic guardianship on target selection characteristics (p > .15). Burglars and non-offenders did differ in entering via the back or front door, however (χ2 (1, N = 338) = 4.96, p = .026), and in selecting a house with doors that mostly consist of glass, consist of a few panels of glass, or contain no glass (χ2 (2, N = 338) = 24.99, p < .001). Burglars were more likely to enter targets via the back of the house than non-offenders (B = .60, SE = .27, p = .026). They were also more likely to select a target with a small glass panel (B = 22.25, SE = 0.73, p < .001) or medium glass panels (B = 19.54, SE = 0.81, p < .001) compared to no glass panel.
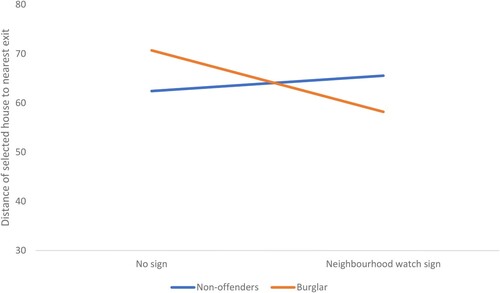
An interaction effect emerged for the distance of the selected target to the nearest exit for the presence of neighbourhood watch signs for burglars versus non-offenders, (F(1, 327) = 4.73, p = .024, η2 = .02) (see ). Simple effect analyses reveal that for burglars the signs impacted the distance of the selected target house to the nearest exit (F(3, 327) = 9.08, p = .003, η2 = .03), but not for non-offenders (F(1, 327) = .58, p = .448, η2 = .002). Burglars are more likely to select a target closer to the exit only when a neighbourhood watch sign is present. This small effect however turned nonsignificant when controlling for those correctly reporting the manipulation. No further main or interaction effects emerged, indicating that again only small effects can be found for the presence of symbolic guardianship signs on burglars.
Figure 5. Interaction neighbourhood watch sign and burglars versus non-offenders on the distance of selected house to the nearest exit.
Note. This figure shows the interaction effect of the presence of both neighbourhood watch signs on burglars and non-offenders on the distance of the selected house to the nearest exit.
Discussion
This study experimentally assessed the deterrent effect of neighbourhood watch signs and police signs among burglars and non-offenders. With neighbourhood watch signs present, both burglars and non-offenders perceived the neighbourhood as more likely to intervene. Burglars were also more likely to select a target closer to the exit than non-offenders when neighbourhood watch signs were present. Police signs impacted the time spent and distance travelled scouting for both burglars and non- offenders. Meaningful differences also emerged between burglars and non-offenders. Burglars selected houses with easier access and travelled less distance scouting the neighbourhood. Burglars also reported higher anticipation of neighbourhood intervention and lower anticipated punishment compared to non-offenders. Altogether the deterrent effect of symbolic guardianship through the signs investigated here appears small for burglars.
The deterring effect of symbolic guardianship signs
Neighbourhood watch signs aim to deter burglars by implying that a guardian might be watching while no guardian is visibly present. In the current study, we cannot establish if this feeling was elicited. The presence of neighbourhood watch signs did increase the selection of houses closer to the exit for burglars and for both burglars and non-offenders increased the perceived likelihood of the residents intervening. At the same time, no differences emerged in for example perceived chances of getting caught. There is also no indication that burglars would refrain from committing a burglary in a neighbourhood in which these signs are present. Perhaps this is due to the increasing number of these signs placed in neighbourhoods (Pridmore et al., Citation2019) and the lack of regulation regarding their placement (Schultz & Tabanico, Citation2009). The signs have become well-known; burglars might not feel like they are being watched if they encounter these signs in every neighbourhood they enter.
Burglars tend prefer houses that offer easy escape (Langton & Steenbeek, Citation2017). In this study, we found that neighbourhood watch signs increased selection of houses closer to the exit points of the neighbourhood. Conceivably, the neighbourhood watch signs might not elicit the feeling of being watched but instead the feeling that if a neighbourhood resident would be encountered, they would be more likely to intervene. This implies that while burglars claim not to be deterred by neighbourhood watch signs, they might unconsciously become more cautious. This however contrasts with the intended purpose of the neighbourhood watch sign: Deterring burglars from committing a burglary instead of being more cautious.
In contrast, police signs decreased the distance travelled in the neighbourhood. In contrast to neighbourhood watch signs, burglars were unfamiliar with the police signs and thus lacked prior knowledge on the probability of police surveillance. This might have caused them to err on the safe side by shortening their stay in the neighbourhood.
Although symbolic guardianship did affect anticipated punishment among burglars, the rationale for why this could be the case is unclear. Since sentencing for committing a burglary in the Netherlands is fixed, this finding is likely to be a fluke. In fact, burglars were surprised by this question, and often claimed this to be irrelevant for sentencing of burglary. We therefore refrain from interpreting this finding. One prominent feature not present on the police signs were eyes; the sign simply displayed a message that burglars being watched. This feature was present on neighbourhood watch signs. What the effect is of displaying a message of burglars being watched with the presence of a pair of eyes – as has been found to be effective for bicycle theft with a reduction of 62% (Nettle et al., Citation2012), thus remains unclear.
The effects of symbolic guardianship via neighbourhood watch and police signs are thus small. In contrast, physical guardianship had a consistent deterrent effect on burglars (van Sintemaartensdijk et al., Citation2021). The immediate threat that is exerted by a physical guardian is a powerful deterrent. The current study therefore contained only few guardians sent in the virtual environment, in order to not confound symbolic and physical guardianship. This could however also have impacted the effect of symbolic guardianship, as more attention was devoted to the signs in the absence of physical guardians. Further investigations on the interplay between symbolic and physical guardianship are thus necessary.
Although the effects of both types of signs are small, we should not immediately discount signs as deterrent measures as they are a low-cost and highly scalable intervention. Small-effect interventions can be a valuable addition to well-established interventions (Benartzi et al., Citation2017). Thus, although symbolic guardianship signs have only a small deterrent effect on burglars, we should consider if combining these signs with other preventive measures is worthwhile.
Strengths and limitations
An important strength of the study is the use of VR to study the behaviour of burglars. Besides being able to assess decision-making while committing a burglary (Meenaghan et al., Citation2018), VR also allows assessing decision-making process before committing a burglary (van Sintemaartensdijk et al., Citation2021). This opens opportunities to examine other factors potentially impacting of the scouting process, such as locks, doors, and windows. Furthermore, the present study relied not only on (subjective) questionnaire data but also on behavioural spatial data. Most importantly, we managed to recruit a relatively large sample of incarcerated burglars. While early pioneering studies interviewed burglars on the deterrent effects of guardianship (e.g. Wright et al., Citation1995), more recent research has predominantly focused on relating crime prevalence to guardianship measures. This means that the offender perspective is often not included in studies (Moir et al., Citation2017; Reynald, Citation2009).
Some limitations of the study also must be noted, however. The virtual world is designed to be a close approximation of the real world, but it is far from an exact replication. As the signs in this study were perceived in a virtual world and not in real life, we cannot exclude the possibility that the effects of the signs are different in the real world. Akkermans and Vollaard (Citation2015) revealed that neighbourhood watch signs were associated with a reduction in burglary rates of 40%. However, the correlational nature of that study, in addition to increased familiarity with the signs among burglars, raises questions whether these strong effects will hold up in follow-up studies. Interviews with the burglar sample suggested that most do not judge the signs as a deterrent factor. Moreover, Nee et al. (Citation2015) found a strong connection between burglary behaviour in VR and the real world. Furthermore, non-offenders respond physiologically (e.g. increased heart rate) when committing a virtual burglary (van Gelder et al., Citation2017).
Finally, the burglar sample might not be representative of burglars in general, as it is possible that the most successful burglars are not incarcerated (Cromwell et al., Citation1991). Participants in the burglar sample were however not necessarily convicted for burglary (Nee, Citation2015). In addition, findings suggest that behaviour and decision-making amongst incarcerated offenders and non-incarcerated are similar (Copes & Hochstetler, Citation2010).
Conclusions
The deterrent effect of physical guardianship on burglary is well-established (Hollis-Peel et al., Citation2012; Moir et al., Citation2017; Reynald, Citation2009), but achieving permanent and ubiquitous guardian presence is impossible. Symbolic guardianship assumes that guardianship does not have to be rooted in objective properties of the situation, but can be based on the suggestion of being watched (Hollis et al., Citation2013). The present research finds that symbolic guardianship via neighbourhood watch and police signs has only a small effect on burglars. Nevertheless, it would be premature to discard symbolic guardianship when combined with established deterrent measures, or in light of its potential effects on increasing physical guardianship by neighbourhood residents.
Disclosure statement
No potential conflict of interest was reported by the author(s).
References
- Akkermans, M., & Vollaard, B. (2015). Effect van het WhatsApp-project in Tilburg op het aantal woninginbraken – een evaluatie. https://hetccv.nl/fileadmin/Bestanden/Onderwerpen/Woninginbraak/Documenten/Effect_van_het_WhatsApp-project_in_Tilburg_op_het_aantal_woninginbraken/tilburg-whatsapp_191015.pdf
- Bateson, M., Nettle, D., & Roberts, G. (2006). Cues of being watched enhance cooperation in a real-world setting. Biology Letters, 2(3), 412–414. https://doi.org/10.1098/rsbl.2006.0509
- Benartzi, S., Beshears, J., Milkman, K. L., Sunstein, C. R., Thaler, R. H., Shankar, M., Tucker-Ray, W., Congdon, W. J., & Galing, S. (2017). Should governments invest more in nudging? Psychological Science, 28(8), 1041–1055. https://doi.org/10.1177/0956797617702501
- Bennett, T., Holloway, K., & Farrington, D. (2008). The effectiveness of neighborhood watch. Campbell Systematic Reviews, 4(1), 1–46. https://doi.org/10.4073/csr.2008.18
- Bennett, T., & Wright, R. (1984). Burglars on burglar prevention and the offender. Gower.
- Bourrat, P., Baumard, N., & McKay, R. (2011). Surveillance cues enhance moral condemnation. Evolutionary Psychology, 9(2), 193–199. https://doi.org/10.1177/147470491100900206
- Cai, W., Huang, X., Wu, S., & Kou, Y. (2015). Dishonest behavior is not affected by an image of watching eyes. Evolution and Human Behavior, 36(2), 110–116. https://doi.org/10.1016/j.evolhumbehav.2014.09.007
- Clare, J. (2011). Examination of systematic variations in burglars’ domain-specific perceptual and procedural skills. Psychology, Crime & Law, 17(3), 199–214. https://doi.org/10.1080/10683160903025810
- Cohen, L. E., & Cantor, D. (1981). Residential burglary in the United States: Life-style and demographic factors associated with the probability of victimization. Journal of Research in Crime and Delinquency, 18(1), 113–127. https://doi.org/10.1177/002242788101800107
- Cohen, L. E., & Felson, M. (1979). Social change and crime rate trends: A routine activity approach. American Sociological Review, 44(4), 588–608. https://doi.org/10.2307/2094589
- Copes, H., & Hochstetler, A. (2010). Interviewing the incarcerated: Pitfalls and promises. In W. Bernasco (Ed.), Offenders on offending: Learning about crime from criminals (pp. 71–89). Willan Publishers.
- Coupe, T., & Blake, L. (2006). Daylight and darkness targeting strategies and the risks of being seen at residential burglaries. Criminology; An interdisciplinary Journal, 44(2), 431–464. https://doi.org/10.1111/j.1745-9125.2006.00054.x
- Cromwell, P. F., Olson, J. N., & Wester Avary, D. (1991). Breaking and entering: An ethnographic analysis of burglary. Sage.
- Dear, Keith, Dutton, Kevin, & Fox, Elaine. (2019). Do ‘watching eyes’ influence antisocial behavior? A systematic review & meta-analysis. Evolution and Human Behavior, 40(3), 269–280. http://dx.doi.org/10.1016/j.evolhumbehav.2019.01.006
- Elffers, H., & Ruiter, S. (2016). Wie niet weg is, kan wat zien. In A. Dirkzwager, J.-L. van Gelder, & S. Ruiter (Eds.), Beroemd en berucht: criminaliteit in Amsterdam (pp. 105–115). SWP Amsterdam.
- Felson, M., & Cohen, L. E. (1980). Human ecology and crime: A routine activity approach. Human Ecology, 8(4), 389–406. https://doi.org/10.2307/2094589
- Hartmann, T., Wirth, W., Schramm, H., Klimmt, C., Vorderer, P., Gysbers, A., Böcking, S., Ravaja, N., Laarni, J., Saari, T., Gouveia, F., & Sacau, A. M. (2016). The spatial presence experience scale (SPES): A short self-report measure for diverse media settings. Journal of Media Psychology, 28(1), 1–15. https://doi.org/10.1027/1864-1105/a000137
- Hollis, M. E., Felson, M., & Welsh, B. C. (2013). The capable guardian in routine activities theory: A theoretical and conceptual reappraisal. Crime Prevention and Community Safety, 15(1), 65–79. https://doi.org/10.1057/cpcs.2012.14
- Hollis-Peel, M. E., Reynald, D. M., van Bavel, M., Elffers, H., & Welsh, B. C. (2011). Guardianship for crime prevention: A critical review of the literature. Crime, Law and Social Change, 56(1), 53–70. https://doi.org/10.1007/s10611-011-9309-2
- Hollis-Peel, M. E., Reynald, D. M., & Welsh, B. C. (2012). Guardianship and crime: An international comparative study of guardianship in action. Crime, Law and Social Change, 58(1), 1–14. https://doi.org/10.1007/s10611-012-9366-1
- Homel, R., Macintryre, S., & Wortley, R. (2013). How house burglars decide on targets: A computer-based scenario approach. Routledge.
- Jones, R. W., & Pridemore, A. (2019). Toward an integrated multilevel theory of crime at place : routine activities, social disorganization, and the law of crime concentration. Journal of Quantitative Criminology, 35(3), 543–572. https://doi.org/10.1007/s10940-018-9397-6
- Kennedy, R. S., Lane, N. E., Berbaum, K. S., & Lilienthal, M. G. (1993). Simulator sickness questionnaire: An enhanced method for quantifying simulator sickness. The International Journal of Aviation Psychology, 3(3), 203–220. https://doi.org/10.1207/s15327108ijap0303_3
- Langton, S. H., & Steenbeek, W. (2017). Residential burglary target selection: An analysis at the property-level using Google Street View. Applied Geography, 86, 292–299. https://doi.org/10.1016/j.apgeog.2017.06.014
- Lub, V. (2018). Neighbourhood watch: Mechanisms and moral implications. The British Journal of Criminology, 58(4), 906–924. https://doi.org/10.1093/bjc/azx058
- Mania, K., & Chalmers, A. (2001). The effects of levels of immersion on memory and presence in virtual environments: A reality centered approach. CyberPsychology & Behavior, 4(2), 247–264. https://doi.org/10.1089/109493101300117938
- Meenaghan, A., Nee, C., van Gelder, J.-L., Otte, M., & Vernham, Z. (2018). Getting closer to the action: Using the virtual enactment method to understand burglary. Deviant Behavior, 39(4), 437–460. https://doi.org/10.1080/01639625.2017.1407104
- Miethe, T. D., Stafford, M. C., & Long, J. S. (1987). Social differentiation in criminal victimization: A test of routine activities/lifestyle theories. American Sociological Review, 52(2), 184–194. https://doi.org/10.2307/2095447
- Moir, E., Stewart, A., Reynald, D. M., & Hart, T. C. (2017). Guardianship in action (GIA) within Brisbane suburbs. Criminal Justice Review, 42(3), 254–269. https://doi.org/10.1177/0734016817724199
- Nee, C. (2015). Understanding expertise in burglars: From pre-conscious scanning to action and beyond. Aggression and Violent Behavior, 20, 53–61. https://doi.org/10.1360/zd-2013-43-6-1064
- Nee, C., & Meenaghan, A. (2006). Expert decision making in burglars. The British Journal of Criminology, 46(5), 935–949. https://doi.org/10.1093/bjc/azl013
- Nee, C., & Taylor, M. (2000). Examining burglars’ target selection: Interview, experiment or enthnomethodoloy? Psychology, Crime and Law, 6(1), 45–59. https://doi.org/10.1017/CBO9781107415324.004
- Nee, C., van Gelder, J.-L., Otte, M., Vernham, Z., & Meenaghan, A. (2019). Learning on the job: Studying expertise in residential burlgars using virtual environments. Criminology; An interdisciplinary Journal, 57(3), 481–511. https://doi.org/10.1111/1745-9125.12210
- Nee, C., & Ward, T. (2015). Review of expertise and its general implications for correctional psychology and criminology. Aggression and Violent Behavior, 20, 1–9. https://doi.org/10.1016/j.avb.2014.12.002
- Nee, C., White, M., Woolford, K., Pascu, T., Barker, L., & Wainwright, L. (2015). New methods for examining expertise in burglars in natural and simulated environments: Preliminary findings. Psychology, Crime & Law, 21(5), 507–513. https://doi.org/10.1080/1068316x.2014.989849
- Nettle, D., Nott, K., & Bateson, M. (2012). ‘Cycle thieves, we are watching you’: Impact of a simple signage intervention against bicycle theft. PLoS ONE, 7(12), 8–12. https://doi.org/10.1371/journal.pone.0051738
- Pfattheicher, S., & Keller, J. (2015). The watching eyes phenomenon: The role of a sense of being seen and public self-awareness. European Journal of Social Psychology, 45(5), 560–566. https://doi.org/10.1002/ejsp.2122
- Pridmore, J., Mols, A., Wang, Y., & Holleman, F. (2019). Keeping an eye on the neighbours: Police, citizens, and communication within mobile neighbourhood crime prevention groups. The Police Journal: Theory, Practice and Principles, 92(2), 97–120. https://doi.org/10.1177/0032258x18768397.
- Reynald, D. M. (2009). Guardianship in action: Developing a new tool for measurement. Crime Prevention and Community Safety, 11(1), 1–20. https://doi.org/10.1057/cpcs.2008.19
- Reynald, D. M. (2014). Informal guardianship. In G. Bruinsma & D. Weisburd (Eds.), Encyclopedia of criminology and criminal justice (pp. 2480–2489). https://doi.org/10.1007/978-1-4614-5690-2
- Reynald, D. M. (2017). Informal guardians and offender decision making. In W. Bernasco, J. van Gelder, & H. Elffers (Eds.), Oxford handbook on offender decision making (pp. 361–373). Oxford University Press.
- Schultz, P. W., & Tabanico, J. J. (2009). A social norms approach to community-based crime prevention: Implict and explicit messages on neighborhood watch signs. National Institute of Justice, Office of Justice Programs, US Department of Justice.
- Snippe, J., Sijtstra, M., Mennes, R., & Bieleman, B. (2014). Buit van woninginbraak. Politie en Wetenschap.
- Svensson, R., Weerman, F. M., Pauwels, L. J., Bruinsma, G., & Bernasco, W. (2013). Moral emotions and offending: Do feelings of anticipated shame and guilt mediate the effect of socialization on offending? European Journal of Criminology, 10(1), 22–39. https://doi.org/10.1177/1477370812454393
- van Gelder, J. L., Nee, C., Otte, M., Demetriou, A., van Sintemaartensdijk, I., & van Prooijen, J. W.. (2017). Virtual burglary: Exploring the potential of virtual reality to study burglary in action. Journal of Research in Crime and Delinquency, 54(1), 29–62. http://dx.doi.org/10.1177/0022427816663997
- van Gelder, J.-L., Otte, M., & Luciano, E. C. (2014). Using virtual reality in criminological research. Crime Science, 3(1), 10. https://doi.org/10.1186/s40163-014-0010-5
- van Sintemaartensdijk, I., van Gelder, J., van Prooijen, J.-W., Nee, C., Otte, M., & van Lange, P. A. M. (2021). Mere presence of informal guardians deters burglars: A virtual reality study. Journal of Experimental Criminology, 17(4), 657–676. https://doi.org/10.1007/s11292-020-09430-1
- Wright, R., Logie, R. H., & Decker, S. H. (1995). Criminal expertise and offender decision making: An experimental study of the target selection process in residential burglary. Journal of Research in Crime and Delinquency, 32(1), 39–53. https://doi.org/10.1080/08858190209528804
- Yildirim, Ç., Bostan, B., & Berkman, M. İ. (2019). Impact of different immersive techniques on the perceived sense of presence measured via subjective scales. Entertainment Computing, 31, 100308. https://doi.org/10.1016/j.entcom.2019.100308