


ABSTRACT
Distance, lighting, and facial masking negatively impact eyewitness identification accuracy. We investigated their combined effect on accuracy and how internal (e.g., eyes) versus external (e.g., hair) masking impacts accuracy. Using live targets witnessed by 1325 participants, we investigated the effects of distance (5m, 12.5m, 20m), lighting (optimal:300lx, suboptimal:2lx), facial masking (no facial masking, sunglasses, hood, sunglasses & hood), and eyewitness age (5-90) on identification accuracy in target-present (TP) or target-absent (TA) eight-person simultaneous photograph line-ups. TP identification accuracy, with no facial masking, for all participants was .69 (.96 for only 18-44-year-old choosers) at 5m, .34 (.58) at 12.5m, and .17 (.42) at 20m. TA rejection accuracy for all participants was .63 (.60 for only 18-44-year-olds) at 5m, .42 (.54) at 12.5m, and .46 (.46) at 20m. Facial masking further decreased accuracy; internal facial masking had the strongest negative effect. The combined negative effects of distance, lighting, and facial masking resulted in chance-level performance in TP line-ups (i.e., .125) in some instances. We also found a positive association between accuracy and high confidence and shorter response times. We recommend that law enforcement agencies and researchers report these variables to allow for the postdiction of the likely accuracy of an eyewitness decision.
Introduction
Remembering and recognizing faces
The ability to visually recognize a face is a specialized skill that is superior to the recognition of other objects (Shakeshaft & Plomin, Citation2015; Werner et al., Citation2013). This is likely due to the evolutionary importance of reacting to and recognizing faces (Burke & Sulikowski, Citation2013). In legal contexts, facial identification plays an important role because eyewitnesses are frequent sources of evidence in criminal proceedings, for example when placing a suspect at the time and place of a crime (e.g. Wells et al., Citation2006). Eyewitness identifications also influence juries and judges (Brewer & Wells, Citation2011; Cutler et al., Citation1990; Nash et al., Citation2015) despite eyewitness identifications being prone to errors (Albright, Citation2017; Wells et al., Citation2015). Largely, eyewitness identification research has focused on two main areas: (1) the law-enforcement practices (i.e. system variables) used to examine eyewitness memories and (2) situational factors (i.e. estimator variables) that relate to the circumstances under which a memory was encoded (Wells, Citation1978). The former line of research has led to important suggestions for reform (Wells et al., Citation2020), whereas the latter has received less attention and therefore many questions remain unanswered (e.g. Fulero, Citation2009). The present study focused on the effect of the following estimator variables on eyewitness identification accuracy of unfamiliar faces: facial masking, viewing distance, lighting, and eyewitness age. In the present study eyewitnesses were presented with live target individuals to be observed and that the distance, lighting, and masking were manipulated live. This is in contrast to the majority of studies that have used photographic or video stimuli and simulated manipulations (e.g. Kovera & Evelo, Citation2021).
Facial masking
The perception, memory, and recognition of faces relies on a holistic processing of the dynamic elements of the face, which means that various elements of the face are stored and retrieved as a whole (Burke & Sulikowski, Citation2013; Rossion, Citation2013). Familiarity is also important, as recognition of familiar faces is less prone to identification errors compared with unfamiliar faces (Megreya & Burton, Citation2006; Young & Burton, Citation2018). Broadly speaking, the face consists of internal features (e.g. nose, eyes, mouth), which change only a little over time, and external features (e.g. ears, hair, outer contours of the face) some of which can be easily altered (Ellis et al., Citation1979; Young, Citation1984). Concealing (e.g. by using a disguise) either internal facial features or external facial features can negatively influence facial identification accuracy in various ways (e.g. Andrews et al., Citation2010; Shapiro & Penrod, Citation1986). For example, in a study aimed at training eyewitnesses to focus on internal facial features in order to improve their accuracy, Paterson et al. (Citation2017) found that when external features had been altered between encoding and identification (i.e. retrieval), focus on internal features improved accuracy but not when external features were kept constant between encoding and identification. Moreover, Carlson et al. (Citation2021) found that in relation to external facial masking, matching encoding and retrieval conditions leads overall to better line-up performance – meaning that if external features were masked during encoding then line-up performance is improved if external features are masked also during retrieval.
However, it is especially internal facial masking that is detrimental to encoding and identification accuracy (Carragher & Hancock, Citation2020; Manley et al., Citation2018; Mansour et al., Citation2020; Nguyen & Pezdek, Citation2017; Ross et al., Citation2022; Thorley et al., Citation2022). The main reason appears to be that identification accuracy is often assessed using a line-up task where images of a target and fillers (i.e. target lookalikes) are only distinguishable based on distinctive internal facial features; that is, that external feature (e.g. the hair) of the fillers are selected so as to match the target as much as possible (e.g. Malpass et al., Citation2008). A difficulty in creating line-ups is, nevertheless, that eyewitness descriptions are not always accurate or detailed and the police do not always follow guidelines set by researchers concerning best practices for creating line-ups (Malpass et al., Citation2008; Nyman et al., Citation2021). In this context, accuracy is defined as the ability to differentiate between the image of the target and the images of the fillers based on the eyewitness’s memory of the specific features of the observed target. Eye tracking studies lend support to the interpretation that attention to internal facial features is important for identification accuracy, as findings show that focus on or directed attention towards internal facial features tends to improve accuracy (Fletcher et al., Citation2008; Paterson et al., Citation2017).
Importantly, a limitation of earlier studies on the effects of facial masking is that they have relied on simulated effects of masking on identification accuracy (i.e. they have used images) and there appear to have been no empirical studies that would have investigated the effects of masking using live targets (e.g. Kramer & Ritchie, Citation2016; Manley et al., Citation2018; Mansour et al., Citation2020). Moreover, the studies have not investigated other aspects that impact the visibility of the face, such as lighting and distance; two variables which are relevant in any visual encoding context.
Visibility
The perception and encoding of a face can be impeded in several ways and, as previously mentioned, the explicit masking of internal or external facial masking has indeed been found to have a negative impact on identification accuracy (e.g. Manley et al., Citation2018; Mansour et al., Citation2020). However, the visibility of a face can also be impeded in other ways, such as, by increasing the distance between the observer and the observed or by increasing or decreasing the lighting conditions in which the observation takes place. A clear difference between explicit facial masking and either increased distance or decreased lighting is that facial masking can specifically target either internal or external facial features and thus obstruct encoding and identification accuracy in specific ways (e.g. Manley et al., Citation2018; Mansour et al., Citation2020). In contrast, the effects of increased distance or decreased lighting appear to result in a more global negative effect on facial encoding, thus potentially obstructing both internal and external facial features (e.g. Loftus & Harley, Citation2005; McKone, Citation2009; Wagenaar & Van Der Schrier, Citation1996). Studies have found that when a perpetrator is seen at a greater viewing distance this has a negative effect on later identification accuracy (de Jong et al., Citation2005; Lampinen et al., Citation2014; Lindsay et al., Citation2008; Lockamyeir et al., Citation2020; Loftus & Harley, Citation2005; McKone, Citation2009; Nyman, Antfolk, et al., Citation2019; Nyman, Lampinen, et al., Citation2019; Wagenaar & Van Der Schrier, Citation1996). Similar to increased distance, decreased lighting has also been found to have a negative impact on identification accuracy (de Jong et al., Citation2005; Nyman, Antfolk, et al., Citation2019; Wagenaar & Van Der Schrier, Citation1996).
The majority of the above-mentioned research on the effects of distance and lighting on identification accuracy is based on simulated scenarios, but there are a few studies that have investigated the effect of actual distance or lighting using live targets (Lampinen et al., Citation2014; Lindsay et al., Citation2008; Nyman, Antfolk, et al., Citation2019; Nyman, Lampinen, et al., Citation2019). However, these studies have not included an investigation of disguise. Moreover, Nyman, Antfolk et al. (Citation2019) is the only study to date that has investigated the combined effect of actual distance and lighting using live targets and they found that in target present line-ups accuracy reached chance level (i.e. .125) at 20 meters in low lighting. However, the study did not include target absent line-ups, which diminishes the usefulness of the results. In comparison, and based on simulated distance and lighting, Wagenaar and Van Der Schrier (Citation1996), introduced a rule of thumb in which they stated that to reach optimal encoding and identification accuracy, lighting should be above 15 lux and distance below 15 m to achieve a diagnostic value of 15; which they considered to be acceptable. In a more recent simulated distance design, it was found that accuracy declined substantially with distance as the target present identification accuracy fell in Experiment 1 from .50 at 3 m to .15 at 20 m and in Experiment 2 from .54 at 3 m and .19 at 20 m (Lockamyeir et al., Citation2020).
Importantly, despite the ostensibly clear connection between facial masking, viewing distance, and lighting, there has been no investigation of the effects of these variables on identification accuracy. For this reason, there has also not been an empirical investigation into the different effects that internal and external facial masking have in optimal versus suboptimal viewing conditions. More specifically, because visibility decreases with increased distance and decreased lighting, internal facial features will presumably be impacted first and external facial features last. That is, when the viewing distance to a target is increased or the lighting is decreased, lower visibility will first reduce the ability to distinguish between the smaller and spatially close internal features of the face (e.g. nose, eyes, mouth), whereas the external and larger features (e.g. ears, hair, outer contours of the face) will be less affected. This implies that different predictions can be made regarding the combined effects of internal and external facial masking and either increased distance or decreased lighting on identification accuracy. It may be that internal facial masking (e.g. sunglasses) will have a more detrimental effect under optimal viewing conditions (i.e. smaller viewing distance or optimal lighting) compared to under sub-optimal conditions (i.e. greater viewing distance or suboptimal lighting). In contrast, the opposite prediction can be made for the masking of external facial features.
Eyewitness age
No earlier studies have investigated age-differences in the effects of facial masking. The closest comparison is a study by Pozzulo and Balfour (Citation2006), where the authors found that changes in appearance (i.e. hair length) of a target between observation and line-up task negatively impacted accuracy for both children (8–13) and adults (17–59). Only one earlier study has investigated the impact of age-related differences in identification accuracy with increased viewing distance (Nyman, Lampinen, et al., Citation2019), where accuracy was found to be lower for young children (5–11) but the impact of increased distance was similar compared with young adults (18–44). Additionally, no earlier studies have investigated age-related differences with different lighting conditions.
Overall, young adults tend to outperform young children and older adults on identification tasks (Erickson et al., Citation2015; Fitzgerald & Price, Citation2015; Pozzulo & Lindsay, Citation1998). Children and older adults also tend to make more filler selections (i.e. choose more) in line-ups where the target is absent (Bartlett, Citation2014; Bartlett & Memon, Citation2007; Fitzgerald & Price, Citation2015). The predilection to choose among children and older adults may be related to a reliance on familiarity (vs. recollection) in the identification task (Shing et al., Citation2010). Familiarity is associated with a feeling of something being similar (e.g. a face) and recollection is associated with a more detailed and specific memory (Jacoby, Citation1991). Familiarity develops early in childhood while recollection continues to develop throughout childhood (Anooshian, Citation1999; Brainerd et al., Citation2004). Children may rely on familiarity due to their recollection not being as developed (Shing et al., Citation2008, Citation2010), whereas older adults may rely on familiarity due to recollection impairments (e.g. Fitzgerald & Price, Citation2015; Healy et al., Citation2005).
Facial processing matures between the ages of 5–7, which indicates that lower accuracy is more likely to be associated with memory and attention (Crookes & McKone, Citation2009). Older adults may also suffer from attention deficits or even inhibition deficits, but findings do not support the claim that inhibition control is decreased in older adults (Rey-Mermet & Gade, Citation2018). Interestingly, although both children and adults integrate internal and external facial features into a holistic representation of a face, evidence suggests that for children (6–10-year-olds) external facial features are more important in their representation of faces and lead to a higher degree of accuracy (Knowles & Hay, Citation2014). This potentially means that there are age-related differences in how facial masking affects identification accuracy, but with almost no background information, there is no clear foundation upon which to formulate sound hypotheses. Differences in the development of young individuals and potential age-related deficiencies in later life imply that the effects of age may not be linear.
Metacognition
The subjectively perceived difficulty of a task is of potential importance when investigating the effects of facial masking and visibility (i.e. distance and lighting) on identification accuracy. This is because although an eyewitness may be aware of the difficulty of the task of observing (i.e. encoding) a face under sub-optimal conditions (e.g. a masked face), evidence suggests that line-up choosing behavior is not adequately adjusted in a more conservative direction so that the eyewitnesses would be more cautious (Lindsay et al., Citation2008; Mansour et al., Citation2020; Nyman, Lampinen, et al., Citation2019). Interestingly, it has also been found that both poor encoding conditions (estimator variables) and degraded line-ups (system variables) lead to a similar effect; that the response criterion of the eyewitness becomes more liberal (Smith et al., Citation2019). This means that line-up choosing behavior is not adequately adjusted to become more cautious when encoding is hindered or when the line-up is more difficult. The conclusion of earlier findings is that eyewitnesses are often not sensitive to the objective difficulty of an eyewitness task (i.e. they do not realize that their ability to encode and later identify accurately is diminished). However, it may also be that, having realized the difficulty, eyewitnesses are either unwilling or unable to change their willingness to guess or in a real-life scenario help the investigation by attempting to make an identification. The conclusion is that by decreasing visibility during encoding, we would expect to see an increase in choosing behavior and in error rates.
Line-up confidence and response time
Earlier studies have found that high confidence among the choosers in line-ups is indicative of identification accuracy (Lindsay et al., Citation1998; Sporer et al., Citation1995; Wixted & Wells, Citation2017). There is also a range of evidence indicating that shorter response times in line-up tasks are associated with identification accuracy (Dodson & Dobolyi, Citation2016; Dunning & Perretta, Citation2002; Sauer et al., Citation2008; Sauerland et al., Citation2018; Sauerland & Sporer, Citation2009; Weber et al., Citation2004). Interestingly, it has also been asserted that estimator variables do not negatively impact the confidence-accuracy relationship, so that for example, no matter what the visibility was during the encoding, as long as pristine line-ups and line-up procedures are used, a high confidence identification will have a high probability of being accurate (Semmler et al., Citation2018). However, there is also evidence that estimator variables can have a negative impact on the relationship between accuracy and confidence (e.g. Giacona et al., Citation2021; Grabman et al., Citation2019; Lockamyeir et al., Citation2020). We argue that before claiming that the confidence-accuracy relationship will hold true irrespective of how the multitude of estimator variables are manipulated, an empirical investigation should be conducted. In the present study, we were able to investigate both the association between confidence, accuracy, response time and accuracy under suboptimal viewing conditions.
The present study
In the present study, we investigated the effects of distance (5, 12.5, 20 m), lighting (sub-optimal lighting; 2 lux: lx, Optimal lighting; 300lx), facial masking (no facial masking, sunglasses, hood, sunglasses & hood), and eyewitness age (5–90: young children; 5–11, older children; 12–17, young adults; 18–44, older adults; 45–90), on identification accuracy of unfamiliar faces. The novelty of the present study was that no earlier studies have investigated (1) the combined effects of actual distance and actual lightning on identification accuracy in target present and target absent line-ups, (2) the combined effects of facial masking, distance, and lighting, (3) age related differences in accuracy when a target is wearing facial masking or when they have been presented at various distances and in optimal or suboptimal lighting. Combined, the present study represents the most systematic approach to date of investigating how visibility of the face during encoding impacts identification accuracy. Our hypotheses were:
H1 (distance and lighting): Increased distance and decreased lighting will have a negative impact on overall accuracy. This hypothesis was based on findings of the negative effects of increased distance on identification accuracy (de Jong et al., Citation2005; Lampinen et al., Citation2014; Lindsay et al., Citation2008; Lockamyeir et al., Citation2020; Loftus & Harley, Citation2005; McKone, Citation2009; Nyman, Antfolk, et al., Citation2019; Nyman, Lampinen, et al., Citation2019; Wagenaar & Van Der Schrier, Citation1996) and the negative effects of decreased lighting on identification accuracy (de Jong et al., Citation2005; Nyman, Antfolk, et al., Citation2019; Wagenaar & Van Der Schrier, Citation1996).
H2 (threshold hypothesis): Under suboptimal viewing conditions, the combined effect of both increased distance and decrease lighting will result in an upper identification threshold where identification accuracy will have fallen to chance level in target present line-ups. Here, chance level was defined as 1/8 = 12.5% in target present line-ups because the line-ups we employed were eight-person simultaneous line-ups where chance is equal to selecting any one image at random. Based on earlier, but only provisional findings, this threshold was assumed to be achieved at 20 meters, in suboptimal lighting, and with no facial masking (Nyman, Antfolk, et al., Citation2019). With facial masking, the threshold was expected to be considerably lower for all participants.
H3 (age differences): Overall, in comparison with young adults, young children and older adults will be less accurate. This assumption was based on earlier findings of age differences in identification accuracy (Fitzgerald & Price, Citation2015) and the specific age groups and their expected differences in accuracy were based on an earlier and similar study (Nyman, Lampinen, et al., Citation2019). We also hypothesized that the age-related differences would be pronounced in optimal viewing conditions, but as viewing conditions worsened (i.e. distance increased or lighting decreased), when facial masking was employed, or a combination of all three factors, then the age-related differences would decrease. This was due to the expected low level of accuracy for all participants in sub-optimal encoding conditions.
H4 (internal versus external facial masking): Under optimal viewing conditions (5 m & 300lx), internal facial masking (sunglasses or sunglasses & hood) will have a more negative effect on accuracy compared with no facial masking and potentially also external facial masking (hood). This was a novel hypothesis based on earlier findings of the negative impact of facial masking on identification accuracy (Carragher & Hancock, Citation2020; Manley et al., Citation2018; Mansour et al., Citation2020; Nguyen & Pezdek, Citation2017). Moreover, this hypothesis was also based on the earlier mentioned negative impacts of increased distance and decreased lighting on identification accuracy and the gap in the literature of the combined effects of these variables. Our reasoning was that when internal facial features are visible, masking them will have a considerable negative impact, whereas when internal facial features are no longer discernible, then reliance on external features will increase and so external facial masking will potentially have a more negative impact on identification accuracy. No earlier studies have investigated this question.
H5 (internal versus external facial masking): In line with H4, under suboptimal viewing conditions (20 m & 2lx), both internal and external facial masking (vs. no facial masking) will have a negative effect on accuracy. However, we expected that external facial masking would have a more negative effect on accuracy compared with internal facial masking.
H6 (confidence and accuracy): High confidence among the line-up choosers will be positively associated with accuracy. This expectation was based on earlier findings (e.g. Lindsay et al., Citation1998; Sporer et al., Citation1995; Wixted & Wells, Citation2017).
H7 (response time and accuracy): Shorter line-up response times among the line-up choosers will be positively associated with accuracy. This assumption was based on earlier findings (Dodson & Dobolyi, Citation2016; Dunning & Perretta, Citation2002; Sauer et al., Citation2008; Sauerland et al., Citation2018; Sauerland & Sporer, Citation2009; Weber et al., Citation2004).
Method
Participants
Prior to data cleaning, there were 1425 participants and 4893 responses. We excluded responses due to: (1) participant withdrawal (#23), (2) technical (#46) and participant (#79) errors, (3) repeated participation (#176), (4) prior familiarity with a person represented in the chosen line-up image (#70) or any other (#75) line-up image, (5) participant age was reported as below 5 (#15) or equal to 99 (#1). The final sample included 4456 responses (N = 1325, age range: 5–90). In accordance with earlier studies and as we expected non-linear effects of age, we categorized age into four distinct groups: Young children; 5–11, older children; 12–17, young adults; 18–44, older adults; 45–90. See for an overview of the frequencies of participants per age group and gender.
Table 1. The frequency of participants per age group and gender.
Ethics statement
All aspects of the current study were approved by the ethical committee at Åbo Akademi University. All responses were collected at The Heureka Science Centre, where participants volunteered to participate while they were at the venue. We presented all participants with information about the design prior to their participation and offered no compensation for participation. Participants who were younger than 12-years-old could participate only if a close relative was present; the child and their relative had to give their verbal assent and consent, respectively.
Design
We employed a mixed design that included 48 conditions. The between subject factors were distance (5, 12.5, 20 m) and lighting (suboptimal: ∼2 lux; lx and optimal: ∼300lx). The within subject factors were facial masking (no facial masking, sunglasses, hood, sunglasses & hood) and line-up type (target present (TP) line-ups and target absent (TA) line-ups). See ‘Materials and stimuli’ for more information about the counterbalancing of the factors.
Measures
Background questions
Prior to taking part in the main experiment, each participant was asked a series of background questions on a tablet (the same that was used to record their responses during the main experiment). These questions were: (1) ‘How old are you?’ (answer options: 0–99 years old), (2) ‘Have you taken part in this experiment before?’ (answer options: yes/no), (3) ‘I have received information about this eyewitness experiment, I know I can stop at any time. I am participating because I want to’ (answer options: yes), (4) ‘Are you:’ (answer options: boy/man; girl/woman; other), (5) ‘How tall are you?’ (answer options: 0–220 cm), (6) ‘What country are you from’ (answer options: dropdown menu of countries), (7) ‘Do you usually wear glasses or contact lenses?’ (answer options: yes, near-sighted, yes far-sighted, yes-other, no), (8) ‘Are you wearing glasses or contact lenses at the moment?’ (answer options: yes/no).
Main measures
After responding to the background questions, participants took part in a test round (see procedure). The choices made in each test round were recorded, but not analyzed or reported here. The main measures that were recorded after each eyewitness observation of a live target were: (1) ‘The person was a:’ (answer options: man/woman), (2) ‘How tall was the person?’ (answer options: 0–220 cm), (3) ‘How old was the person?’ (answer options: 5–99), (4) ‘How much do you think the person weighs?’ (answer options: 0–150 kg), (5) ‘How far away from you was the person standing? (answer options: 0–200 meters)’. After answering these questions, a simultaneous eight-person line-up was presented on a separate page (see procedure). Here responses were recorded as either an image selection (the specific image selected) or as a line-up rejection (i.e. selecting the option ‘The person is not among the images’). Additionally, line-up response time (i.e. the duration from the presentation of the line-up until a choice was made) was recorded. After the line-up choice, participants were presented (on a new page) with the following post line-up questions: (1) ‘How certain are you of your choice?’ (answer options: 0–100%), (2) ‘Have you seen this person BEFORE this experiment?’ (answer options: yes/no), (3) ‘Have you seen any of the other people BEFORE this experiment?’ (answer options: yes/no). The last two questions were used to exclude any participant who had recognized any image in the line-up from outside the context of the experiment.
Procedure
The experimental setup was designed so that anywhere between one and four participants could take part at the same time. In some instances, there were four and, in some instances, there was only one participant who took part in the experiment. Each participant had a tablet placed in front of them. Between each participant there was a wooden screen to ensure that they could not observe one another’s decisions. Prior to the experiment, participants received verbal information concerning the experiment from the test instructor. Once they had verbally agreed to participate, they were placed in front of their respective tablets and their first task was to select the preferred language to be used on the tablet throughout the experiment. Next, the participants were asked to answer a series of background questions on the tablet (see Measures). Next, the instructor verbally guided the participants through a test round, where no actual live target was presented to the participants, but where the participants were presented with mock-questions and a mock-line-up in order to practice for the main experiment. During this time, the test instructor evaluated whether or not the participants understood what to do and could follow the instructions. Once the main experiment started, participants were instructed both by the instructor (verbally) and the tablet (in text) to keep their gaze fixed downwards. The instructor, via radio, then directed the live target to come out and take their position along the runway (see Materials and stimuli). The participants were then verbally instructed to look up and observe the target for approximately 20 s (time was managed by the instructor, who used a stop watch). During the 20 s, the target stood in the middle of the runway in a fixed position and rotated their head from side to side and also looked forward (five seconds per side and twice straight forward for five seconds). When 20 s had past, the participants were verbally instructed to look down again, while the target moved out of site (i.e. off the runway). Next the participants were instructed to continue with the application on their tablets, which first presented a series of pre-line-up questions (see Measures), then presented an eight-person simultaneous line-up (randomized by the software to be either TP or TA), followed by post line-up questions (see Measures). Next, the procedure was repeated in order to present the other three live targets. In some instances, we did not have all four targets present, in which case some participants only observed one or two live targets.
Experimental feedback
At the end of the experiment, all participants received feedback on how many correct or incorrect decisions they had made. The feedback was presented at the end of the experiment in the following way: ‘You identified 1 correct. The person you saw was missing from the line-up 2 times. When the image was missing you correctly chose not to identify 0 times. Thank you for participating as an eyewitness!’. The purpose of the feedback was to make the experiment more engaging for participants.
Materials and stimuli
Distance and lighting
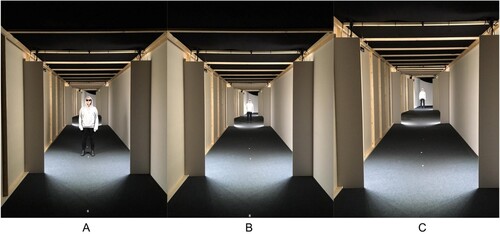
We built an enclosed indoor runway (2.6 m × 2.5 m × 22 m) with lighting devices (SUMO100+) facing towards the targets who were presented in the middle of the runway at the three distances; 5, 12.5 and 20 m (see ). Lighting was defined as the amount of light shining on the face (measure in lux: lx). Distance was defined as the physical distance between the participant and the target measured in meters (m). We counterbalanced distances, so that all targets were presented at the same distances for 2–3 h per day after which the distance was changed although the lighting was kept constant for the whole day (with a few exceptions due to practical arrangements) and then changed.
Figure 1. Illustration of the experimental setup.
Note. Panel A: A target presented wearing a hoodie and sunglasses at 5 meters in 300 lux (i.e. optimal lighting). Panel B: A target presented wearing a hoodie and sunglasses at 12.5 meters in 300 lux. Panel C: A target presented wearing a hoodie and sunglasses at 20 meters in 300 lux.
Targets
We employed eight targets (seven female and one male; Mheight = 166.75 cm, SDheight = 6.63; Mweight = 64.50 kg, SDweight = 11.67 kg, Mage = 25.13 y, SDage = 2.37 y). We employed two teams (one instructor and four targets) and rotated the teams approximately every 3–4 days.
Line-ups
For each target, we created two eight-person full color simultaneous photograph line-ups: One TP line-up (seven fillers and one target) and one TA line-up (same TP fillers and one new filler). Line-ups were presented on 10.1 inch tablets. The image size was kept constant and the positions were randomized by the software. No facial masking was included in the line-ups. We also programmed the software to randomize the participant to either a TP or a TA line-up separately for each trial. Fillers were selected by the first author to match the general characteristics of the target. Two common methods for filler selections are target-matching and description-matching and there have been ongoing debates concerning which is more appropriate – with findings suggesting that too homogenous line-ups (i.e. where targets and fillers match too closely) are less effective (e.g. Carlson et al., Citation2019; Colloff et al., Citation2021). Nevertheless, it is common for the police to use either method or a combination of both methods when creating line-ups. In the present study we made the filler selections based on target-matching simply due to time-constraints given the large-scale nature and logistical and practical difficulties of implementing the present design. Target and filler images were collected using a Canon camera (Model: EOS1300D) and a 50-mm lens. All individuals were photographed against a white canvas, wearing a white t-shirt, and in optimal lighting conditions. We also employed a professional editor to edit one line-up so that all the images had the same hair length. All line-ups included unique images, with one exception: One filler image was used in two separate line-ups because the targets were meant to work on separate days. Of necessity, the two targets were presented on the same day twice during the data collection (i.e. 2/34 days). We have controlled for this issue by excluding any observations where participants responded that they recognized any image from before and by including the target as a random intercept in the analyses where possible (see analyses).
Facial masking
All targets wore a light grey sweater with a hood. To create the four masking conditions, we instructed the targets to either leave their hood down (no facial masking), leave the hood down and wear black sunglasses (sunglasses), pull up the hood (hood), or wear the sunglasses and also have the hood up (sunglasses & hood). We counterbalanced the types of facial masking that the targets wore between trials.
Statistical analyses
Approach and rational
To account for the within-participant and within-target dependencies, we employed multilevel binary logistic regressions to investigate the estimated TP identification accuracy and TA rejection accuracy. We used the lme4 package (Bates et al., Citation2014) to conduct the main analyses in R (R Core Team, Citation2016), followed by the afex package to investigate the main and interactive effects (Singmann et al., Citation2019), and the emmeans package for Tukey post hoc comparisons (Lenth et al., Citation2019). We used the SjPlot and ggplot2 packages to generate figures (Lüdecke, Citation2019; Wickham, Citation2016). Where possible, we have included random intercepts for participants and targets, thus controlling for their variance. When investigating post hoc comparisons, we have only focused on those comparisons that were necessary to test our hypotheses. Our points of reference in the analyses for categorical variables were the shortest distance (5 m), optimal lighting (300lx), young adults (18–44), and no facial masking. In line with our hypotheses, in certain instances, we recategorized the age of the participants from a continuous variable to a categorical variable to investigate specific hypotheses. In all cases, we have included our motivations for the recategorizing of age and have also included an analysis using the continuous version of this variable.
Sample size justification
Our sample size estimate was partially based on earlier similar studies in eyewitness research (Lindsay et al., Citation2008; Nyman, Lampinen, et al., Citation2019), however, our unique data collection was conducted within a set time frame of two months and we aimed to collect as much data as possible. We submitted a pre-registration of our design after collecting responses from 400 participants, where we stated that our goal was to collect data from at least 800 participants but with no upper limit. As our plan was to collect four responses per person, a sample of 800 participants would have meant 3200 observations (i.e. approximately 67 responses per condition). However, our final data set consists of 4456 response from 1325 participants (i.e. approximately 93 observations per condition). The general consensus concerning sample sizes for a multilevel logistic regression model is 50 per cell (Ali et al., Citation2019; Moineddin et al., Citation2007). Based on the existing literature, our sample has adequate power.
Results
Descriptive data
The data used for the statistical analyses consisted (after data cleaning; see Participants) of 4456 responses from 1325 participants, with 2260 target present responses and 2196 target absent responses. In , we present an overview of the frequencies of correct and incorrect line-up choices, the correct identification rate (HR), the false alarm rate (FAR), discriminability, and response bias, per lighting level, facial masking, distance, and line-up type. separate the responses per age group. Similarly, an overview of the post line-up confidence can be found in and an overview of line-up response times can be found in .
Table 2. All participants: The frequencies of correct or incorrect line-up choices and the calculated diagnostic values per lighting level, facial masking, distance, line-up type.
Table 3. Young adults (18–44): The frequencies of correct or incorrect line-up choices and the calculated diagnostic values per lighting level, facial masking, distance, line-up type.
Table 4. Older adults (45–99): The frequencies of correct or incorrect line-up choices and the calculated diagnostic values per lighting level, facial masking, distance, line-up type.
Table 5. Young children (5–11): The frequencies of correct or incorrect line-up choices and the calculated diagnostic values per lighting level, facial masking, distance, line-up type.
Table 6. Older children (12–17): The frequencies of correct or incorrect line-up choices and the calculated diagnostic values per lighting level, facial masking, distance, line-up type.
Table 7. Confidence per lighting, facial masking, distance, and age group.
Table 8. Response time per lighting, facial masking, distance, and age group.
Main results
Identification accuracy with no facial masking: analyses approach
To investigate hypotheses H1–H3 (i.e. the combined effects of increased distance, decreased lighting, and eyewitness age on identification accuracy), we investigated TP identification accuracy and TA rejection accuracy separately using a subset of the data where the target(s) had worn no facial masking during the time the participant observed them. Because it is of specific relevance for practitioners, in the TP line-ups we focused on a subset of only those participants who made an identification in the line-up (i.e. the choosers) and disregarded those who rejected the line-up (i.e. the non-choosers). Here, distance, lighting, and age were treated as categorical variables (Model 1). Because some readers may wish to see the same analyses conducted where age is treated as a continuous variable, we have included such an analysis and results in our Supplemental Online Materials (see Model 1.1). Moreover, as some readers may also be interested to see the results that include both the choosers and non-choosers, we have included in our Supplemental Online Materials an analysis with all TP decisions where age is treated as a categorical variable (see Model 1.2) and where age is treated as a continuous variable (see Model 1.3). We conducted similar analyses for TA rejection accuracy with age as a categorical variable (Model 2), but because it would be somewhat illogical to focus only on the choosers when assessing rejection accuracy in TA line-ups, we included both the choosers and non-choosers in our analysis of the TA line-ups. See also the Supplemental Online Materials for additional TA analyses and results where age was treated as a continuous variable (see Model 2.1). The choosing behavior for TA line-ups can be found in . In all analyses, we included random intercepts for targets but not for participants because there was, on average, only one observation per person in these subsets.
Model 1: TP line-ups with no facial masking (only choosers)
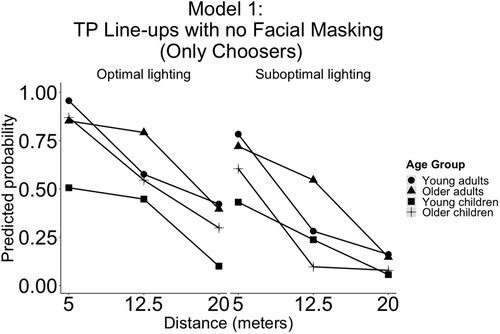
In the TP line-ups (line-up decisions = 427), we found that there was a main effect of distance (χ2 [2] = 68.87, p < .001), lighting (χ2 [1] = 24.17, p = .024), and age group (χ2 [3] = 21.21, p < .001), but no interactive effects on identification accuracy (see ). The predicted probability in optimal lighting for young adults at 5 m was .96 (95% CI [.88, .99]), at 12.5 m was .58 (95% CI [.31, .81]), and at 20 m was .42 (95% CI [.19, .69]). Post hoc comparisons (averaged over levels of lighting and age groups) revealed that accuracy was higher at 5 m compared with at 12.5 m (B = 1.46, SE = 0.39, p < .001) and compared with accuracy at 20 m (B = 2.70, SE = 0.40, p < .0001). Accuracy was also higher at 12.5 m compared with accuracy at 20 m (B = 1.24, SE = 0.38, p = .003). Accuracy (averaged over levels of distance and age groups) was higher in optimal versus suboptimal lighting (B = 1.25, SE = 0.32, p < .001). Moreover, post hoc comparisons of age groups revealed that young adults were more accurate (averaged over levels of lighting and distance) compared with young children (B = 1.40, SE = 0.38, p = .001), but not compared with older children (B = 0.80, SE = 0.44, p = .268) or older adults (B = −0.04, SE = 0.37, p = .999). These results illustrate that when focusing only on the choosers, identification accuracy was higher in optimal (vs. suboptimal) lighting, accuracy was higher at smaller (vs. greater) distances, and accuracy was higher for young adults compared with young children. The results revealed that increased distance had a detrimental effect on identification accuracy in both optimal and sub-optimal conditions and for all age groups, as the predicted probability of identification accuracy for young adults fell from .96 at 5 m to .42 at 20 m. The results also illustrated that TP identification accuracy increased with increased eyewitness age.
Figure 2. Identification accuracy in TP line-ups with no facial masking in optimal and suboptimal lighting (only choosers).
Note. The predicted probabilities of identification accuracy in target present line-ups (only the choosers) by distance, lighting, and age group with no facial masking. Here, the sample had been reduced to only the choosers (i.e. all decisions that were rejections had been removed). On the left, optimal lighting. On the right, suboptimal lighting. TP = Target present line-up, Optimal lighting = 300 lux, Suboptimal lighting = 2 lux. Young adults = 18–44, Older adults = 45–90, Young children 5–11, Older children 12–17. All results are based on multilevel binary logistic regressions. The line-ups consisted of eight images that were presented simultaneously; meaning that chance level of identifying the actual target was at .125.
Model 2: TA line-ups with no facial masking (choosers & non-choosers)
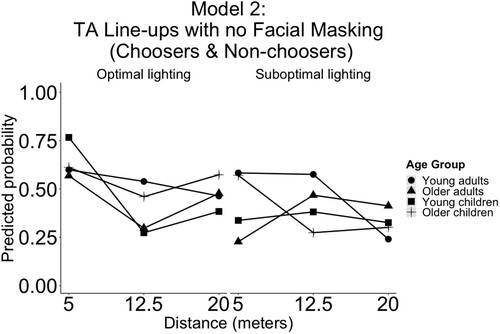
In the TA line-ups (line-up decisions = 589), we found that there was a main effect of distance (χ2 [2] = 6.21, p = .045), lighting (χ2 [1] = 5.51, p = .019), no main effect of age group (χ2 [3] = 4.52, p = .210), and no interactive effects on rejection accuracy (see ). The predicted probability in optimal lighting for young adults at 5 m was .60 (95% CI [.44, .74]), at 12.5 m .54 (95% CI [.39, .68]), and at 20 m .46 (95% CI [.32, .61]). Post hoc comparisons revealed that accuracy (averaged over all lighting conditions and age groups) was no higher at 5 m compared to the other distances. Accuracy (averaged overall all distances and age groups) was higher in optimal compared with suboptimal lighting (B = 0.47, SE = 0.21, p = .024). The TA rejection accuracy of the most accurate age group, young adults, and in optimal lighting fell from .60 at 5 m to .46 at 20 m.
Figure 3. Rejection accuracy in TA line-ups with no facial masking in optimal and suboptimal lighting (choosers & non-choosers).
Note. The predicted probabilities of rejection accuracy in target absent line-ups (choosers and non-choosers) by distance, lighting, and age group with no facial masking. On the left, optimal lighting. On the right, suboptimal lighting. TA = Target absent line-up, Optimal lighting = 300 lux, Suboptimal lighting = 2 lux. Young adults = 18–44, Older adults = 45–90, Young children 5–11, Older children 12–17. All results are based on multilevel binary logistic regressions. The line-ups consisted of eight images that were presented simultaneously.
Identification accuracy with facial masking: analyses approach
To investigate H3–H5, that is, if internal facial masking was more detrimental to accuracy compared with external facial masking in optimal viewing conditions (H4), whether this difference was reversed or disappeared under suboptimal viewing conditions (H5), and if there were age-related differences (H3), we investigated TP identification accuracy and TA rejection accuracy separately and included all facial masking conditions (including no facial masking). Due to model convergence issues when including all the predictors (distance, lighting, facial masking, and age), and to make the analyses and reporting manageable, we separated the analyses per lighting condition. We included random intercepts for both participants and targets in all analyses where not otherwise specified. Here, our aim was to focus on identification accuracy for only the choosers in TP line-ups and treat age as a categorical variable in suboptimal lighting and optimal lighting. However, treating age as a categorical variable resulted in a model that failed to converge, so we will not report the model here. Instead we investigated the TP line-ups with facial masking where age was treated as a continuous variable in optimal lighting (Model 3) and suboptimal lighting (Models 4). For additional analyses of both the choosers and non-choosers, see the Supplemental Online Materials (Models 3.1–2 and 4.1–2). We then ran analyses for the TA rejection accuracy in optimal lighting with age as a categorical variable (Model 5), followed by the same for suboptimal lighting (Model 6). See the Supplemental Online Materials for the TA line-up analyses with age as a continuous variable (Models 5.1 and 6.1).
Model 3: TP line-ups with facial masking in optimal lighting (only choosers)
In the TP line-ups (line-up decisions = 820) we found a main effect of distance (χ2 [2] = 13.65, p = .001), facial masking (χ2 [3] = 16.09, p = .001), and age (χ2 [1] = 16.82, p < .001), but no interactive effects on identification accuracy (see ). Post hoc comparisons (averaged over facial masking conditions) for all participants revealed that accuracy was higher at 5 m compared with 12.5 m (B = 0.95, SE = 0.23, p = .0001) and 20 m (B = 2.12, SE = 0.30, p < .0001). Accuracy at 12.5 m was higher compared with at 20 m (B = 1.17, SE = 0.28, p = .0001). Overall accuracy (averaged over all distances) for all participants was higher for no facial masking compared with only sunglasses (B = 1.27, SE = 0.27, p < .0001), was not higher compared with only a hood (B = 0.53, SE = 0.26, p = .176), and was higher compared with sunglasses and a hood (B = 1.90, SE = 0.36, p < .0001). Accuracy was lower for only sunglasses compared with only a hood (B = −0.74, SE = 0.25, p = .018), but was not higher compared with sunglasses and a hood (B = 0.63, SE = 0.33, p = .225). TP identification accuracy was higher for only a hood compared with sunglasses and a hood (B = 1.37, SE = 0.35, p < .001).
Figure 4. Identification accuracy in TP line-ups with facial masking in optimal and suboptimal lighting (only choosers).
Note. Panel A: The predicted probabilities of identification accuracy in target present line-ups by distance and facial masking in optimal lighting. Panel B: The same as Panel A but in suboptimal lighting. Here, the sample had been reduced to only the choosers (i.e. all decisions that were rejections had been removed). TP = Target present line-up, Optimal lighting = 300 lux, Suboptimal lighting = 2 lux. Young adults = 18–44, Older adults = 45–90, Young children 5–11, Older children 12–17. All results are based on multilevel binary logistic regressions. The line-ups consisted of eight images that were presented simultaneously; meaning that chance level of identifying the actual target was at .125.
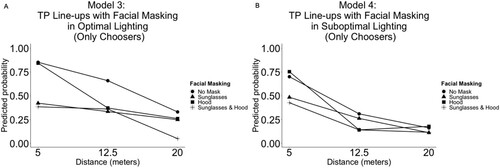
Model 4: TP line-ups with facial masking in suboptimal lighting (only choosers)
Focusing only on the choosers and excluding random intercepts for participants (due to model convergence issues). In the TP line-ups (line-up decisions = 771) we found a main effect of distance (χ2 [2] = 28.52, p < .001), facial masking (χ2 [3] = 9.95, p = .019), age (χ2 [1] = 8.45, p = .004), but no interactions on identification accuracy (see ). Post hoc comparisons revealed that overall accuracy (averaged over facial masking conditions) was higher at 5 m compared with 12.5 m (B = 1.76, SE = 0.22, p < .0001) and 20 m (B = 2.22, SE = 0.25, p < .0001). However, accuracy was not higher at 12.5 m compared with accuracy at 20 m (B = 0.46, SE = 0.25, p = .170). Overall accuracy (averaged over distances) was not higher for no facial masking compared with only sunglasses (B = 0.52, SE = 0.27, p = .208), or compared with only a hood (B = 0.21, SE = 0.27, p = .868), but was higher compared with sunglasses and a hood (B = 0.84, SE = 0.28, p = .012). Accuracy was not higher for only sunglasses compared with only a hood (B = −0.32, SE = 0.28, p = .659) or compared with sunglasses and a hood (B = 0.32, SE = 0.29, p = .690). TP identification accuracy was also not higher for only a hood compared with sunglasses and a hood (B = 0.63, SE = 0.29, p = .121). Higher participant age was associated with higher accuracy.
Model 5: TA line-ups with facial masking in optimal lighting (choosers & non-choosers)
In the TA line-ups and optimal lighting (line-up decisions = 1116), we found a main effect of distance (χ2 [2] = 10.99, p = .004), a main effect of facial masking (χ2 [3] = 20.04, p < .001), no main effect of age group (χ2 [3] = 6.93, p = .074), and an interaction between distance and facial masking (χ2 [6] = 13.48, p = .036) on rejection accuracy (see ). Post hoc comparisons revealed that accuracy was not higher at 5 m with no facial masking compared with when the target was wearing only sunglasses (B = 0.98, SE = 0.44, p = .520) or compared with only a hood (B = 0.42, SE = 0.39, p = .996), but accuracy was higher compared with sunglasses and a hood (B = 1.35, SE = 0.36, p = .008). Accuracy at 12.5 m with no facial masking was not higher compared with when the target was wearing sunglasses (B = 0.20, SE = 0.35, p = 1.000), when compared with only a hood (B = −0.19, SE = 0.39, p = 1.000), or compared with sunglasses and a hood (B = 0.90, SE = 0.39, p = .467). Accuracy at 20 m with no facial masking was not higher compared with when the target was wearing only sunglasses (B = 0.95, SE = 0.33, p = .159), when compared with only a hood (B = 0.17, SE = 0.32, p = 1.000), or compared with sunglasses and a hood (B = 0.07, SE = 0.36, p = 1.000). These results revealed that increased distance had a negative impact on rejection accuracy and that facial masking had on average a negative impact on rejection accuracy, but only at a short distance was the combination of internal and external facial masking markedly different from no facial masking.
Figure 5. Rejection accuracy in TA line-ups with facial masking in optimal and suboptimal lighting (choosers & non-choosers).
Note. Panel A: The predicted probabilities of rejection accuracy in target absent line-ups (choosers and non-choosers) by distance and facial masking in optimal lighting. Panel B: The same as Panel A but in suboptimal lighting. TA = Target absent line-up, Optimal lighting = 300 lux, Suboptimal lighting = 2 lux. Not separated by age group because there was no main effect of age. Age groups = Young adults = 18–44, Older adults = 45–90, Young children 5–11, Older children 12–17. All results are based on multilevel binary logistic regressions. The line-ups consisted of eight images that were presented simultaneously.
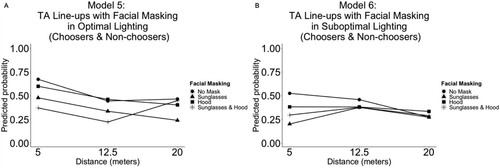
Model 6: TA line-ups with facial masking in suboptimal lighting (choosers & non-choosers)
In the TA line-ups and suboptimal lighting (line-up decisions = 1080), we found no main effect of distance (χ2 [2] = 3.85, p = .146), no main effect of facial masking (χ2 [3] = 5.95, p = .114), no main effect of age group (χ2 [3] = 6.44, p = .092), but an interaction between distance and age group (χ2 [9] = 18.25, p = .032) on rejection accuracy (see ). Post hoc analyses did not reveal any significant differences.
Identification accuracy and confidence
In order to investigate the postdictive value of post line-up confidence (H6), we conducted several confidence-accuracy characteristic analyses (CAC; Mickes, Citation2015). The CAC values are presented in together with all decision frequencies per lighting condition, facial masking condition, distance condition, decision type, and confidence bin (0–59%, 60–89%, and 90–100%). We have also illustrated the CAC analyses in (the raw values can be found in ). Overall, we found that there was a positive association between confidence and accuracy (see and ). However, as the distance increased, the lighting decreased, and more facial masking was introduced, subsequently confidence estimates fell, leaving far fewer high confidence decisions in suboptimal encoding conditions.
Figure 6. Confidence-accuracy characteristic analyses per lighting, facial masking, distance, and confidence bin.
Note. Panels A-H: Confidence-Accuracy Characteristic Analyses per Lighting, Facial Masking, Distance, and Confidence Bin. The total sample includes 4456 line-up decisions. However, there were 207 missing confidence judgements in the sample (i.e. participants that forgot or due to errors did not report their confidence). The figure above contains information based on 4249 decisions (4456–207). Please see Table 9 for the raw values that the CAC analyses are based on. Age range: 5–90. Optimal = 300 lux, Suboptimal = 2 lux, no mask = No disguise worn by live target, sunglasses, hood, sunglasses & hood = descriptions of the disguise worn by the live target. CAC = Confidence-accuracy characteristic, Confidence = post line-up decision. Distance was measured in meters (m). The formula used to calculate the CAC value per bin (0–59%, 60–89%, 90–100%) was: target present (TP) identifications / (TP filler identifications + (target absent (TA) filler identification)/8). In other words, we assumed fair line-ups and that is why we divided by eight (i.e. the number of images in the line-ups).
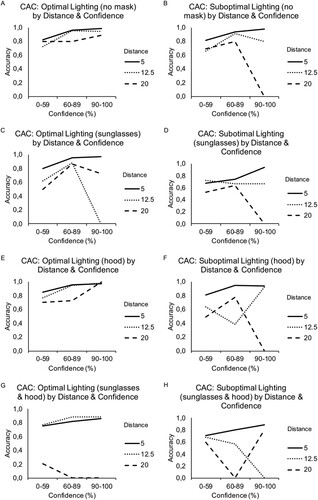
Table 9. Confidence-accuracy characteristic analyses per lighting, facial masking, distance, line-up type, decisions, and confidence bin.
Additionally, we have added exploratory receiver operating characteristic (ROC) analyses based on the raw data, which are visualized in . In the ROC analyses we have focused on the effects of distance, lighting, and facial masking. These ROC analyses are exploratory only in the sense that we had not planned to include them when pre-registering this study. The ROC analyses were conducted and plotted using the pyWitness software (Mickes et al., Citation2022). For the sake of clarity, we have split the data to investigate discriminability in optimal vs. suboptimal lighting (), discriminability by distance in optimal and suboptimal lighting (panels A and B in ), discriminability by facial masking in optimal and suboptimal lighting (panels C and D, ), and discriminability per facial masking by distance in optimal and suboptimal lighting (panels A-H, ). A summary of all analyses can be found in the Supplemental Online Materials.
Figure 7. Raw data receiver operating characteristic (ROC) curves per lighting.
Note. Receiver Operating Characteristic (ROC) Curves per lighting condition. Optimal Lighting = 300 lux, Suboptimal Lighting = 2 lux. This analysis was based on 4249 observations (4456 observations minus 207 missing confidence judgements).
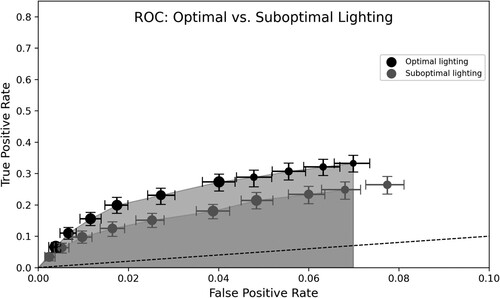
Figure 8. Raw data receiver operating characteristic (ROC) curves per lighting, facial masking, and distance.
Note. Panel A: Receiver Operating Characteristic (ROC) curves per distance (5 meters (m), 12.5, 20 m) in optimal lighting (300 lux). This analysis was based on 2197 observations (2283 observations minus 86 missing confidence judgements). Panel B: ROC curves per distance in suboptimal lighting (2 lux). This analysis was based on 2052 observations (2173 observations minus 121 missing confidence judgements). Panel C: ROC curves per facial masking in optimal lighting (no_mask = no facial masking worn by live target; sunglasses = facial masking (sunglasses) worn by live target, hood = facial masking (hood) worn by live target, sunglasses_&_hood = facial masking (sunglasses and hood) worn by live target). This analysis was based on 2197 observations (2283 observations minus 86 missing confidence judgments). Panel D: ROC curves per facial masking in suboptimal lighting. This analysis was based on 2052 observations (2173 observations minus 121 missing confidence judgements).
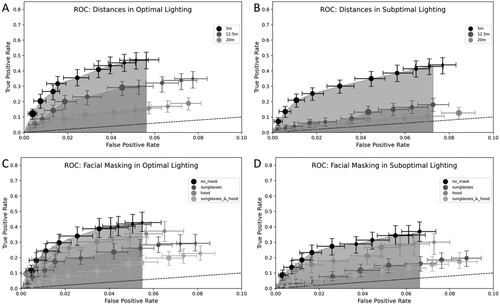
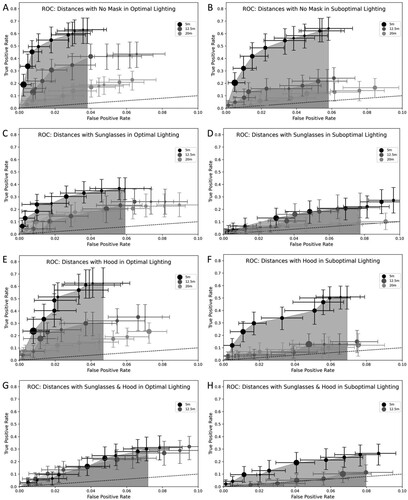
Figure 9. Raw data receiver operating characteristic (ROC) curves per lighting, facial masking, and distance.
Note. Panel A: Receiver Operating Characteristic (ROC) curves per distance (5 meters (m), 12.5, 20 m) in optimal lighting (300 lux) with no facial masking worn by target. This analysis was based on 586 observations (609 observations minus 23 missing confidence judgements). Panel B: ROC curves per distance in suboptimal lighting (2 lux) with no facial masking worn by target. This analysis was based on 541 observations (574 observations minus 33 missing confidence judgements). Panel C: ROC curves per distance in optimal lighting with sunglasses worn as facial masking by target. This analysis was based on 571 observations (595 observations minus 24 missing confidence judgements). Panel D: ROC curves per distance in suboptimal lighting with sunglasses worn as facial masking by target. This analysis was based on 522 observations (551 observations minus 29 missing confidence judgements). Panel E: ROC curves per distance in optimal lighting with a hood worn as facial masking by target. This analysis was based on 525 observations (549 observations minus 24 missing confidence judgements). Panel F: ROC curves per distance in suboptimal lighting with hood worn as facial masking by target. This analysis was based on 543 observations (573 observations minus 30 missing confidence judgements). Panel G: ROC curves per distance in suboptimal lighting with sunglasses and a hood worn as facial masking by target. This analysis was based on 515 observations (530 observations minus 15 missing confidence judgements). Panel H: ROC curves per distance in suboptimal lighting with sunglasses and a hood worn as facial masking by target. This analysis was based on 446 observations (475 observations minus 29 missing confidence judgements). Due to the lack of target identifications, we were unable to create ROC curves for 20 m for the figures in Panels G and H.
We found support for H1 that increased distance and decreased lighting have a negative impact on discriminability. Participants exhibited higher discriminability in optimal lighting compared to suboptimal lighting (optimal lighting: pAUC = 0.0165 ± 0.0008; suboptimal lighting: pAUC = 0.0117 ± 0.0007, Z = 4.3258, p < .001) (see ). Additionally, reducing the distance to the target improved discriminability in both optimal and suboptimal lighting (see panels A and B, ). In optimal lighting, discriminability was higher at 5 m (pAUC = 0.0194 ± 0.0014) compared to 12.5 m (pAUC = 0.0115 ± 0.001, Z = 4.3907, p < .001) and 20 m (pAUC = 0.0058 ± 0.0007, Z = 8.3852, p < .001). Similarly, in suboptimal lighting, discriminability was higher at 5 m (pAUC = 0.0221 ± 0.0017) compared to 12.5 m (pAUC = 0.0074 ± 0.001, Z = 7.5033, p < .001) and 20 m (pAUC = 0.0046 ± 0.0009, Z = 9.212, p < .001). We also found partial support for our threshold hypothesis (H2). As can be seen in panel B of , discriminability in suboptimal lighting is close to chance level performance at 12.5 m and the confidence intervals of discriminability at 20 m overlap with chance level performance. The results support the earlier provisional findings of Nyman, Antfolk, et al. (Citation2019).
Turning to H4 (internal versus external facial masking), under optimal lighting, no facial masking (pAUC = 0.0173 ± 0.0015) showed significantly better discriminability compared to when the target was wearing sunglasses (pAUC = 0.0099 ± 0.0012, Z = 3.8212, p = .0001) (see panel C, ). However, there was no significant difference between no facial masking and wearing a hood (pAUC = 0.0141 ± 0.0015, Z = 1.4939, p = .135). Additionally, comparing no facial masking to sunglasses & hood (pAUC = 0.0051 ± 0.0009), we found a significant difference favoring no facial masking (Z = 6.9263, p < .001). Comparing sunglasses to hood, there was a significant difference favoring hood (Z = 2.2201, p = .026). Comparing sunglasses to sunglasses & hood revealed a significant difference favoring sunglasses (Z = 3.2664, p = .001). Comparing hood to sunglasses & hood revealed a significant difference favoring hood (Z = 5.2459, p < .001). These results support our hypothesis (H4) and illustrate that internal facial masking has a more negative effect on accuracy compared with no facial masking and external facial masking.
Next, our results support hypothesis H5 by demonstrating that under suboptimal viewing conditions, both internal facial masking and external facial masking have a negative effect on discriminability (see ). However, we did not find support for our assumption that external facial masking would have a more negative effect on accuracy compared with internal facial masking at greater distances in suboptimal lighting. In suboptimal lighting with sunglasses, there were no significant differences in discriminability between 5 m (pAUC = 0.011 ± 0.0029) and 12.5 m (pAUC = 0.0097 ± 0.0023, Z = 0.3378, p = .736), and 20 m (pAUC = 0.0045 ± 0.0018, Z = 1.9133, p = .056), or between 12.5 and 20 m (Z = 1.7935, p = .073). Notably, discriminability was low for all distances with sunglasses, clearly showing the combined negative effect of sunglasses and suboptimal lighting (see panel D, ). In suboptimal lighting and with a hood, discriminability was significantly better at 5 m (pAUC = 0.0234 ± 0.0029) compared to 12.5 m (pAUC = 0.0053 ± 0.0017, Z = 5.3035, p < .001) and 20 m (pAUC = 0.0052 ± 0.0023, Z = 4.7119, p < .001). There was no difference between 12.5 and 20 m (Z = 0.0124, p = .990) (see panel F, ). Lastly, in suboptimal lighting and with both sunglasses and a hood, discriminability was significantly better at 5 m (pAUC = 0.0132 ± 0.0028) compared to 12.5 m (pAUC = 0.0039 ± 0.0015, Z = 2.9049, p = .004) (see panel H, ). Additionally, there were too few correct target identifications at 20 m to compare with the other distances, which is an indicator of the negative impact of combining increased distance and internal and external facial masking.
Identification accuracy and response time with no facial masking: analyses approach
To investigate the postdictive value of response time on identification accuracy among the choosers (H7), we first evaluated which fillers were selected most in the TA line-ups. Based on the highest frequency per TA line-up, we selected eight selection-based innocent suspects. We then created a new variable where all target selections were defined as ‘1’ (i.e. correct) and all innocent selection were defined as ‘0’ (i.e. incorrect). We ignored all other filler selections and all rejections. Next, based on the subset of only the choosers of targets who wore no facial masking, we investigated the postdictive value of response time. We included distance, lighting, and response time as predictors, with random intercepts for targets (but not for participants). Model convergence issues did not allow for the inclusion of age as a predictor, so we first analyzed all participants combined and then re-ran the analysis with only adults; the results were almost identical (i.e. the same predictors were significant) so we have opted to only report the analyses with all participants combined. We first ran an analysis of identification accuracy that included distance and lighting as categorical variables and age and response time as continuous variables (Model 7). Next, when including facial masking, model convergence issues forced us to divide the analysis per lighting condition into optimal lighting (Model 8) and suboptimal lighting (Model 9). Here, we report only the results from the entire sample, as we were unable to reach model convergence with only the young adult data.
Model 7: identification accuracy with no facial masking (only choosers)
With no facial masking, only the choosers, and all ages (line-up decisions = 361), we found a main effect of distance (χ2 [2] = 15.82, p < .001), no main effect of lighting (χ2 [1] = 1.31, p = .253), a main effect of response time (χ2 [1] = 22.52, p < .001), and no interactive effects on identification accuracy. The results show a decrease in accuracy with increased distance and increased response times.
Model 8: identification accuracy with facial masking in optimal lighting (only choosers)
In optimal lighting, with both facial masking and no facial masking, only the choosers, and all ages (line-up decisions = 653), we found a main effect of distance (χ2 [2] = 14.39, p < .001), facial masking (χ2 [3] = 13.53, p = .004), response time (χ2 [1] = 5.91, p = .015), and no interactive effects on identification accuracy. The results show a decrease in accuracy with increased distance and increased response time. In addition, facial masking led to a decrease in accuracy compared with no facial masking.
Model 9: identification accuracy with facial masking in suboptimal lighting (only choosers)
In suboptimal lighting, with both facial masking and no facial masking, only the choosers, and all ages (line-up decisions = 578), we found a main effect of distance (χ2 [2] = 8.71, p = .013), facial masking (χ2 [3] = 10.57, p = .014), response time (χ2 [1] = 7.39, p = .007), and no interactive effects on identification accuracy. The results were similar to that of optimal lighting except that here there was no difference when comparing the different types of facial masking.
Discussion
Earlier research has found that identification accuracy of unfamiliar faces is negatively impacted by increased viewing distance (de Jong et al., Citation2005; Lampinen et al., Citation2014; Lindsay et al., Citation2008; Lockamyeir et al., Citation2020; Loftus & Harley, Citation2005; McKone, Citation2009; Nyman, Antfolk, et al., Citation2019; Nyman, Lampinen, et al., Citation2019; Wagenaar & Van Der Schrier, Citation1996), decreased lighting (de Jong et al., Citation2005; Nyman, Antfolk, et al., Citation2019; Wagenaar & Van Der Schrier, Citation1996), and facial masking (Manley et al., Citation2018; Mansour et al., Citation2020). The reason for the negative impact on accuracy is that these factors reduce the visibility of facial features during encoding and this lowers accuracy during later retrieval and identification in a line-up task.
Based on a sample of 1325 participants (age range: 5–90) and 4456 line-up decisions, our findings clearly illustrate that with no facial masking both increased distance and decreased lighting had a negative impact on identification accuracy. This was further substantiated with exploratory ROC analyses showing a negative impact of increased distance and decreased lighting on discriminability. These results reaffirm earlier findings concerning the negative effect that increased distance has on eyewitness accuracy using live targets (Nyman, Lampinen, et al., Citation2019) and robustly confirms the findings of earlier research on the negative effects of decreased lighting with live targets (Nyman, Antfolk, et al., Citation2019). However, we also have new findings that we have outlined below by separating between identification accuracy with no facial masking and with facial masking.
Identification accuracy with no facial masking
We hypothesized that increased distance and decreased lighting would have a negative impact on identification accuracy (H1). We found clear support for a negative impact of increased distance on the predicted probability of correct TP identifications for only the choosers. For example, when focusing on the most accurate age group (i.e. young adults), the predicted probability decreased from .96 at 5 m to .58 at 12.5 m and to .42 at 20 m (see ). Moreover, for young children identification accuracy was significantly lower (compared with young adults). For all participants (i.e. averaged over all ages), the predicted probability of identification accuracy decreased from .84 at 5 m to .61 at 12.5 m and to .31 at 20 m (see Model 1.1 in the Supplemental Online Materials). Our results also illustrate that decreased lighting had a negative impact on identification accuracy. However, it appears that increased distance had the largest negative impact on identification accuracy. Combined, these results mean that we did not find clear support for our threshold hypothesis (H2). However, even though TP identification accuracy did not fall to chance level (i.e. .125), it was still markedly low at 20 m and highly likely to lead to substantial errors. The impact of increased distance on TA rejection accuracy was not as noticeable compared with TP identification accuracy. For the most accurate age group (i.e. young adults) rejection accuracy fell from .60 at 5 m to .54 at 12.5 m and to .46 at 20 m. For all participants the predicted probability of accuracy decreased from .63 at 5 m to .43 at 12.5 m and to .46 at 20 m.
Additionally, assessing identification accuracy separately for TP and TA line-ups may not necessarily present a complete picture of the effects of our manipulations on identification accuracy. For a comparative overview, see for the correct identification rates, the false alarm rates, discriminability rates, and response biases, per lighting level, facial masking, distance, and line-up type. Looking at the raw data in , we can see that in optimal (sub-optimal) lighting the correct identification rate was .63 (.64) and the false alarm rate was 0.32 (.47) at 5 m. At 20 m, the correct identification rate was .23 (.16) and the FAR was .53 (.68). Moreover, when analyzing discriminability using exploratory ROC curves (see ), we confirmed the negative effects of increased distance and decreased lighting on discriminability. Concerning H2, we also confirmed that discriminability in suboptimal lighting was close to chance level performance at 12.5 m and that the confidence intervals of discriminability at 20 m overlap with chance level performance. This is partial support H2 and strengthens the provisional findings of Nyman, Antfolk, et al. (2019) that performance at 20 meters in suboptimal lighting and with no facial masking is at chance level.
These results clearly illustrate that the overall accuracy and discriminability declined dramatically with increased distance. The difference between optimal and suboptimal lighting was not substantial, which is surprising, but the difference between 5 and 20 m was considerable. Additionally, we hypothesized that there would be age-related differences (H3). However, interestingly our initial prediction that both young children and older adults would fare worse than young adults was only partially supported, as young children were on average less accurate but the same was not true of the older adults. Investigating age both as a continuous variable and as a categorical variable, we found that increased age was associated with higher accuracy. This is also illustrated in .
Identification accuracy with facial masking
We hypothesized, similar to no facial masking, that accuracy would be lower with increased distance and decreased lighting when targets wore facial masking (H1). We found clear evidence of a fall in accuracy as distance increased and, when interpreting the figures, we can infer that decreased lighting had a negative impact on accuracy; although not to the same extent as increased distance. Concerning facial masking, we had set up two hypotheses stating that internal (vs. external) facial masking would be more determinantal to accuracy under optimal (5 m and optimal lighting) viewing conditions (H4) and that external (vs. internal) facial masking would be more determinantal to accuracy under suboptimal (20 m & suboptimal lighting) viewing conditions (H5). When investigating TP identification accuracy, we did not find support for our hypotheses (H4 & H5) that facial masking would impact TP identification accuracy differently at different distances. Instead we found, in both optimal and suboptimal lighting conditions, that internal facial masking (sunglasses) and internal and external facial masking (sunglasses and hood) had overall the most negative impact on TP identification accuracy. Here, an investigation of age revealed that increased age was positively associated with overall accuracy, but we found no interactive effects between age, distance, and facial masking. When investigating TA rejection accuracy, the results were somewhat similar to the results of TP identification accuracy but with more variability and a less pronounced negative effect of increased distance and less pronounced age-related differences (compare and ).
Additionally, the ROC analyses (see ) illustrate that at close proximity, internal facial masking had a more negative effect compared with external facial masking on discriminability. Combined, the overall results revealed that internal facial masking or a combination of internal and external facial masking had a dramatic negative effect on discriminability. Moreover, that facial masking, in combination with increased distance or decreased lighting, had an increased negative impact on discriminability; to the extent that the difference between these negative effects became indistinguishable after observations in suboptimal encoding conditions.
Lastly, from a metacognitive perspective, earlier studies have found that the choosing behavior of eyewitnesses is not adequately updated in relation to the objective difficulty of the task (Lindsay et al., Citation2008; Mansour et al., Citation2020; Nyman, Lampinen, et al., Citation2019). In the present study we found that the decision criterion became more conservative as the viewing conditions worsened (see ). This is somewhat in contrast to earlier findings, but could be the result of our substantial manipulation of the visual conditions. It may be that because we manipulated three factors (light, distance, and facial masking) the combined effect was so clearly negative on memory encoding that participants were more aware of the task difficulty and adjusted their response criterion accordingly. Had the manipulations been subtler, the response criterion might not have been so conservative (e.g. Giacona et al., Citation2021).
Identification accuracy and confidence
The pattern that emerged was that confidence was positively associated with accuracy (see and ). However, by adding masking, increased distance, and decreased lighting, the frequency of high confidence decisions fell markedly. Additionally, the positive association between confidence and accuracy appears to have weakened when viewing conditions worsened; although the low number of high confidence decisions makes this interpretation somewhat speculative. This echoes other recent results (Lockamyeir et al., Citation2020). Overall, the results imply that more research is needed to evaluate the association between confidence and accuracy, especially under poor encoding conditions.
Identification accuracy and response time
Overall, we found that shorter response times were positively associated with identification accuracy among the choosers who had witnessed a target both wearing and not wearing a mask and in both optimal and suboptimal conditions. There were no interactive effects between distance or facial masking on identification accuracy and the effects were similar in both optimal and suboptimal lighting.
Limitations
There are a few limitations that should be mentioned in relation to the present study. First, this was not a mock crime event and that might reduce the generalizability from an applied perspective. Second, the participants knew that they should memorize the perpetrator, thus again reducing applied generalizability to some crime events. Third, although we used eight separate live targets, these were culturally and phenotypically very similar and it would be useful and informative to include more varied targets.
Conclusions
In the present study we found that increased distance, decreased lighting, and facial masking (internal and external) had a substantially negative impact on identification accuracy and discriminability. Importantly, the negative impact of facial masking was more pronounced under optimal (vs suboptimal) viewing conditions with internal (vs. external) facial masking being most detrimental to identification accuracy and discriminability. Under suboptimal viewing conditions the effect of facial masking (both internal and external) on identification accuracy and discriminability was low due to the overall negative effects of increased distance and decreased lighting; with increased distance having the strongest negative impact on identification accuracy and discriminability. This means that if a perpetrator is seen under the cover of low lighting (e.g. moonlight) and at a distance of approximately 20 meters then facial masking (either internal or external) has little added negative effect. Moreover, at 20 meters in low lighting, eyewitness reliability was overall in the range of chance level and, therefore, the reliability of identifications conducted after having encoded a perpetrator in such viewing condition is exceptionally low. Overall, this study clearly highlights the negative impact that viewing conditions have on eyewitness identification accuracy and discriminability. We hope that our findings will provide guidance for practitioners to assess the evidentiary value of real-life identification decisions.
Open Scholarship


This article has earned the Center for Open Science badges for Open Data, Open Materials and Preregistered. The data and materials are openly accessible at https://osf.io/s5tcu/ , https://osf.io/s5tcu/ and https://aspredicted.org/zb3sp.pdf.
Supplemental Material
Download MS Word (683.1 KB)Acknowledgements
We wish to thank the Finnish Science Centre Heureka for collaborating with us. We also wish to thank the Elsa Korkman, the test instructors, and the targets for all their help and hard work during the data collection.
Disclosure statement
No potential conflict of interest was reported by the author(s).
Data availability statement
The datasets analyzed for this study can be found in the Open Science Framework: https://osf.io/s5tcu/; https://osf.io/s5tcu/?view_only=0c6f9455d2434110a6c33b230ffc5377
Correction Statement
This article has been corrected with minor changes. These changes do not impact the academic content of the article.
Additional information
Funding
References
- Albright, T. D. (2017). Why eyewitnesses fail. Proceedings of the National Academy of Sciences, 114(30), 7758–7764. https://doi.org/10.1073/pnas.1706891114
- Ali, A., Ali, S., Khan, S. A., Khan, D. M., Abbas, K., Khalil, A., Manzoor, S., & Khalil, U. (2019). Sample size issues in multilevel logistic regression models. PLoS ONE, 14(11), 1–13. https://doi.org/10.1371/journal.pone.0225427
- Andrews, T. J., Davies-Thompson, J., Kingstone, A., & Young, A. W. (2010). Internal and external features of the face are represented holistically in face-selective regions of visual cortex. The Journal of Neuroscience, 30(9), 3544–3552. https://doi.org/10.1523/JNEUROSCI.4863-09.2010
- Anooshian, L. J. (1999). Understanding age differences in memory: Disentangling conscious and unconscious processes. International Journal of Behavioral Development, 23(1), 1–17. https://doi.org/10.1080/016502599383973
- Bartlett, J. C. (2014). The older eyewitness. In T. J. Perfect, & D. S. Lindsay (Eds.), The SAGE handbook of applied memory (pp. 654–674). SAGE. https://doi.org/10.4135/9781446294703.n36
- Bartlett, J. C., & Memon, A. (2007). Eyewitness memory in young and older eyewitnesses. In R. C. L. Lindsay, D. F. Ross, J. D. Read, & M. P. Toglia (Eds.), The handbook of eyewitness psychology, Vol. 2. Memory for people (pp. 309–338). Lawrence Erlbaum Associates Publishers.
- Bates, D., Mächler, M., Bolker, B., & Walker, S. (2014). Fitting linear mixed-effects models using lme4. Journal of Statistical Software, 67(1). https://doi.org/10.18637/jss.v067.i01
- Brainerd, C. J., Holliday, R. E., & Reyna, V. F. (2004). Behavioral measurement of remembering phenomenologies: So simple a child can do it. Child Development, 75(2), 497–504. https://doi.org/10.1111/j.1467-8624.2004.00689.x
- Brewer, N., & Wells, G. L. (2011). Eyewitness identification. Current Directions in Psychological Science, 20(1), 24–27. https://doi.org/10.1177/0963721410389169
- Burke, D., & Sulikowski, D. (2013). The evolution of holistic processing of faces. Frontiers in Psychology, 4(JAN), 1–10. https://doi.org/10.3389/fpsyg.2013.00011
- Carlson, C. A., Hemby, J. A., Wooten, A. R., Jones, A. R., Lockamyeir, R. F., Carlson, M. A., Dias, J. L., & Whittington, J. E. (2021). Testing encoding specificity and the diagnostic feature-detection theory of eyewitness identification, with implications for showups, lineups, and partially disguised perpetrators. Cognitive Research: Principles and Implications, 6(1). https://doi.org/10.1186/s41235-021-00276-3
- Carlson, C. A., Jones, A. R., Whittington, J. E., Lockamyeir, R. F., Carlson, M. A., & Wooten, A. R. (2019). Lineup fairness: Propitious heterogeneity and the diagnostic feature-detection hypothesis. Cognitive Research: Principles and Implications, 4(1). https://doi.org/10.1186/s41235-019-0172-5
- Carragher, D. J., & Hancock, P. J. B. (2020). Surgical face masks impair human face matching performance for familiar and unfamiliar faces. Cognitive Research: Principles and Implications, 5(1). https://doi.org/10.1186/s41235-020-00258-x
- Colloff, M. F., Wilson, B. M., Seale-Carlisle, T. M., & Wixted, J. T. (2021). Optimizing the selection of fillers in police lineups. Proceedings of the National Academy of Sciences, 118(8). https://doi.org/10.1073/pnas.2017292118
- Crookes, K., & McKone, E. (2009). Early maturity of face recognition: No childhood development of holistic processing, novel face encoding, or face-space. Cognition, 111(2), 219–247. https://doi.org/10.1016/j.cognition.2009.02.004
- Cutler, B. L., Penrod, S. D., & Dexter, H. R. (1990). Juror sensitivity to eyewitness identification evidence. Law and Human Behavior, 14(2), 185–191. https://doi.org/10.1007/BF01062972
- de Jong, M., Wagenaar, W. A., Wolters, G., & Verstijnen, I. M. (2005). Familiar face recognition as a function of distance and illumination: A practical tool for use in the courtroom. Psychology, Crime & Law, 11(1), 87–97. https://doi.org/10.1080/10683160410001715123
- Dodson, C. S., & Dobolyi, D. G. (2016). Confidence and eyewitness identifications: The cross-race effect, decision time and accuracy. Applied Cognitive Psychology, 30(1), 113–125. https://doi.org/10.1002/acp.3178
- Dunning, D., & Perretta, S. (2002). Automaticity and eyewitness accuracy: A 10- to 12-second rule for distinguishing accurate from inaccurate positive identifications. Journal of Applied Psychology, 87(5), 951–962. https://doi.org/10.1037/0021-9010.87.5.951
- Ellis, H. D., Shepherd, J. W., & Davies, G. M. (1979). Identification of familiar and unfamiliar faces from internal and external features: Some implications for theories of face recognition. Perception, 8(4), 431–439. https://doi.org/10.1068/p080431
- Erickson, W. B., Lampinen, J. M., & Moore, K. N. (2015). Eyewitness identifications by older and younger adults: A meta-analysis and discussion. Journal of Police and Criminal Psychology, 31(2), 108–121. https://doi.org/10.1007/s11896-015-9176-3
- Fitzgerald, R. J., & Price, H. L. (2015). Eyewitness identification across the life span: A meta-analysis ofage differences.. Psychological Bulletin, 141(Issue 6), 1228–1265. https://doi.org/10.1037/bul0000013
- Fletcher, K. I., Butavicius, M. A., & Lee, M. D. (2008). Attention to internal face features in unfamiliar face matching. British Journal of Psychology, 99(3), 379–394. https://doi.org/10.1348/000712607X235872
- Fulero, S. M. (2009). System and estimator variables in eyewitness identification: A review. In Psychological expertise in court: Psychology in the courtroom (pp. 57–78). https://psycnet.apa.org/record/2009-12876-003
- Giacona, A. M., Lampinen, J. M., & Anastasi, J. S. (2021). Estimator variables can matter even for high-confidence lineup identifications made under pristine conditions. Law and Human Behavior, 45(3), 256–270. https://doi.org/10.1037/lhb0000381
- Grabman, J. H., Dobolyi, D. G., Berelovich, N. L., & Dodson, C. S. (2019). Predicting high confidence errors in eyewitness memory: The role of face recognition ability, decision-time, and justifications. Journal of Applied Research in Memory and Cognition, 8(2), 233–243. https://doi.org/10.1037/h0101835
- Healy, M. R., Light, L. L., & Chung, C. (2005). Dual-process models of associative recognition in young and older adults: Evidence from receiver operating characteristics. Journal of Experimental Psychology: Learning, Memory, and Cognition, 31(4), 768–788. https://doi.org/10.1037/0278-7393.31.4.768
- Jacoby, L. L. (1991). A process dissociation framework: Separating automatic from intentional uses of memory. Journal of Memory and Language, 30(5), 513–541. https://doi.org/10.1016/0749-596X(91)90025-F
- Knowles, M. M., & Hay, D. C. (2014). The role of inner and outer face parts in holistic processing: A developmental study. Acta Psychologica, 149, 106–116. https://doi.org/10.1016/j.actpsy.2014.03.012
- Kovera, M. B., & Evelo, A. J. (2021). Eyewitness identification in its social context. Journal of Applied Research in Memory and Cognition, 10(3), 313–327. https://doi.org/10.1016/j.jarmac.2021.04.003
- Kramer, R. S. S., & Ritchie, K. L. (2016). Disguising superman: How glasses affect unfamiliar face matching. Applied Cognitive Psychology, 30(6), 841–845. https://doi.org/10.1002/acp.3261
- Lampinen, J. M., Erickson, W. B., Moore, K. N., & Hittson, A. (2014). Effects of distance on face recognition: Implications for eyewitness identification. Psychonomic Bulletin & Review, 21(6), 1489–1494. https://doi.org/10.3758/s13423-014-0641-2
- Lenth, R., Singmann, H., Love, J., Buerkner, P., & Herve, M. (2019). Package “emmeans”. CRAN. https://CRAN.R-project.org/package=emmeans
- Lindsay, D. S., Read, J. D., & Sharma, K. (1998). Accuracy and confidence in person identification: The relationship is strong when witnessing conditions vary widely. Psychological Science, 9(3), 215–218. https://doi.org/10.1111/1467-9280.00041
- Lindsay, R. C. L., Semmler, C., Weber, N., Brewer, N., & Lindsay, M. R. (2008). How variations in distance affect eyewitness reports and identification accuracy. Law and Human Behavior, 32(6), 526–535. https://doi.org/10.1007/s10979-008-9128-x
- Lockamyeir, R. F., Carlson, C. A., Jones, A. R., Carlson, M. A., & Weatherford, D. R. (2020). The effect of viewing distance on empirical discriminability and the confidence–accuracy relationship for eyewitness identification. Applied Cognitive Psychology, 34(5), 1047–1060. https://doi.org/10.1002/acp.3683
- Loftus, G. R., & Harley, E. M. (2005). Why is it easier to identify someone close than far away? Psychonomic Bulletin & Review, 12(1), 43–65. https://doi.org/10.3758/BF03196348
- Lüdecke, D. (2019). sjPlot: Data Visualization for Statistics in Social Science (R package version 2.8.1). https://doi.org/10.5281/zenodo.1308157
- Malpass, R. S., Tredoux, C. G., & McQuiston-Surrett, D. (2008). The handbook of eyewitness psychology: Volume II—memory for people. R. C. L. Lindsay, D. F. Ross, J. D. Read, and M. P. Toglia. Lawrence erlbaum associates, mahwah, NJ, 2007. No. of pages 601. ISBN 978-0-8058-5152-6. Applied Cognitive Psychology, 2, 585–586. https://doi.org/10.1002/acp.1450
- Manley, K. D., Chan, J. C. K., & Wells, G. L. (2018). Do masked-face lineups facilitate eyewitness identification of a masked individual? Journal of Experimental Psychology: Applied, 25(3), 396–409. https://doi.org/10.1037/xap0000195
- Mansour, J. K., Beaudry, J. L., Bertrand, M. I., Kalmet, N., Melsom, E. I., & Lindsay, R. C. L. (2020). Impact of disguise on identification decisions and confidence with simultaneous and sequential lineups. Law and Human Behavior, 44(6), 502–515. https://doi.org/10.1037/lhb0000427
- McKone, E. (2009). Holistic processing for faces operates over a wide range of sizes but is strongest at identification rather than conversational distances. Vision Research, 49(2), 268–283. https://doi.org/10.1016/j.visres.2008.10.020
- Megreya, A. M., & Burton, A. M. (2006). Unfamiliar faces are not faces: Evidence from a matching task. Memory & Cognition, 34(4), 865–876. https://doi.org/10.3758/BF03193433
- Mickes, L. (2015). Receiver operating characteristic analysis and confidence-accuracy characteristic analysis in investigations of system variables and estimator variables that affect eyewitness memory. Journal of Applied Research in Memory and Cognition, 4(2), 93–102. https://doi.org/10.1016/j.jarmac.2015.01.003
- Mickes, L., Seale-Carlisle, T. M., Chen, X., & Boogert, S. (2022, March 9). pyWitness 1.0: A Python eyewitness identification analysis toolkit. https://doi.org/10.31234/osf.io/5ruks
- Moineddin, R., Matheson, F. I., & Glazier, R. H. (2007). A simulation study of sample size for multilevel logistic regression models. BMC Medical Research Methodology, 7(1), 1–10. https://doi.org/10.1186/1471-2288-7-34
- Nash, R. A., Hanczakowski, M., & Mazzoni, G. (2015). Eyewitness testimony. In International encyclopedia of the social & behavioral sciences (2nd ed., Vol. 8, pp. 642–649). Elsevier. https://doi.org/10.1016/B978-0-08-097086-8.51033-2
- Nguyen, T. B., & Pezdek, K. (2017). Memory for disguised same- and cross-race faces: The eyes have it. Visual Cognition, 25(7–8), 762–769. https://doi.org/10.1080/13506285.2017.1329762
- Nyman, T. J., Antfolk, J., Lampinen, J. M., Korkman, J., & Santtila, P. (2021). The effects of distance and age on the accuracy of estimating perpetrator gender, age, height, and weight by eyewitnesses. Psychology, Crime & Law, 27(3), 231–252. https://doi.org/10.1080/1068316X.2020.1798425
- Nyman, T. J., Antfolk, J., Lampinen, J. M., Tuomisto, M., Kaakinen, J. K., Korkman, J., & Santtila, P. (2019). A stab in the dark: The distance threshold of target identification in low light. Cogent Psychology, 6(1), 1–23. https://doi.org/10.1080/23311908.2019.1632047
- Nyman, T. J., Lampinen, J. M., Antfolk, J., Korkman, J., & Santtila, P. (2019). The distance threshold of reliable eyewitness identification. Law and Human Behavior, 43(6), 527–541. https://doi.org/10.1037/lhb0000342
- Paterson, H. M., Luppino, D., Calderwood, C., MacDougall, H. G., Taubert, J., & Kemp, R. I. (2017). Can training improve eyewitness identification? The effect of internal feature focus on memory for faces. Psychology, Crime & Law, 23(10), 927–945. https://doi.org/10.1080/1068316X.2017.1346099
- Pozzulo, J. D., & Balfour, J. (2006). Children’s and adults’ eyewitness identification accuracy when a culprit changes his appearance: Comparing simultaneous and elimination lineup procedures. Legal and Criminological Psychology, 11(1), 25–34. https://doi.org/10.1348/135532505X52626
- Pozzulo, J. D., & Lindsay, R. C. (1998). Identification accuracy of children versus adults: A meta-analysis. Law and Human Behavior, 22(5), 549–570. https://doi.org/10.1023/A:1025739514042
- R Core Team. (2016). R development core team. In R: A language and environment for statistical computing (Vol. 55, pp. 275–286). https://www.r-project.org/
- Rey-Mermet, A., & Gade, M. (2018). Inhibition in aging: What is preserved? What declines? A meta-analysis. Psychonomic Bulletin & Review, 25(5), 1695–1716. https://doi.org/10.3758/s13423-017-1384-7
- Ross, D. F., Pica, E., Pozzulo, J., Clark, M., Swanson, S., Warren, A. R., Metzger, R., Silver, C., & Sinclair, H. (2022). The impact of disguise on the identification of familiar faces. Journal of Police and Criminal Psychology, 38(2), 483–492. https://doi.org/10.1007/s11896-022-09552-4
- Rossion, B. (2013). The composite face illusion: A whole window into our understanding of holistic face perception. Visual Cognition, 21(2), 139–253. https://doi.org/10.1080/13506285.2013.772929
- Sauer, J. D., Brewer, N., & Wells, G. L. (2008). Is there a magical time boundary for diagnosing eyewitness identification accuracy in sequential line-ups? Legal and Criminological Psychology, 13(1), 123–135. https://doi.org/10.1348/135532506X159203
- Sauerland, M., Sagana, A., Sporer, S. L., & Wixted, J. T. (2018). Decision time and confidence predict choosers’ identification performance in photographic showups. PLoS ONE, 13(1), 1–12. https://doi.org/10.1371/journal.pone.0190416
- Sauerland, M., & Sporer, S. L. (2009). Fast and confident: Postdicting eyewitness identification accuracy in a field study. Journal of Experimental Psychology: Applied, 15(1), 46–62. https://doi.org/10.1037/a0014560
- Semmler, C., Dunn, J., Mickes, L., & Wixted, J. T. (2018). The role of estimator variables in eyewitness identification. Journal of Experimental Psychology: Applied, 24(3), 400–415. https://doi.org/10.1037/xap0000157
- Shakeshaft, N. G., & Plomin, R. (2015). Genetic specificity of face recognition. Proceedings of the National Academy of Sciences, 112(41), 12887–12892. https://doi.org/10.1073/pnas.1421881112
- Shapiro, P. N., & Penrod, S. (1986). Meta-analysis of facial identification studies. Psychological Bulletin, 100(2), 139–156. https://doi.org/10.1037/0033-2909.100.2.139
- Shing, Y. L., Werkle-Bergner, M., Brehmer, Y., Müller, V., Li, S. C., & Lindenberger, U. (2010). Episodic memory across the lifespan: The contributions of associative and strategic components. Neuroscience & Biobehavioral Reviews, 34(7), 1080–1091. https://doi.org/10.1016/j.neubiorev.2009.11.002
- Shing, Y. L., Werkle-Bergner, M., Li, S.-C., & Lindenberger, U. (2008). Associative and strategic components of episodic memory: A life-span dissociation. Journal of Experimental Psychology: General, 137(3), 495–513. https://doi.org/10.1037/0096-3445.137.3.495
- Singmann, E., Bolker, B., Westfall, J., Aust, F., & Ben-Shachar, M. S. (2019). afex: Analysis of Factorial Experiments. R package (version 0.25-1.).
- Smith, A. M., Wilford, M. M., Quigley-McBride, A., & Wells, G. L. (2019). Mistaken eyewitness identification rates increase when either witnessing or testing conditions get worse. Law and Human Behavior, 43(4), 358–368. https://doi.org/10.1037/lhb0000334
- Sporer, S. L., Penrod, S. D., Read, J. D., & Cutler, B. L. (1995). Choosing, confidence, and accuracy: A meta-analysis of the confidence-accuracy relation in eyewitness identification studies. Psychological Bulletin, 118(3), 315–327. http://psycnet.apa.org/index.cfm?fa=buy.optionToBuy&id=1996-07196-001.
- Thorley, C., Acton, B., Armstrong, J., Ford, S., & Gundry, M. (2022). Are estimates of faces’ ages less accurate when they wear sunglasses or face masks and do these disguises make it harder to later recognise the faces when undisguised? Cognitive Research: Principles and Implications, 7(1). https://doi.org/10.1186/s41235-022-00370-0
- Wagenaar, W. A., & Van Der Schrier, J. H. (1996). Face recognition as a function of distance and illumination: A practical tool for use in the courtroom. Psychology, Crime & Law, 2(4), 321–332. https://doi.org/10.1080/10683169608409787
- Weber, N., Brewer, N., Wells, G. L., Semmler, C., & Keast, A. (2004). Eyewitness identification accuracy and response latency: The unruly 10-12-second rule.. Journal of Experimental Psychology: Applied, 10(3), 139–147. https://doi.org/10.1037/1076-898X.10.3.139
- Wells, G. L. (1978). Applied eyewitness-testimony research: System variables and estimator variables. Journal of Personality and Social Psychology, 36(Issue 12), 1546–1557. https://doi.org/10.1037/0022-3514.36.12.1546
- Wells, G. L., Kovera, M. B., Douglass, A. B., Brewer, N., Meissner, C. A., & Wixted, J. T. (2020). Policy and procedure recommendations for the collection and preservation of eyewitness identification evidence. Law and Human Behavior, 44(1), 3–36. https://doi.org/10.1037/lhb0000359
- Wells, G. L., Memon, A., & Penrod, S. D. (2006). Eyewitness evidence improving: Its probative value. Psychological Science in the Public Interest, 7(2), 45–75. https://doi.org/10.1111/j.1529-1006.2006.00027.x
- Wells, G. L., Steblay, N. K., & Dysart, J. E. (2015). Double-blind photo lineups using actual eyewitnesses: An experimental test of a sequential versus simultaneous lineup procedure. Law and Human Behavior, 39(1), 1–14. https://doi.org/10.1037/lhb0000096
- Werner, N.-S., Kühnel, S., & Markowitsch, H. J. (2013). The neuroscience of face processing and identification in eyewitnesses and offenders. Frontiers in Behavioral Neuroscience, 7(December), 189. https://doi.org/10.3389/fnbeh.2013.00189
- Wickham, H. (2016). Ggplot2: Elegant graphics for data analysis. Springer-Verlag.
- Wixted, J. T., & Wells, G. L. (2017). The relationship between eyewitness confidence and identification accuracy: A new synthesis. Psychological Science in the Public Interest, 18(1), 10–65. https://doi.org/10.1177/1529100616686966
- Young, A. W. (1984). Right cerebral hemisphere superiority for recognizing the internal and external features of famous faces. British Journal of Psychology, 75(2), 161–169. https://doi.org/10.1111/j.2044-8295.1984.tb01887.x
- Young, A. W., & Burton, A. M. (2018). Are we face experts? Trends in Cognitive Sciences, 22(Issue 2), 100–110. https://doi.org/10.1016/j.tics.2017.11.007
