
ABSTRACT
Offenders with severe personality pathology are at significantly increased risk of serious and violent offending. In England and Wales, offenders who are likely to meet criteria for a diagnosis of personality disorder are managed within a network of ‘Offender Personality Disorder Pathway’ services. We conducted a retrospective cohort study over 6 years, using linked routine datasets, to examine the effectiveness of these services on male offenders (n = 28,321). We compared the outcomes of those who received a simple case formulation and had not been referred to Pathway services (the ‘Comparison group’), with a group of offenders who had received a complex case formulation and been referred to Pathway services (the ‘Treatment group’). Over time, significant improvements occurred in re-offending risk scores, and lower rates of behavioural disturbance among both Treatment and Comparison groups of offenders. However, no statistically significant differences were detected in the rates of improvement between Treatment and Comparison groups. Offending rates in both groups significantly increased over time, although there was no significant difference in the increase in offending rates between the Treatment and Comparison groups. Currently, there is no statistical evidence that the Pathway is associated with changes in offender behaviour.
Introduction
Within the criminal justice system (CJS), offenders with personality disorder (PD) are among the most challenging group of individuals to manage. Those with severe personality pathology are at increased risk of serious and violent offending (Coid et al., Citation2007) and over the past 20 years, policymakers have directed increasing attention to this group of offenders.
In 1999, the UK government outlined proposals to reduce the risk posed by people with ‘dangerous severe personality disorders’ (DSPD) (Health, Citation1999). The DSPD Programme aimed to provide assessment and treatment for offenders with severe personality disorder who posed a high risk of harm to other people. Yet from the outset, concerns were raised about the legitimacy of the DSPD Programme. Critics highlighted its considerable expense, the time individuals spent in assessment, the proliferation of non-evidence-based therapies, the overall lack of evidence for effectiveness (Barrett & Tyrer, Citation2012; Burns et al., Citation2011; Vollm & Konappa, Citation2012) as well as the lack of step-down facilities and clear avenues for progression (Perkins et al., Citation2015; Trebilcock & Weaver, Citation2012). Ultimately, it became apparent that the substantial funds required to support a small number of DSPD treatment places was difficult to justify. In 2009, an independent review recommended an inter-departmental strategy to support the more effective management of offenders with personality disorder in the CJS (The Bradley report: Lord Bradley’s review of people with mental health problems or learning disabilities in the criminal justice system, Citation2009). It was subsequently proposed that DSPD Programme funding might more effectively reduce risk and harm if re-directed to provide an active ‘pathway’ of interventions thereby reaching a larger population of offenders. Since 2011, under jointly commissioned arrangements termed the Offender Personality Disorder (OPD) Pathway, offenders with ‘personality disorder’ have become the shared responsibility of His Majesty’s Prison & Probation Service (HMPPS) and NHS England.
The Pathway comprises a network of services based in prisons, secure hospitals, Approved Premises and probation services in the community (Campbell & Craissati, Citation2018). Eligibility for the Pathway is based on three criteria: (1) risk as measured by sentence criteria, serious sexual or violent index offence and risk banding in the Offender Assessment System (OASys) (2) likelihood of a severe PD and (3) a ‘clinically justifiable link’ between the two (Joseph & Benefield, Citation2010). Antisocial PD has a well-established association with offending behaviour and this is the main category that would be present in offenders (Roberts & Coid, Citation2010). However, not all categories of PD are associated with criminal propensity. Furthermore, referral and acceptance onto the Pathway does not require a clinical diagnosis of PD and simply requires that the offender is likely to be diagnosed with a PD, as part of a screening assessment (described below). The rationale for including those likely to be diagnosed with a PD, (as opposed to those having a definitive diagnosis) is that it widens the focus from a small, dangerous group of personality-disordered offenders to a much larger population of offenders who are deemed to be high-risk offenders who also have personality difficulties. The theoretical justification for this approach is that both offending and the complex psychological problems seen in people with a likely personality disorder, are underpinned by similar adverse experiences (Skett & Lewis, Citation2019).
Central to the Pathway model is the premise that management should be psychologically informed and should focus on the relational context. A diverse range of interventions is provided within the Pathway, comprising PD-specific treatment interventions in prisons and secure care, including individual and group therapies; ‘Progression services’, designed to enable offenders to support transitions, prepare people for treatment and to maintain progress across custody; and accredited Offender Behaviour Programmes, appropriate for the treatment of personality disorder.
Case identification and case formulation (Minoudis & Shaw, Citation2018) are key elements of the Pathway and these are led by offender managers, working in collaboration with a psychologist. Case identification involves a screening process for personality disorder, and an assessment of risk.
The criteria for the identification of suitable offenders is that they must be sentenced offenders; aged 18 years and over; presenting a high or very high risk of serious harm to others at any point during their sentence and likely to have a severe personality disorder for which there is deemed to be a ‘clinically justifiable link’ with that individual’s risk. Offenders are selected for the Pathway through a screening process conducted by offender managers using the OASys assessment tool. OASys is the risk assessment and management system routinely used in the National Offender Management Service and provides an effective structure for risk assessment which is acceptable for offender managers to use (Howard & Dixon, Citation2012). The assessment of the presence of a ‘clinically justifiable link’ is made by the offender manager usually through a process of consultation with a forensic psychologist (Mawby et al., Citation2020). Guidance on screening is provided to offender managers as part of their training and is also codified in a practitioners’ guide (NHSE, Citation2020).
The development of a case formulation involves integrating diverse information about an offender to provide an understanding of their psychosocial and criminogenic need (Hart et al., Citation2011). There are three levels of formulation, designed to address increasing complexity. The most basic, level 1 formulations, attempt to organise the most relevant information and indicate patterns of behaviour. Level 2 formulations additionally take developmental history into account and produce a psychological explanation of problems. Level 3 formulations are for the most complex cases, factoring in how difficulties could be overcome and how to motivate the service user. Psychologists take the primary responsibility for these cases. If an individual already has a comprehensive sentence plan in place and there are no concerns related to current behaviour or progression, they are designated ‘ungraded formulations’ or ‘no formulation required’. Based on the formulation, the offender may be recommended to undertake offending behaviour programmes or be referred to a treatment or progression service.
Our team was independently commissioned to evaluate the OPD Pathway for men. We undertook a retrospective cohort study of offenders in the Pathway, using linked CJS datasets, to examine whether exposure to complex case formulation and specialist OPD services, was associated with a reduction in risk, offending and challenging behaviour.
Material and methods
Study design
We used a retrospective cohort study design to evaluate the effectiveness of the OPD Pathway. We considered outcome data for a duration of six years (from 3 years before to 3 years after referral to the Pathway). We defined the start of the study as 1st July 2012 as from this point forwards, data on offenders was sufficiently complete to be analysed. For a treatment and a comparison group (as defined below), we compared the pre-referral and post-referral to Pathway differences in reoffending and violence predictive scores; number of adjudications; number of recalls; number of self-harm occasions; and number of offences per participant that were observed.
Participants and databases
The sample consisted of male offenders who met the following eligibility criteria:
Aged over 18 years
At any point during their sentence, assessed as presenting a high likelihood of violent or sexual offence repetition AND as presenting a high or very high risk of serious harm to others
Likely to have a severe personality disorder
A clinically justifiable link was thought to exist between their personality disorder and their risk
The case was managed by HMPPS (formerly known as the National Probation Service).
We linked data from five CJS computerised databases:
National Delius (NDelius) – Probation Case Management System
Offender Assessment System (OASys)
Prison National Offender Management Information System (P-NOMIS)
Police National Computer (PNC)
Public Protection Unit Database (PPUD).
In addition, we were provided with a Treatment & Progression (T&P) dataset – a collation of manually completed excel sheets from services within the OPD Pathway. Together these datasets included information on the characteristics of the individuals in the Pathway, details about their Pathway eligibility criteria and contact with services; index offence and sentencing characteristics; offender risk scores, adjudications; self-harm in prison; and re-offences or breaches of probation licence following release from prison.
Data linking
All datasets except one (T&P) were extracted from computerised systems from different parts of the CJS, including probation (NDelius and OASys), prison (P-NOMIS), Home Office (Police National Computer) and Ministry of Justice (PPUD). There is no common identifier across the systems with each system having its own unique identifying number for individuals. Creating a global dataset from all the contributing datasets, would have involved multiple data links using different identifiers at each stage and, following exploratory work, was deemed unfeasible. Instead, we created three datasets, each limiting the number of identifiers used, but having the necessary combination of data to examine key outcomes. Further details of the linking process are provided in Supplementary Material (Appendix A). Data linking took place at HMPPs premises, with data only being transferred to the university research centre, following anonymisation.
Outcomes
We evaluated the effectiveness of the Pathway in terms of the following outcome variables:
Risk of re-offending
Number of adjudication events
Number of recall events
Number of non-violent, sexual and violent offences
Number of self-harm reports.
The OASys dataset provided the Offender Group Reconviction Scale (OGRS), the OASys General reoffending Predictor (OGP) and the OASys Violence Predictor (OVP) scores. OGRS represents the probability of reconviction, shown as a percentage, based on information in the OASys. The probability score represents the average reconviction rate from a group of offenders who match the individual offender on the factors used in the model (Howard et al., Citation2009). OGP reflects the likelihood of non-violent re-offence and OVP reflects the prediction of violent reoffending behaviour. By combining information on the offender’s static and dynamic risk factor profile, OGP and OVP scores are reported in the OASys summary sheet as either continuous (on a 0–100-point scale, with higher values indicating worse outcome) or ordered categorical scores (ranging from Low to Very High). In the analyses, we used the continuous version of OGP and OVP.
For the remaining outcomes, we counted the number of events an individual had within six years (from three years before to a maximum of three years after referral to the Pathway) from the respective datasets. We categorised offences into four categories: non-violent, sexual, violent and sexual & violent, based on the information contained within the PNC dataset, and analysed each category as a separate outcome. Non-violent offences included (i) theft (ii) drug offences (iii) miscellaneous crimes against society (iv) fraud (v) motoring offences and (vi) breach offences. Sexual offences included individuals who had committed sexual offences only. Violent offences included (i) violence against the person (ii) robbery (iii) criminal damage and arson (iv) possession of weapons and (v) public order offences.
The treatment and comparison groups
For the analyses, the treatment and comparison groups of offenders were defined as:
Comparison Group: those who had no recorded services, or who had received Case Consultation, Case Formulation Level one or an ungraded Case Formulation.
Treatment Group 1: individuals who had received Case Formulation Level 2 or 3, but who had not been referred to treatment or progression services. These offenders were subject to a detailed psychological formulation which led to the development of a psychologically informed sentence plan. This is not part of routine practice and would have subsequently led to offender management which was psychologically informed (hence their inclusion as part of a treatment group).
Treatment Group 2: individuals who received any of the above and/or have been referred to interventions in treatment or progression services.
For the analyses, we combined Treatment groups 1 and 2 (collectively termed ‘Treatment’ Group) and compared their outcomes with those of the Comparison Group.
Propensity score matching
We used propensity score matching (PSM) to reduce bias due to confounding. For each outcome and individual, we calculated propensity weights based on: age, ethnicity, time left to serve, screening override items, risk of serious harm (RoSH) Tier (Low, Medium, High, Very High), sentence type (Life, IPP, Determinate, Short Determinate, Community Sentence and Other), OGRS score 1 and, OGRS score 2. Age was fitted as a continuous variable after testing a categorical and a non-linear version of it.
For the analyses of OGP and OVP scores, baseline OGP and OVP scores were included in the model. Kernel matching was used to assign weights to non-treated individuals; these represent the number of times a non-treated individual was matched during the matching process. Kernel matching was selected for two reasons: to maximise the number of people in the analysis and because it proved to be the optimal matching strategy with our data. The analysis sample for each outcome variable included individuals with usable data of the respective outcome and the baseline covariates. After restricting our sample to offenders’ baseline values (one data record per offender), propensity scores were obtained using the predicted probability of a binary logistic regression with group indicator as the dependent variable. The kernel matching algorithm used a kernel half-width value of 0.06 for all primary analyses and 0.002 for some secondary analyses that used fewer data. All analyses used a bi-weight kernel function. The kernel function and the value of the kernel half-width were chosen after examining how various values and functions affected the quality of matching. We examined the quality of matching through standardised mean differences between the two groups for each covariate, before and after matching, and through graphical means of the distribution of the absolute standardised differences, comparing baseline covariates between treated and untreated; these indicated that the data were well balanced in terms of the overall covariate distribution (with a close to zero mean or median difference after matching).
Statistical analyses
All analyses were carried out using Stata version 15 (StataCorp, Citation2017). We analysed the continuous (OGP and OVP) outcomes using mixed-effects linear regression with two nested random intercepts at the offender’s level (offender cluster) and at a regional level (Local Delivery Unit (LDU) cluster), respectively. We estimated the effectiveness of the Pathway by comparing the before/after referral to the Pathway slope difference of the change in the outcome of the treatment group with that of the comparison group. This was modelled within the regression model via a three-way interaction between the Group variable, time (duration to and from referral to the Pathway in years) and a before/after referral to the Pathway binary indicator (see Supplementary material for further details of the statistical models). We restricted our sample to analyse only those values recorded within a maximum of three years before and after referral to the Pathway, as there were insufficient numbers after three years (<1% of data) and the numbers were not well balanced between the two groups outside that time range. We estimated the outcomes’ rates of change before and after referral for each group, using linear and non-linear combinations of model parameters. We checked the statistical assumptions associated with the models including normality of residuals and random effects and there were no obvious violations.
For count outcomes, we conducted analyses for offenders who had an event date and therefore sufficient information to enable us to construct the time periods required for our analyses. We examined the amount of data available both before and after referral to the Pathway to establish the length of exposure. For individuals still in prison, we considered a maximum of three-year exposure both before and after referral to the Pathway. For individuals who had left prison after referral to the Pathway, we allowed for a maximum exposure length of three years before referral, however, the length of post-referral exposure time was less than three years (depending on their release date). After adding up the individual incidence events within the exposure period, each offender had at most two count measures, one before or after referral, or before and after referral. Exposure length for the number of offences was four years (two years pre- and two years post-referral), as there were insufficient events beyond that period; the number of events was also not balanced between the two groups. The group effect was assessed via an interaction between the group and the binary before/after referral indicator. After checking for over-dispersion, we analysed all counts with a negative binomial regression, using robust standard errors at the regional level (LDU), except for the number of recalls, which were analysed with Poisson regression, since over-dispersion was not a serious concern.
All analyses were weighted by propensity weights and were based on available data; offenders with missing data in the outcome or the baseline covariates were excluded. To investigate any potential biases that exclusions due to missing data in the covariates might have caused, a series of sensitivity analyses were undertaken, where missing data in covariates were multiply imputed. All analyses used a 5% level to declare statistical significance. We present technical details of the statistical models in Appendix D.
Ethical approval and permissions
Approval to access and analyse the routine anonymised offender data was received from the NHS Research Ethics Committee (16/SE/0299), Health Research Authority and the HMPPS National Research Committee (reference: 204989).
Results
The analysis sample consisted of 28,321 offenders of whom 18,900 (66.7%) were in the comparison group and 9421 (33.3%) were in the treatment group. The mean age of the overall sample was 37.8 years (SD: 12.5) with little difference between the mean ages of the two groups. Offenders in the comparison group had a higher proportion of community service (9.4% vs. 6.4%) or determinate sentences (44% vs. 38%) compared to those in the treatment group, and treatment group offenders had a higher proportion of Life (15% vs. 12%) or IPP sentences (16% vs. 9%) than the comparison group. The mean length of time in years of recorded outcome following referral to the Pathway were: 10.5 months for recalls (s.d. 8.5 months), 12 months for PNC data (s.d. 9 months), 13 months for both adjudications and OASys data (s.d. 9 and 9.5 months respectively) and 14 months for self-harm data (s.d. 9.5 months).
OGP and OVP scores
The analysis model for OGP scores included 19,440 (Comparison n = 12,050, Treatment n = 7390) offenders. The average number of repeated measures per offender was 6.2 (min = 1, max = 35). Results from the linear mixed model analysis of the OGP scores are reported in and displayed in .
Figure 1. Plot of the linear mixed model results for OGP scores. Analysis included a total of n = 19,440 individuals, with data from 3 years before to 3 years after referral to the Pathway.
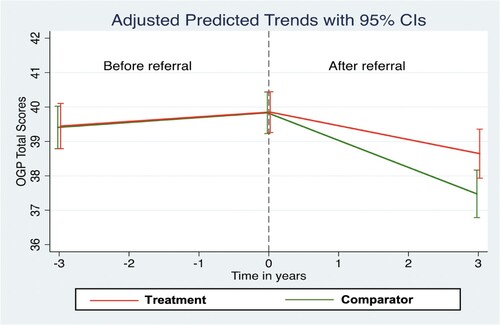
Table 1. Propensity weighted linear mixed model results for OGP scores. Analysis included a total of n = 19,440 individuals, with data from 3 years before to 3 years after referral to the Pathway.
OGP scores deteriorated (increased) slightly for both groups in the period before referral to the Pathway (Comparison slope = 0.142, Treatment slope = 0.135). This was not statistically significant for the Treatment group (p = 0.105). After referral to the Pathway, OGP scores for both groups significantly improved (Comparison slope = −0.786, p < 0.001; Treatment slope = −0.402, p < 0.001). The before/after difference in the slopes for both groups was statistically significant (Comparison slope = −0.927, p < 0.001, Treatment slope = −0.537, p < 0.001). The effectiveness of the OPD Pathway is represented by a 3-way interaction among the group indicator, the before/after indicator, and the time variable (the ‘difference of differences’ in ). For OGP scores, the effectiveness of the OPD Pathway (difference-of-differences) was 0.39 (95% CI: 0.054, 0.726, p = 0.023). After including the pre-Pathway difference in slopes between the groups, the Treatment group improved at a slower (by 0.39 OGP points per year) rate than the Comparison Group.
The model for OVP scores included 19,440 (Comparison n = 12,050, Treatment n = 7390) offenders and the average number of repeated measures per offender was 6.2 (min = 1, max = 35). Results from the linear mixed model analysis of OVP scores are reported in and .
Figure 2. Plot of the linear mixed model results for OVP scores. Analysis included a total of n = 19,440 individuals, with data from 3 years before to 3 years after referral to the Pathway.
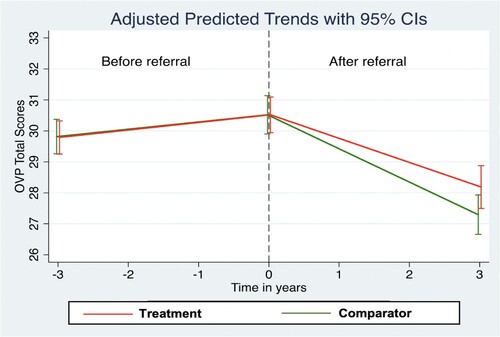
Table 2. Propensity weighted linear mixed model results for OVP scores. Analysis included a total of n = 19,440 individuals, with data from 3 years before to 3 years after referral to the Pathway.
OVP scores deteriorated (increased) slightly for both groups in the period before referral to the Pathway (Comparison slope = 0.234, p = 0.001; Treatment slope = 0.243, p = 0.001). After referral to the Pathway, OVP scores improved (declined) for both groups as indicated by the negative slopes (Comparison slope = −1.074, p < 0.001; Treatment slope = −0.777, p < 0.001), which were both statistically significant. The before/after difference in the slopes for both groups was also statistically significant (Comparison slope = −1.309, p < 0.001; Treatment slope = −1.020, p < 0.001). The effectiveness of the OPD Pathway (difference-of-differences) was found to be 0.29 and did not reach statistical significance at a 5% level (95% CI: −0.051, 0.627; p = 0.095).
Adjudications
The negative binomial regression model for the analysis of adjudications included 12,998 offenders (Comparison n = 7840, Treatment n = 5158). These numbers include individuals who had a recorded adjudication date only. In the pre-matched dataset, approximately 45%, 39% and 45% of the Comparison, Treatment group 1 and Treatment group 2 respectively had no recorded adjudication data. The modelling results are displayed in .
Table 3. Propensity weighted negative binomial regression for adjudication incidence counts. Analysis included a total of n = 12,998 individuals, with data from 3 years before to 3 years after referral to the Pathway.
The estimated adjudication incidence rate ratios (Comparison group after/before rate ratio = 0.818, Treatment group after/before rate ratio = 0.787) revealed that both groups had a lower rate of adjudication events after referral compared to the period before referral to the Pathway. This was statistically significant for both groups (p < 0.001). The estimated effectiveness of the Pathway (ratio of ratios) was 0.962 (95% CI: 0.896, 1.026; p = 0.252), indicating that the declining rates of adjudications did not differ statistically between the groups.
Recalls
The Poisson regression model for the analysis of recalls included 6,440 offenders (Comparison n = 3997, Treatment n = 2443). In the pre-matched dataset, approximately 68%, 64% and 70% of the Comparison, Treatment group 1 and Treatment group 2 respectively had no recorded recall data. The modelling results are displayed in .
Table 4. Propensity weighted Poisson regression for number of recalls. Analysis included a total of n = 6440 individuals, with data from 3 years before to 3 years after referral to the Pathway.
The estimated recall incidence rate ratios (Comparison group after/before rate ratio = 0.972, Treatment group after/before rate ratio = 0.991) revealed that both groups had a lower rate of recalls after referral compared to the period before referral to the Pathway. This was not however statistically significant for either group (Comparison p = 0.218, Treatment p = 0.746). The estimated effectiveness of the Pathway (ratio of ratios) was 1.019 (95% CI: 0.938, 1.099; p = 0.640) indicating that the declining rates of recalls did not differ statistically between the groups.
Self-harm
The negative binomial regression model for the analysis of the number of self-harm reports included 5513 offenders (Comparison n = 2991, Treatment n = 2522). In the pre-matched dataset, approximately 82%, 73% and 71% of the Comparison, Treatment group 1 and Treatment group 2, respectively, had no recorded self-harm event data. The modelling results and incident rates are displayed in and .
Figure 3. Plot of incidence rates from propensity weighted negative binomial model for number of self-harm reports. Analysis included a total of n = 5513 individuals, with data from 3 years before to 3 years after referral to the Pathway
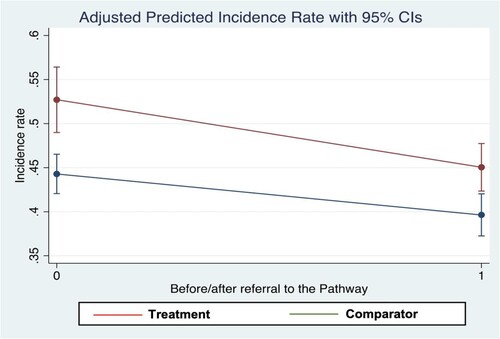
Table 5. Propensity weighted negative binomial regression for number of self-harm reports. Analysis included a total of n = 5513 individuals, with data from 3 years before referral to 3 years after referral to the Pathway.
The estimated self-harm incidence rate ratios (Comparison group after/before rate ratio = 0.895, Treatment group after/before rate ratio = 0.855) revealed that both groups have a lower rate of self-harm reports after referral to the Pathway compared to the period before. This was statistically significant for both groups (p < 0.001). The estimated effectiveness of the Pathway (ratio of ratios) was found to be 0.955 (95% CI: 0.867, 1.042; p = 0.326), indicating that the declining rates of self-harm did not differ statistically between the groups.
Offending
Due to power restrictions, the number of offences was assessed over four years (two years pre- and two years post-referral to the Pathway) and only individuals who had a proven re-offence had events captured in the dataset. In the pre-matched dataset, approximately 20%, 22% and 40% of the Comparison, Treatment group 1 and Treatment group 2, respectively, had no recorded proven re-offence data.
Non-violent offences
The sample for this analysis consisted of 448 offenders and the negative binomial regression model for the analysis of the number of non-violent offences included 402 offenders (comparison group n = 297, treatment group n = 105). The modelling results and incident rates are displayed in and .
Figure 4. Plot of incidence rates from propensity weighted negative binomial model for number of non-violent offences. Analysis included a total of n = 402 individuals, with data from 2 years before referral to 2 years after referral to the Pathway
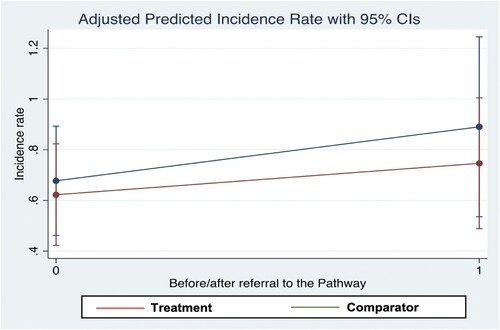
Table 6. Propensity weighted negative binomial regression for number of non-violent offences. Analysis included a total of n = 402 individuals, with data from 2 years before to 2 years after referral to the Pathway.
The estimated non-violent offence incidence rate ratios (Comparison group after/before rate ratio = 1.314, Treatment group after/before rate ratio = 1.199) indicated that both groups had a higher rate of non-violent offences after referral compared to the period before referral to the Pathway. This was however not statistically significant for either group (Comparison p = 0.203, Treatment p = 0.479). The estimated effectiveness of the Pathway (ratio of ratios) was found to be 0.912 (95% CI: 0.324, 1.5; p = 0.779), indicating that the rate of increase in non-violent offending did not differ statistically between the groups.
Sexual offences
The negative binomial regression model for the analysis of the number of sexual offences included 1359 offenders (Comparison n = 960, Treatment n = 399). The modelling results and incident rates are displayed in and .
Figure 5. Plot of incidence rates from propensity weighted negative binomial model for number of sexual offences. Analysis included a total of n = 1359 individuals, with data from 2 years before to 2 years after referral to the Pathway
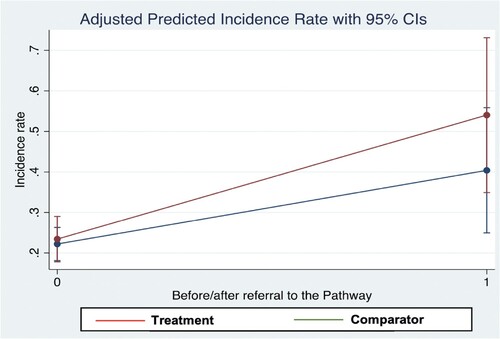
Table 7. Propensity weighted negative binomial regression for number of sexual offences. Analysis included a total of n = 1359 individuals, with data from 2 years before to 2 years after referral to the Pathway.
The estimated sexual offence incidence rate ratios (Comparison group after/before rate ratio = 1.819, Treatment group after/before rate ratio = 2.306) indicated that both groups had a higher rate of sexual offences after referral compared to the period before referral to the Pathway. This was statistically significant for both groups (Comparison p = 0.008, Treatment p < 0.001). However, the estimated effectiveness of the Pathway (ratio of ratios) was 1.268 (95% CI: 0.574, 1.962; p = 0.395), indicating that the rate of increase in sexual offending did not differ statistically between the groups.
Violent offences
The negative binomial regression model for the analysis of the number of violent offences included 10,977 offenders (Comparison group n = 6962, Treatment group n = 4015). The modelling results and incident rates are displayed in and .
Figure 6. Plot of incidence rates from propensity weighted negative binomial model for number of violent offences. Analysis included a total of n = 10,977 individuals, with data from 2 years before to 2 years after referral to the Pathway
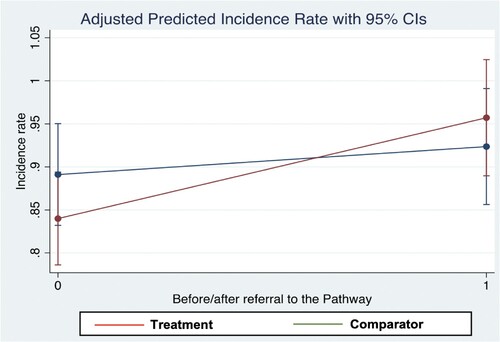
Table 8. Propensity weighted negative binomial regression for number of violent offences. Analysis included a total of n = 10,977 individuals, with data from 2 years before to 2 years after referral to the Pathway.
The estimated violent offence incidence rate ratios (Comparison group after/before rate ratio = 1.036, Treatment group after/before rate ratio = 1.139) indicated that both groups had a higher rate of violent offences after referral to the Pathway, compared to the period before referral. This was statistically significant for the Treatment group (p = 0.001), but not for the Comparison group (p = 0.362). The estimated effectiveness of the Pathway (ratio of ratios) was 1.099 (95% CI: 0.988, 1.210; p = 0.066), indicating that the rate of increase in violent offending did not differ statistically between the groups.
Sexual and violent offences
and present data on the incidents of combined sexual and violent offences in the analytic sample.
Figure 7. Plot of incidence rates from propensity weighted negative binomial model for number of sexual and violent offences. Analysis included a total of n = 3468 individuals, with data from 2 years before to 2 years after referral to the Pathway.
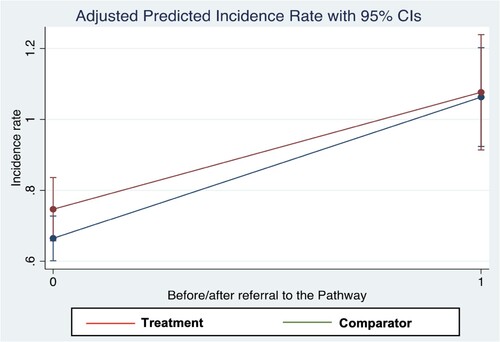
Table 9. Propensity weighted negative binomial regression for number of sexual and violent offences. Analysis included a total of n = 3478 individuals, with data from 2 years before to 2 years after referral to the Pathway.
The estimated sexual and violent offence incidence rate ratios (Comparison group after/before rate ratio = 1.599, Treatment group after/before rate ratio = 1.441) indicated that both groups had a higher rate of sexual and violent offences after referral compared to the period before referral to the Pathway. This was statistically significant for both groups (p < 0.001). The estimated effectiveness of the Pathway was found to be 0.901 (95% CI: 0.728, 1.074; p = 0.289) indicating that the rate of increase in sexual and violent offending did not differ statistically between the groups.
Sensitivity analyses
The results from the multiple imputations generated a similar pattern of results to those from the main analyses (see Supplementary Materials, Appendix E). The only exceptions to this were results for the OVP and violent offences outcomes, which showed a statistically significant difference (in the same direction as that of the main analysis) between the Comparison and Treatment Groups in terms of Pathway effectiveness.
Discussion
The OPD Pathway is unique and no comparable service arrangement for offenders exists in any other country in the world. Offenders with personality disorder are extremely challenging to manage and through the provision of complex case formulation and psychologically-informed management delivered by Pathway services, ultimately, the hope is that this will lead to important changes in offender behaviour. Funding for the OPD Pathway derived from the de-commissioning of the Dangerous and Severe Personality Programme (DSPD) and while the DPSD programme was only established in a small number of high-security prisons and hospital institutions, OPD Pathway services have been established across a much wider variety of settings, reaching many more offenders. By June 2016, over a third of the National Probation Service caseload had met eligibility for the Pathway (Skett et al., Citation2017).
This study is the largest evaluation of the Pathway to date, and to our knowledge, it also represents the largest ever longitudinal study of offenders with personality dysfunction. Three over-arching findings emerge from our study. First, in terms of the risk of future reoffending, both comparison and treatment groups improved after referral into the Pathway and for the OGP outcome, the comparison group improved faster than the treatment group. Although the between-group difference in this domain was statistically significant, the absolute difference was very slight (0.39 OGP points per year) and considering the theoretical range of the OGP score (0–100), this is a very small effect. Second, both treatment and comparison groups had statistically significantly lower rates of adjudications, recalls and self-harm after referral to the Pathway, compared to the period before referral. However, in each of these domains, there was no significant difference in the rate of improvement between groups and therefore no apparent effect on these domains of being managed by Pathway services. Thirdly, both treatment and comparison groups had statistically significantly higher rates of violent and sexual offending after referral compared to the period before referral to the Pathway, but there was no statistical difference in the change in rates between the two groups. Findings from our sensitivity analyses were broadly the same as those obtained from the main analyses.
The improvements in risk, adjudications, recalls and self-harm that we detected in both groups of offenders may reflect factors unrelated to the receipt of any specific Pathway interventions. Both groups were screened into the Pathway by offender managers who may then have paid greater attention to the offenders’ needs – needs which might otherwise have not been detected had they not been screened. In addition, selection bias may have resulted in offenders being screened into the Pathway who were more motivated to change their behaviour irrespective of whether they were subsequently referred on to a treatment or progression service. Although we detected an increase in offending after referral to the Pathway in both groups of offenders, we caution against interpreting this as indicative of failure. Offenders who are in the Pathway may be subjected to greater scrutiny and therefore, any new criminal acts may have been more likely to have been detected and prosecuted. It is also possible that the increase in violent and sexual offending rates reflects the wider national trend of increasing rates of assaults across the entire prison estate since 2013 (Safety in Custody Statistics, England and Wales: Deaths in Prison Custody to March, Citation2018 Assaults and Self-harm to December Citation2017, Citation2018).
In terms of strengths, we extracted data on thousands of offenders from five CJS computerised databases to assess the effectiveness of the operation of Pathway services. We included a comparison group to assess what might have happened if treatment within Pathway services had not been in operation. Although we were unable to randomise offenders to the Treatment Groups, we attempted to address the problem of confounding using propensity score matching. We balanced the data on key covariates related to risk and re-offending, including age, ethnicity, time left to serve, screening override items, risk of serious harm, sentence type and OGRS scores. Furthermore, for each of our five datasets, the distribution of absolute standardised differences indicated that propensity-weighted data were well balanced in terms of the overall covariate distribution. Finally, to investigate any potential biases that exclusions due to missing data in the covariates might have caused, we conducted a series of multiple imputations.
The study also has limitations. We do not know whether those who screened positively for the Pathway systematically differed from those who screened negative and we were unable to establish the total size of the population that was screened. The process that identifies offenders for the Pathway involves an initial screening of the relevant OASyS questions in conjunction with a discussion between offender managers and clinicians. However, the screening process is not standardised and it is possible that some non-eligible offenders were incorrectly referred into the programme, introducing possible bias in our assessment of effectiveness. The programme of OPD Pathway interventions were rolled out in a staggered manner due to resource constraints. The sizes of the intervention and comparison groups in our analysis therefore reflect the numbers who had received and who were waiting to receive the intervention respectively at the time of the evaluation. In addition, the routine sources of data did not allow us to assess the type or amount of treatment received by offenders. There was a large amount of missing data and we had to drop substantial proportions of offenders from each analysis sample. One of the limitations of using administrative data is that the non-occurrence of an adverse event goes unrecorded. Missing records at follow-up could indicate a positive change causing biases not redeemable by multiple imputation, since the data would be missing not at random. Although we captured six years of follow-up for a minority of offenders, others were followed for considerably shorter periods. In addition, our analyses did not account for the effects of substance misuse, depression and anxiety, or the presence of psychopathic personality traits, all of which are likely to be prevalent in the sample and are also related to recidivism (Bonta et al., Citation1998; Hare et al., Citation2000). Finally, our self-harm analyses only relate to changes in behaviour within prisons.
Some specific methodological issues need to be considered regarding the offending findings. First, the PNC database underestimates the true rate of offending because it only records offences that are recorded by the police. Therefore, our findings are likely to underestimate the true rates of offending in both groups. Second, administrative delays can occur between the times of conviction to an entry being made on PNC, thus impairing our ability to detect any contemporaneous differences in offending rates between the two groups. Third, we were provided with PNC data up to December 2016 but not beyond and for some individuals, their PNC follow-up period was considerably shorter than the 6 years we hoped to achieve. This limited our ability to detect differences between the two groups.
The OPD Pathway Programme has created services for a much larger population of offenders than was possible under its predecessor, the DSPD Programme. There is little doubt that the OPD Pathway represents a substantial commitment of resource, particularly in comparison to that available to an offender that does not meet criteria for the Pathway. Given that there was no difference in outcomes between groups, and reoffending increased in both groups, we think that a full economic evaluation of the Pathway is warranted. Although we were unable to detect a clear signal of Pathway effectiveness, our evaluation took place at a time of considerable CJS change within England and Wales (Phillips et al., Citation2016; Transforming Rehabilitation. Report by the Controller and Auditor General, Citation2016). It is possible that, over time, as the Pathway becomes more embedded within the CJS, clearer benefits become apparent. Yet, fully investigating the impact of this network of services on offenders’ health and behaviour requires the optimisation of routine data, as well as longer periods of follow-up.
Supplemental Material
Download MS Word (119.1 KB)Acknowledgements
We are grateful to staff at the Ministry of Justice for their support throughout the study.
Disclosure statement
CC and JW provide clinical input to groups of offenders being managed by services within the OPD pathway. The remaining authors report no conflicts of interest.
Data availability statement
The use of Ministry of Justice data was addressed by a time limited Data Sharing Agreement between the Ministry of Justice and Kings College London. Due to the sensitive nature of the research (high risk, high harm offending data), and due to legal restrictions, supporting data are not available.
Additional information
Funding
References
- Barrett, B., & Tyrer, P. (2012). The cost-effectiveness of the dangerous and severe personality disorder programme. Criminal Behaviour and Mental Health, 22(3), 202–209. https://doi.org/10.1002/cbm.1829
- Bonta, J., Law, M., & Hanson, K. (1998). The prediction of criminal and violent recidivism among mentally disordered offenders: A meta-analysis. Psychological Bulletin, 123(2). https://doi.org/10.1037/0033-2909.123.2.123
- Burns, T., Yiend, J., Fahy, T., Fitzpatrick, R., Rogers, R., Fazel, S., & Sinclair, J. (2011). Treatments for dangerous severe personality disorder (DSPD). Journal of Forensic Psychiatry & Psychology, 22(3), 411–426. https://doi.org/10.1080/14789949.2011.577439. Retrieved from <Go to ISI>://WOS:000299837400006.
- Campbell, C., & Craissati, J. (2018). Introduction. In C. Campbell & J. Craissati (Eds.), Managing personality disordered offenders: A pathways approach (pp. 1–26). Oxford University Press.
- Coid, J., Yang, M., Ullrich, S., Zhang, T., Roberts, A., Roberts, C., … Farrington, D. P. (2007). Predicting and understanding risk of re-offending: The prisoner cohort study. Research Summary 6. London.
- Hare, R. D., Clark, D., Grann, M., & Thornton, D. (2000). Psychopathy and the predictive validity of the PCL-R: An international perspective. Behavioral Sciences & the Law, 18(5), 623–645. Retrieved from PM:11113965. https://doi.org/10.1002/1099-0798(200010)18:5<623::AID-BSL409>3.0.CO;2-W
- Hart, S., Sturmey, P., Logan, C., & McMurran, M. (2011). Forensic case formulation. International Journal of Forensic Mental Health, 10(2), 118–126. https://doi.org/10.1080/14999013.2011.577137
- Health, H. O. a. D. o. (1999). Managing dangerous people with severe personality disorder. Home Office and Department of Health.
- Howard, P., Francis, B., Soothill, K., & Humphreys, L. (2009). OGRS 3: The revised offender group reconviction scale. Crown Copyright. https://core.ac.uk/download/pdf/1556521.pdf
- Howard, P. D., & Dixon, L. (2012). The construction and validation of the OASys violence predictor: Advancing violence risk assessment in the English and Welsh correctional services. Criminal Justice and Behavior, 39(3), 287–307. https://doi.org/10.1177/0093854811431239
- Joseph, N., & Benefield, N. (2010). The development of an offender personality disorder strategy. Mental Health Review Journal, 15(4), 10–15. https://doi.org/10.5042/mhrj.2010.0731
- Mawby, Z., Newman, A., & Wilkinson-Tough, M. (2020). Offender personality disorder pathway screening tools evaluation. The Journal of Forensic Practice, 22(3), 199–211. https://doi.org/10.1108/JFP-09-2019-0043
- Minoudis, P., & Shaw, J. (2018). Case identification and formulation. In C. Campbell & J. Craissati (Eds.), Managing personality disordered offenders: A pathways approach (pp. 55–82). Oxford University Press.
- NHSE, H. (2020). Practitioner guide: Working with people in the criminal justice system showing personality difficulties. https://assets.publishing.service.gov.uk/government/uploads/system/uploads/attachment_data/file/1035881/6.5151_HMPPS_Working_with_Offenders_with_Personality_Disorder_accessible_version_.pdf
- Perkins, D., Romero, J., & Ebrahimjee, A. (2015). DSPD ten years on at Broadmoor. Prison Service Journal, 218, 10–16.
- Phillips, J., Westaby, C., & Fowler, A. (2016). ‘Its relentless’: The impact of working primarily with high-risk offenders. Probation Journal, 63(2), 182–192. https://doi.org/10.1177/0264550516648399
- Roberts, A. D. L., & Coid, J. W. (2010). Personality disorder and offending behaviour: Findings from the national survey of male prisoners in England and Wales. The Journal of Forensic Psychiatry & Psychology, 21(2), 221–237. https://doi.org/10.1080/14789940903303811
- Safety in Custody Statistics, England and Wales: Deaths in Prison Custody to March 2018 Assaults and Self-harm to December 2017. (2018). London.
- Skett, S., Goode, I., & Barton, S. (2017). A joint NHS and NOMS offender personality disorder pathway strategy: A perspective from 5years of operation. Criminal Behaviour and Mental Health: CBMH, 27(3), 214–221. https://doi.org/10.1002/cbm.2026. <Go to ISI>://MEDLINE:28677907
- Skett, S., & Lewis, C. (2019). Development of the offender personality disorder pathway: A summary of the underpinning evidence. Probation Journal, 66(2), 167–180. https://doi.org/10.1177/0264550519832370
- StataCorp. (2017). Stata Statistical Software: Release 15: College Station, TX: StataCorp LLC.
- The Bradley report: Lord Bradley’s review of people with mental health problems or learning disabilities in the criminal justice system. (2009). London: D. o. Health.
- Transforming Rehabilitation. Report by the Controller and Auditor General. (2016).
- Trebilcock, J., & Weaver, T. (2012). ‘Everybody knows the prisoner is going nowhere’: parole board (PB) members’ views about the conduct and outcome of PB reviews with dangerous and severe personality disorder prisoners. International Journal of Criminology & Sociology, 1, 141–150. https://doi.org/10.6000/1929-4409.2012.01.14
- Vollm, B., & Konappa, N. (2012). The dangerous and severe personality disorder experiment–review of empirical research. Criminal Behaviour and Mental Health, 22(3), 165–180. https://doi.org/10.1002/cbm.1833. PM:22711613
