Abstract
So that students can acquire a conceptual understanding of basic statistical concepts, the orientation of the introductory statistics course must change from a lecture-and-listen format to one that engages students in active learning. This is the premise underlying an effort of the authors to produce and use a collection of hands-on activities that illustrate the basic concepts of statistics covered in most introductory college courses. Such activities promote the teaching of statistics more as an experimental science and less as a traditional course in mathematics. An activity-based approach enhances learning by improving the students' attention, motivation, and understanding. This paper presents examples of the types of activities that work well in various classroom settings along with comments from colleagues and students on their effectiveness.
1. What Does an Activity-Based Lesson Look Like?: Cents and the Central Limit Theorem
1 Ms. Jones walks into the room and asks her introductory statistics students, “Did you bring your 25 pennies today? Let's start making a histogram of their dates here on the floor.” Each student has collected 25 pennies over the past few days. The students come to place the pennies in groups above a number line on the floor, according to the years in which the pennies were minted. This creates a histogram on the floor that looks something like .
Figure 1. Dates of Pennies (19 suppressed)
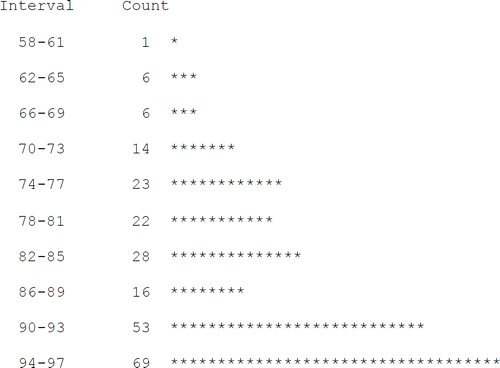
2 As the histogram is created, Ms. Jones enters the data into a computer (or calculator). She asks the class to estimate the mean and standard deviation of the distribution, which is a bit difficult because the distribution is strongly skewed to the left. She then uses the computer to find the values of the population mean, mu, and standard deviation, sigma.
3 Now Ms. Jones says, “Suppose we took random samples of size n = 5 and found the average age within each sample. What would happen?” She walks onto the pennies and starts to shuffle and slide her feet, destroying the histogram and creating a big pile of pennies. After mixing the pile thoroughly, she invites the students to come up and take samples of five pennies each. Each student randomly selects five pennies from the pile and calculates the average date of those five. Ms. Jones tells them to take a nickel from a stack of nickels she has put on the table and place it above the number line at the date that corresponds to the average they got for their sample. As the students do this, Ms. Jones enters these data into the computer.
4 The nickel histogram looks something like . The class estimates the mean and standard deviation of the dates. Ms. Jones finds the actual mean and standard deviation on the computer and points out that the mean is close to the population mean, but the standard deviation is smaller than the population standard deviation of the original values.
Figure 2. Average Dates of Five Pennies
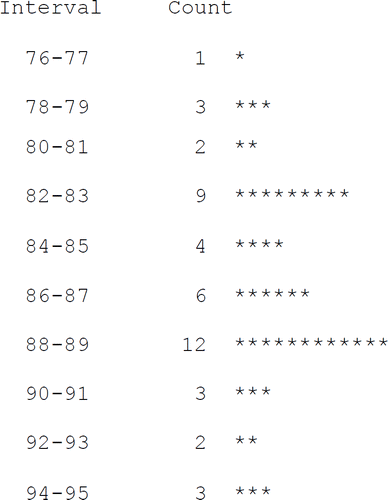
5 The students return their pennies to the pile, which is remixed. Then they take samples of n = 10 each and find the average date for those 10. This time they use dimes to represent their sample averages as they create a new histogram above the nickel histogram on the floor. Ms. Jones finds the mean and standard deviation of the dime histogram using the computer. In the final part of the activity the students take samples of n = 25 and make a histogram using quarters. The class can now compare the three histograms on the floor and can use the computer to compare these to the original penny histogram. Ms. Jones points out that the nickel, dime, and quarter histograms are all centered at about the population mean, that the standard deviation not only gets smaller as n increases, but that it is roughly equal to the theoretical value of sigma/sqrt(n), and that the quarter histogram looks pretty much like a bell-shaped curve, even though the original penny histogram was far from normal. As the semester unfolds, Ms. Jones will often refer back to these histograms when she makes use of the central limit theorem.
6 As homework, Ms. Jones asks the students to answer the following questions.
What can you say about the shape of the histogram as n increases? What can you say about the center of the histogram as n increases? What can you say about the spread of the histogram as n increases?
The distributions you constructed for samples of size 1, 5, 10, and 25 are called sampling distributions of the sample mean. Sketch the sampling distribution of the sample mean for samples of size 36.
7 This scenario parallels the way several of us present an introduction to the idea of sampling distributions for means. Other teachers have tried similar forms of the activity with equal success, as attested to by the following comments.
The students indicated they really felt they understood what the CLT (central limit theorem) was all about after this demonstration. The non-normality of the original population helped greatly to convey the meaning of the CLT.
The students enjoyed working with the pennies so much that they wouldn't leave the room when the class ended.
Excellent idea to show the CLT in action using a non-normal population generated by the students.
2. Activity-Based Statistics is Not a New Idea
8 “How can I get students to see this important concept?” Statistics teachers, including the authors of this paper, have repeated this phrase, or a variation on it, often over the years, but few answers have been forthcoming. We decided that experienced teachers of the subject must have at least a few answers. Over the last few years, then, we have been collecting their activities for illustrating the concepts covered in most introductory college courses. This work formed the basis of an NSF-funded project entitled Activity-Based Statistics that led to a book by the same name (CitationScheaffer, Gnanadesikan, Watkins, and Witmer 1996).
9 We first decided to see if leaders in the development of applied statistics had anything to offer. After all, many of them have been successful at explaining statistics to scientists and engineers who work in business and industry. These leaders did have some very good ideas. William Cochran had his famous box of rocks sitting by the coffee pot in the lounge. He would ask any taker to estimate the average weight of the rocks in the box, by any method they wanted to use, and then bet the price of the next cup of coffee that he could come closer to the truth by using the mean of a random sample of rocks. It is reported that Professor Cochran paid for very few cups of coffee. Geoffrey Jowett, in a speech given at the Third International Conference on Teaching Statistics, told of getting students actively involved with experiments as early as the 1940's. [See CitationJowett and Davies (1960).] One favorite activity involved making a small slingshot to propel a coin across a table, with the response measure being distance from a target. Multiple factors on the slingshot could be adjusted by the user. In his speech Professor Jowett remarked, “A statistics course at a university should have as many laboratory hours as physics or chemistry.” Frederick Mosteller had students toss thumb tacks to estimate the probability of a tack landing point up, among many other activities that he used successfully.
10 These master teachers and great statisticians had success with hands-on activities that got people involved with statistical principles. What they observed has been borne out by recent research into the learning of statistics: activities work. CitationGarfield (1995) reviewed numerous research studies. She found that this research suggests the following ways to help students learn statistics.
Activity-based courses and use of small groups appear to help students overcome some misconceptions of probability and enhance student learning of statistics concepts.
When students are tested and provided feedback on their misconceptions, followed by corrective activities (where students are encouraged to explain solutions, guess answers before computing them, and look back at their answers to determine if they make sense), this ‘corrective-feedback’ strategy appears to help students overcome their misconceptions.
Students' ideas about the likelihood of samples are improved by having them make predictions before gathering data to solve probability problems, then comparing the experimental results with their original predictions.
Use of computer simulations appears to lead students to give more correct answers to a variety of probability problems.
Using software that allows students to visualize and interact with data appears to improve students' understanding of random phenomena and their learning of data analysis.
11 Garfield's recommendations have an active learning emphasis. Most students learn statistics and probability best by active construction of their own knowledge. As Garfield writes, “Regardless of how clearly a teacher or book tells them something, students will understand the material only after they have constructed their own meaning for what they are learning. Moreover, ignoring, dismissing, or merely ‘disproving’ the students' current ideas will leave them intact – and they will outlast the thin veneer of course content” (1995, p. 30). 12 Similar conclusions were drawn recently by a statistician who teaches in industry. CitationBradstreet (1996, p. 73) writes, “Learning is situated in activity.” Bradstreet's article also contains many references to recent studies on how students learn statistics. 13 An excellent review of the literature on teaching statistics is found in the recent article by Betsy Jane Becker (CitationBecker 1996). One of the topic categories listed is “activities,” and numerous references are supplied for this category. The references here tend to be quite recent, indicating that this topic is only now coming into play as a major component of teaching statistics. 14 We searched for good teachers of statistics in order to collect their best activities for illustrating the concepts covered in most introductory courses. Over the years of this project many two- and four-year college, university, and secondary school teachers responded to our appeal. It was quickly observed, however, that not all ideas worked for all teachers and time would have to be spent on deciding which activities work in a variety of settings and how to use them effectively.
3. Basic Concepts and Typical Activities
15 We found that teachers have designed activities for all major topics covered in introductory courses, including data analysis, random behavior and sampling distributions, design of sample surveys and experiments, estimation, hypothesis testing, and modeling. In this section, we will outline the kinds of activities that teachers have been using and where they fit into the standard syllabus of the introductory statistics course. 16 A suggested opening activity involves collecting data on the students using a questionnaire designed with considerable input from the students themselves. This serves the purpose of focusing attention on real data early in the course, on exploratory data analysis, and on issues concerning measurement. Since the data are relevant to the students and they are interested in the conclusions reached, this activity emphasizes that statistics helps us deal with real data in real situations. 17 Statistical ideas begin with data, but data should be collected so they will be useful in making decisions or conjectures. Relating data collection and analysis to the solving of a real problem, much as is done in statistical process improvement, allows exploratory techniques to be used extensively, but with a purpose in mind. Measuring the width of desks in the classroom or the diameter of a tennis ball quite naturally leads to the issues of measurement error and the usefulness of the mean as a summary. Measuring head circumferences to establish hat sizes for the class shows that measurement error is not always the main source of variability and that the mean is not always a useful summary. 18 Random behavior is fundamental to the decision-making process of statistics, but is a difficult topic for students to grasp. Thus, a number of activities should concentrate on developing an understanding of randomness, without going into the mathematical formalities of classical probability distributions. One activity has students attempting to predict the next color of bead to be drawn from a bead box based on the the pattern generated by past selections. In the activity, students learn that the long-run pattern of random events could look quite different from the pattern generated over the short run. Another looks at various uses (correct and incorrect) of the law of large numbers found in the media; e.g., the baseball player is “due” for a hit. Since the coverage of probability is highly variable from course to course, activities on randomness are designed to be completed with a minimum of formal probability. 19 Activities should address some basic probability concepts such as the definition of probability, independence, probability distributions, and the general concept of randomness. A simple activity on tossing thumb tacks (the Mosteller influence) focuses on the long run behavior of the outcome of an experiment, demonstrating that relative frequencies converge to different values depending on the way tacks are tossed, one at a time (independently) or several of them together (dependently). Exploratory analysis of categorical data in two-way frequency tables leads to the notion of conditional probability and how such conditional distributions are used to indicate possible association between two variables. 20 Sampling, such as in the ubiquitous opinion poll, is the most common application of planned data collection in the “real” world and in the classroom. This topic allows the early introduction of the idea of random sampling and its implications for statistical inference. Thus, it serves as an excellent bridge between probability and inference. The difficulty and importance of collecting data that fairly represent a population are emphasized. Opinion polls conducted by the students outside of class are a good way to introduce projects that are conceptually simple yet illustrate all the important aspects of a statistical investigation. In addition, there are many such polls in the media that can be critiqued for statistical validity. 21 Sampling and sampling distributions, which form the basis of statistical inference, are emphasized in a number of activities. An activity on random rectangles is used to illustrate the importance of randomization in reducing sampling bias and to provide a vivid example of the central limit theorem. Here, the task is to sample a few rectangles from a sheet of 100 rectangles of various sizes with a goal of estimating the average area of the rectangles on the page. (Yes, this is motivated by Professor Cochran's box of rocks.) Thus, it can be used as a starting point for a discussion of sampling bias, sampling errors, and margin of error. Simulation is key to this process of understanding sampling distributions, as this allows many such distributions to be generated quickly. Statistics, such as sample proportions and means, that generate normal sampling distributions should be studied in comparison to statistics, such as the maximum, that generate non-normal sampling distributions. 22 Estimation and hypothesis testing frame the basic approach to inference in most courses, and numerous activities deal with the conceptual understanding of the reasoning process used here. Again, simulation plays a key role as concepts of sampling error, confidence interval, and p-value are introduced without appeal to formulas. 23 An alternate approach to teaching the basic concepts of confidence intervals is considered in which a series of sampling distributions of sample proportions is generated for different population proportions. When these sampling distributions are set side by side, it is clear which populations could have generated the particular sample proportion that a student has in hand. A discussion of statistical inference is not complete without the underlying logic in a test of hypothesis. A collection of short activities, such as spinning coins and tossing unbalanced dice, conveys these concepts quite simply, unencumbered by statistical jargon and mathematical notation. Their goal is to show how a hypothesis is rejected upon observing data that are unlikely to occur when the hypothesis is true. 24 Experiments are the second most common application for planned data collection. Although the first course in statistics often does not include analysis of a designed experiment, this project includes a few activities that involve students in conducting actual experiments to determine which treatment gives the “best” results. Both “Jumping Frogs,” a paper-folding experiment, and “Gummy Bears in Space,” a catapult experiment, involve factorial experiments where students must make decisions on which factors and levels might produce an optimal result. The activities do not use a formal approach but instead analyze the generated data with exploratory techniques, estimating main effects and interactions both numerically and graphically. 25 Modeling the relationship between two variables, especially through the use of least squares regression, is widely used throughout statistics and should be part of an introductory course. The most interesting examples for students are based on data they collect either through direct measurement or through looking up archived data. Examples involving relationships among sizes (arm span relative to height of humans, for example) are of the former type and those involving trends over time (global warming issues, for example) are of the latter. Here, technology is required in order to use time efficiently. 26 Since most students have a vague idea about what a correlation coefficient measures and the variability of the sample correlation coefficient, correlation is singled out for special study. One activity requires students to simulate correlation coefficients for large and small samples, and for different values of the true population correlation coefficients. Graphical analysis of the simulated values helps to build insight into the behavior of this measure and, in particular, to show how small, independent samples can still generate rather large variation in the values of the sample correlation coefficients. 27 Activities should have the flexibility to be used for class demonstration, group work in class, take-home assignments, or long-term projects. In whatever setting they are used, the activities should actively engage the students so that they become true participants in the teaching-learning process.
4. Enthusiasm and Cautions from Teachers and Students
28 While there is considerable dialogue among educators on engaging students through active learning, there is little documentation as to implementation of this approach. The material collected and developed by the authors was field tested in a study directed by Mary E. Huba of Iowa State University. Over 25 statistics teachers and hundreds of their students participated in the field test. Some comments from the field study participants are summarized below. 29 Professor Huba visited one of the field test sites, that of Mary Sullivan of Curry College, to obtain a comprehensive view of the effectiveness of the activities in a classroom setting. Her report on this visit includes the following.
Mary is eager to use activities, not only because they make the content to be covered concrete for students, but also because the variety of types of activities accommodate different learning styles in her classroom. Further, even though a given activity may match up best with students who have a particular approach to processing information, Mary can use the context in which the activity is set to involve students of other styles. As she observes students participating in or completing activities, she can identify those who are struggling and gain insights about what they find difficult.
The activities create for students learning environments that are very different from what they are used to, different from the “recipe” approach used by some instructors. Mary believes that students are engaged in the activities for the most part, and they acknowledge and enjoy the fact that she tries to involve them.
Finally, Mary likes activities that require in-class collection of data that does not always “work” perfectly to illustrate the point of the lesson. She feels that this provides her with an opportunity to model the process of exploring and getting a feel for the data. Students may not develop the confidence to “muck in the data,” she says, if they have not seen the instructor do it.
30 Though less detailed, comments from other field testers can be grouped broadly into categories: (1) activities help make concepts concrete; (2) activities engage students in the learning process; and (3) activities involving in-class collection and use of data provide a realism lacking in textbook presentations. Here are some quotes from other field testers in relation to the three categories. On making concepts concrete
Using the questionnaire aided tremendously in helping the students understand the types of questions to ask and not to ask as well as the importance of wording. They were able to relate to their own responses and how one might interpret questions differently.
The students thought I was crazy to have them bring in a grocery bill but this activity helped many of them to begin to understand the idea of a random variable and expected value. They came up with good ways to make the rounding better.
The tack activity (tossing tacks to estimate the probability of one landing point up) is an excellent way to promote understanding of independence in binomial trials and the relative frequency approach to probability.
On engaging students
The string was a hit (estimating the length of a piece of string). I let the students enter the data into Minitab and obtain descriptive statistics as well as graphic displays. Before doing this, I had them predict the shape of the distributions and their predictions were wrong (as I expected) but once explanations were offered … I believe the students began to catch on to how symmetry and skewness result.
My enjoyment of teaching statistics from an activity based framework continues to grow and students seem to enjoy it too.
They appreciate the clever use of the Pepperidge Farm Gold Fish (I use cheese for the regular fish and pizza for the tagged fish) and the use of the plastic bag for “Lake Median.”
The students responded well to the data collection exercises and liked analyzing their own data.
They enjoyed designing the questionnaire more than actually analyzing the data. The students collected and analyzed the data and gave mini reports using graphs as appropriate.
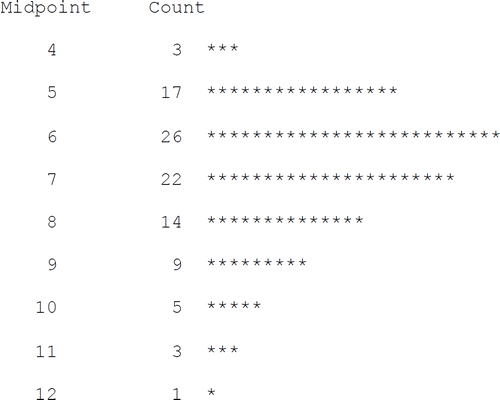
I did not have time to use as many of the activities as I would have liked.
Large classes compound the time problem.
Because of the relatively large class, I was not able to do everything in class suggested by the activity outline.
I had a hard time keeping the students focused and convinced they should labor through the rules.
I found myself asking “What problem are they trying to solve?” Sometimes this was hard to determine. Students may miss the point.
The list of variables was not described in such a way that I could understand clearly the situation, and the matching of the variables and graphs was not clear to me.
I would have used an experiment exercise if there had been one that business, social science and biology students could identify with. The funnel one may be good for engineers and physical scientists, but…
Activities that are physics-based are not for me.
Practical.
Interesting.
A change from lectures.
The activities make it easier to understand the concept.
Groupwork.
The use of visual aids.
The challenge.
Clever approach.
Flipping the coins.
Jumping frogs.
Throwing the thumbtacks.
The use of the computer.
It was easy to make mistakes.
It is not useful.
It is boring.
It is confusing.
It is repetitive, tedious and time consuming.
It is too simple.
Justifying my answers.
There was no right answer.
Groupwork.
Spinning the pennies.
The use of the computer.
Conversations with students indicate that the class had accomplished its goals. Statistics now has a meaning to them in their daily lives and individual studies, rather than “just out there, like most classes.”
Some areas went beyond what we can cover in a service course in one semester.
It was active, kept us engaged and was not trivial.
The materials were varied and adaptable to many levels.
Some of the activities will need “punching-up” for use at my university.
Imaginative and stimulating activities draw students toward statistical concepts.
I like the idea of getting students actively involved in learning the concepts of statistics.
5. Another Sample Activity: Streaky Behavior
40 Mr. Smith, a teacher of introductory statistics, shows his students a transparency of the two sequences below and tells them, “In these two sequences of 200 coin flips, H stands for a head and T for a tail. One of the sequences shows what happened when a student actually tossed a fair coin 200 times. The other sequence was made up by a student trying to fake flipping a coin 200 times. Which do you think is the real sequence and which is the fake?” THTTTTHHTHTHTTTTTHHTHTHHHHHHHHHTHTHTHHHT HHHTTHHTHTHHHHHTHHTHHTTHTHTHTTTTTTHHTHTH THTTTHTTTTHHTTTTHTTTTHTTTTHHHTHTHHTTTHTT THTTHHTHHHTHHHHHTHHHTTHHHTHHTTTTTTTHTTTH TTTHTTHTTTHTTHHHHTHHHTTTHTTTTTTHHTHTTTHH THTHTTTHTTTTHHTHTTTHTTHHHTHHTHTHTHTTTTHH TTHHTTHHHTHHHTTHHHTTTHHHTHHHHTTTHTHTHHHH THTTHHHTHHTHTTTHHTHHHTHHHHTTHTHHTHHHTTTH THHHTHHTTTHHHTTTTHHHTHTHHHHTHTTHHTTTTHTH TTHTTHTHHTTHTTTHTTTTHHHHTHTHHHTTHHTHHTHH
41 After a little discussion, the students almost unanimously agree that the second sequence looks like the one made from flipping a coin. 42 They say such things as, “The heads and tails look more mixed up in the second sequence” and “The first sequence sometimes has too many heads in a row and too many tails in a row.” 43 Mr. Smith now challenges the class to decide how they can make a more educated decision as to which sequence is the real one. One student immediately replies, “Try it with a real coin. Flip a real coin 200 times!” After the hum of general agreement dies down, Mr. Smith asks the class to imagine doing just that and to describe how the new sequence of real coin flips would tell them which of the two original sequences is the real one. Silence. The students decide to discuss this question in their groups. 44 When the class comes back together, several groups have made progress on the question. They have decided that the percentage of heads is not in doubt. Both sequences have about the right number of heads and tails. However, the first sequence has streaks of heads and tails that seem too long. Specifically, the first sequence has nine heads in a row and the students think that should not happen. The students propose flipping a coin 200 times and counting the longest streak of heads. With some guidance from the teacher, the students realize that they must do this many times and see how often they get a streak of nine heads or more. 45 Depending on his or her skill with simulation, each student does one of the following three tasks: (1) flip a coin 200 times; (2) classify 200 random digits as odd or even; or (3) use a computer to simulate flipping a coin 200 times. Each student counts the longest run of heads in his or her sequence. The students make a histogram of their results; it is shaped approximately like the theoretical (non-normal) sampling distribution below ().
Figure 3. Longest Run of Heads
46 The students now realize that the first sequence is more likely to be the real one. A longest run of heads of four, which the second sequence has, is fairly unlikely to occur in 200 tosses of a fair coin. A longest run of heads of nine, which the first sequence has, is much more likely. 47 To assess if his students got the point of the lesson and understand the mechanics of the histogram, Mr. Smith asks the students to discuss the following questions with their groups and turn in written responses at the next class session.
If a basketball player is a 50% field goal shooter, and shoots 200 times in a series of games, what would you expect the longest streak of baskets to be if the player does not exhibit unusually streaky behavior? How could you tell if the player was “hot”?
What could be some of the reasons why people tend to believe that players exhibit “streaks” and “slumps” in games like basketball and baseball?
Would a histogram of the lengths of the longest run of tails be the same as or different from that of the longest run of heads? Explain your reasoning.
In this activity you constructed a histogram of the longest run of heads in a sequence of 200 coin flips. The probability of a head was 0.5 on each flip. Suppose instead you were constructing a histogram of the longest run of heads in a sequence of 200 coin flips for a weighted coin for which the probability of a head was 0.6 on each flip. How would this new histogram be different from the one you constructed? How would it be the same?
48 After reading the students' responses, Mr. Smith believes his students have learned several basic probabilistic and statistical principles from this lesson.
They have learned not to trust their intuition about probabilistic events without further analysis.
They have learned that they can solve what appears to be a difficult probability problem by simulation.
They have learned that not all probability distributions or sampling distributions are approximately normal in shape.
They have learned that the length of streaks expected in a series of Bernoulli trials can be quite long.
They have learned the rudiments of hypothesis testing: invent a test statistic, construct a null distribution, and check the value of the test statistic from an experiment or sample against the null distribution.
They have learned that people tend to believe that the runs that naturally occur in a sequence of Bernoulli trials are shorter than they actually are. Before assigning reasons for a “slump” or “streak” in sports or elsewhere, one should consider whether the run can reasonably be attributed to chance.
49 Since activities do take more time than the lecture method to “cover” the same concept, the evaluation carried out by Mr. Smith is an essential component of any activity-based course. An instructor cannot afford to waste time on activities that do not promote learning.
6. Conclusions
50 The authors have used activities in their teaching of statistics across a variety of settings. These include both small and large lecture sections and courses taught with and without laboratories. Some of our observations follow.
51 The use of activities has invigorated our teaching and improved our attitude. We think that we are giving more attention to what really matters – discussing the big ideas, developing understanding of key concepts – rather than dwelling on mechanical skill. Some students react very positively to this, while others feel that they are being cheated out of the carefully prepared lectures and broad coverage of material that they think they are paying for. Activities, when carefully selected, can focus student attention on important statistical issues. Teachers should be aware, however, that some students, particularly those who thrive in courses taught in a lecture format, resist the use of activities. Nonetheless, we think that overall the benefits outweigh the costs. Although some students do not see the need for activities, the typical student gains understanding by doing activities that is not gained by reading the text or listening to a lecture.
52 Large lecture sections do not easily lend themselves to group work, but carefully chosen activities still can be used to illustrate basic concepts. Students can do simple experiments (like measuring their heart rate) or work with one or two of their neighbors to generate simulated data from a random number table. The key is to keep the measurements simple so that data can be collected easily, perhaps by a show of hands, and recorded quickly, perhaps on a rough dot plot. Of the two activities discussed above, Cents and the Central Limit Theorem is the type that does not work well in a large lecture, but Streaky Behavior can be done in this setting. Most students find these diversions from the lecture format refreshing and, as a result, they become more alert in class. Of course, an ideal setting is to have the large lecture meet in smaller “laboratory” sections at least once a week, even if the “laboratory” is simply a smaller classroom with no computer equipment.
53 Our goal in the Activity-Based Statistics project was to produce a cohesive collection of “laboratory” units for a one-semester course in modern statistics, with emphasis on:
Modern graphical and exploratory approaches to statistics,
Understanding of probability through simulation,
Introduction to statistical inference through empirical approaches and simulation,
Design of studies, both surveys and experiments, and
Use of appropriate technology without being computer-dependent.
54 This goal has been reached, in part, by incorporating ideas on active learning that came from many experienced teachers, experience with the Quantitative Literacy Project (an ASA-NCTM project for the secondary schools resulting in the Exploring books shown in the references) and observations on successful quality improvement programs in industry. The activities can be used in a variety of class settings to allow students to “discover” concepts of statistics by working through a set of “laboratory” exercises. Whether the “laboratory” is the classroom, the student's usual place of study, or a more formal statistics laboratory, we believe that the traditional lectures in introductory statistics should be supplemented or supplanted by a program that requires the active participation of the students, working individually or in groups.
References
- Barbella, P., Kepner, J., and Scheaffer, R. L. (1994), Exploring Measurements, Palo Alto, CA: Dale Seymour Publications.
- Becker, B. J. (1996), “A Look at the Literature (and Other Resources) on Teaching Statistics,” Journal of Educational and Behavioral Statistics, 21, 71–90.
- Bradstreet, T. E. (1996), “Teaching Introductory Statistics Courses So That Nonstatisticians Experience Statistical Reasoning,” The American Statistician, 50, 69–78.
- Garfield, J. (1995), “How Students Learn Statistics,” International Statistical Review, 63, 25–34.
- Gnanadesikan, M., Scheaffer, R. L., and Swift, J. (1987), The Art and Techniques of Simulation, Palo Alto, CA: Dale Seymour Publications.
- Jowett, G. H., and Davies, H. M. (1960), “Practical Experimentation as a Teaching Method in Statistics,” Journal of the Royal Statistical Society, Ser. A, 123, 10–36.
- Landwehr, J. M., and Watkins, A. (1995), Exploring Data, Palo Alto, CA: Dale Seymour Publications.
- Landwehr, J. M., Swift, J., and Watkins, A. (1987), Exploring Surveys and Information from Samples, Palo Alto, CA: Dale Seymour Publications.
- Neuman, C. M., Obremski, T. E., and Scheaffer, R. L. (1987), Exploring Probability, Palo Alto, CA: Dale Seymour Publications.
- Scheaffer, R. L., Gnanadesikan, M., Watkins, A., and Witmer, J. (1996), Activity-Based Statistics, New York: Springer-Verlag. Both a student workbook and an instructor's resource volume are available.