Abstract
Courses taught using problem-based learning methods give life sciences graduate students direct practice in thestatistical reasoning skills needed to choose appropriate procedures for analyzing data from their researchstudies. This paper describes a graduate-level, case-based biostatistics course designed to cultivate these skills inveterinary medical science students who have had some initial preparation in statistics. The course gives student spractical experience by focusing on the analysis of data from actual biomedical research studies. Studentevaluations indicated that this course improved the students' ability to understand and apply statistical methods intheir research.
1. Introduction
1 Most graduate programs in the life sciences require one or more courses in biostatistics to prepare students to conduct graduate and professional research. These students are mainly concerned not with learning the mathematical theory of statistics, but with learning how to use statistics (e.g., how to develop a good experimental design, how to choose an appropriate statistical procedure, or how to interpret statistical results in a scientific paper).
2 There has been criticism that traditional lectures do not adequately develop these skills, and repeated calls have been made for more effective teaching methods (CitationFederer 1978; CitationHogg 1991; CitationSnee 1993). A disadvantage of the lecture approach is that it is fundamentally subject-based rather than problem-based; that is, the focus is on learning statistical concepts, not on the process of using statistics to solve problems. Subject-based approaches are efficient for dispensing content knowledge because the instructor can control the amount of material covered and can adapt the level of presentation to the needs of the students. However, this careful structuring of the course content may discourage further learning by leaving students with the impression that they have learned all that is worth knowing about statistics. Moreover, if the statistical concepts are not integrated with their discipline knowledge, it may be difficult for students to recall and apply these concepts later.
3 These deficiencies of the lecture approach are conspicuously evident to me from my perspective of nearly twenty years as a statistical consultant in an academic setting. Despite the best intentions and efforts of my colleagues who are more heavily engaged in classroom teaching, my experience has been that most students have forgotten all but a few catch phrases from their introductory statistics course within a year or two of its completion. More importantly, many students fail to make the connection between statistical reasoning and scientific inquiry. These students do not view statistics as integral to the design and interpretation of research studies, but merely as a source of significant p-values that must be obtained to guarantee publication of their results (CitationSalsburg 1985).
4 Can the lecture approach be improved to promote long-term learning and an appreciation of the key role of statistics in scientific research? Some authors (CitationBradstreet 1996; CitationBrightman and Broida 1975; CitationChervany, Benson, and Iyer 1980) have suggested that this can be accomplished by modifying the lecture approach to teach statistical reasoning skills in addition to statistical concepts. CitationCobb (1993) has described twelve NSF-funded projects, ten of which use active learning in their efforts to improve the teaching of statistical thinking and statistical methods. Incorporating active learning into lecture courses is a recurring theme of papers appearing in Journal of Statistics Education as well. Thus, the idea of “learning by doing” is well established and its merits have been demonstrated.
5 Notwithstanding the successes of active learning in a lecture format, alternatives to the lecture format deserve consideration. Student-centered approaches, such as problem-based learning (PBL), may be even more effective in developing statistical reasoning and problem-solving skills. The second section of this paper gives a brief overview of PBL methods. In the third section, I describe a case-based biostatistics course designed for veterinary medical science graduate students who have had some prior exposure to statistical methods. The fourth section illustrates one of the cases used in the course. The fifth section summarizes student reactions to the course and discusses problems in implementation and improvements planned for future presentations of the course.
2. Overview of Problem-Based Learning
6 Educational theorists have demonstrated that knowledge is recalled more easily, retained longer, and more readily applied when the process of learning corresponds to the way that the knowledge is to be used. PBL methods were initially introduced in medical education in the 1960s (CitationBarrows and Tamblyn 1980) to facilitate this way of learning. Medical students in a traditional didactic curriculum learn anatomy, physiology, and other basic medical sciences separately from the clinical sciences that emphasize the diagnosis and treatment of disease, whereas students in a PBL curriculum learn the basic sciences by solving clinical problems. As an example, students in a didactic curriculum learn about diseases of the heart and related symptoms. In contrast, students in a PBL curriculum are presented with a patient showing symptoms and learn to reason from those symptoms to determine their underlying cause and the basic science structures and processes involved. The PBL approach clearly emulates the diagnostic activity of a practicing physician by proceeding from effect to cause. Several studies (CitationAlbanase and Mitchell 1993; CitationDistlehorst and Robbs 1998; CitationVernon and Blake 1993) comparing parallel didactic and PBL curricula have shown that PBL students performed as well or better than traditionally- educated students on such outcome measures as the United States Medical Licensing Examination. Moreover, the PBL students performed better in their clinical clerkship and clinical practice examinations, thus suggesting that PBL approaches teach some elements of problem solving better than traditional approaches.
7 Regardless of the teaching method used, no statistics course can expect to cover every topic that students will need to know in order to conduct their future research. When teaching is organized around a particular subject area, instructors can have confidence that they are including all the concepts and skills they feel the students should learn. However, students’ future needs for statistical knowledge are not identical and the instructor cannot anticipate every possible contingency. Many students are comfortable with the subject-based approach because the instructor delimits the breadth and depth of knowledge they must acquire to complete the course successfully. Students who accept this passive role remain dependent upon an instructor to supply knowledge and are not motivated to search out and organize knowledge for themselves. When these students are challenged with a new data analysis problem outside of the classroom setting, they are not prepared to accept responsibility for extending their current level of knowledge to discover a suitable solution. These students then have the choice of seeking advice from an expert on statistics (or someone who claims to be) or of inappropriately forcing the new problem into the mold of those studied previously.
8 With PBL methods, students learn to identify areas where more knowledge is needed and to pursue self- directed learning when faced with new problem situations. Thus PBL methods are most suited to students who have the self-discipline to take active responsibility for their own learning. PBL methods may seem to be less efficient for transmitting knowledge because they are more indirect than subject-based methods; however, this deficiency can be remedied by careful case selection. PBL cases that include multiple potential courses of action give students practical experience in choosing among competing alternatives. This focus on the problem-solving process helps students recognize whether they are facing a problem that is within their present capabilities or one that requires them to obtain additional knowledge.
9 CitationBarrows (1986) classified PBL methods, as used in medical education, according to the degree of student involvement in the learning process and the amount of information that is given to students about the problem. He ranked the methods according to their ability to meet the following educational objectives: (1) structuring of knowledge for use in clinical contexts, (2) the development of an effective clinical reasoning process, (3) the development of effective self-directed learning skills, and (4) increased motivation for learning. Barrow’s ranking, in order of increasing effectiveness, and a brief description of his categories are given below.
| • | Case-based lectures. Students receive background information on a case to study prior to the lecture. The cases are chosen to illustrate particular diseases or conditions, and the instructor uses lectures to guide the students through the diagnosis of the case. | ||||
| • | Case method. Students receive complete details on a case, and study and research it themselves before coming to class. The instructor, acting in a tutorial role, facilitates class discussion of the analysis of the case. | ||||
| • | Modified case-based. Students receive partial details on a case and, after class discussion, choose from a limited number of inquiry actions or decisions. The list of inquiry actions and decisions may be generated by the class or provided by the instructor. Students then receive additional information on the case and further discussion ensues. | ||||
| • | Problem-based. Students are presented with a simulated patient. The students evaluate the patient’s signs and symptoms, generate hypotheses, and decide what additional information is needed. The instructor facilitates the class exploration of the problem. | ||||
| • | Closed-loop problem-based. After completing a problem-based case, the students undertake self-directed study. They then return to the problem as it was initially presented and evaluate the information sources they used and their prior reasoning and knowledge. | ||||
10 Some of these methods are obviously not practical for an isolated course, outside the context of an entirely- PBL curriculum, because of the time needed for research related to the cases and for self-directed learning. However, the case-based lectures and case methods could be used even in a traditional curriculum. CitationKnapp and Miller (1987), CitationShannon (1988), and CitationWolfe (1982) discuss variations on the use of those methods to teach biostatistics.
11 CitationBarrows (1986) stressed that PBL methods do not include approaches that use problems merely as an example of what has been learned, such as in the lecture-based cases method that is already widely used in teaching statistics (CitationBoring and Nutter 1984; CitationBrogan 1980; CitationCarter 1987; CitationHacker 1987). In that familiar method, the instructor lectures on a statistical procedure and then tries to make the procedure relevant by applying it to the analysis of an actual or artificial data set. The background information given for these “cases” is usually quite abbreviated; often no more than a sentence or two containing the essential information needed to perform the calculations. The students are motivated to some extent, but they do not practice using the knowledge the way they will have to use it in their research.
3. A Case-Based Biostatistics Course
3.1 Reasons for Developing the Course
12 In 1993, the College of Veterinary Medicine became the first veterinary school in the United States to adopt PBL in the preclinical phase of the professional (Doctor of Veterinary Medicine) curriculum, and the College is deeply committed to the success of the PBL curriculum. The College also offers a graduate program in Veterinary Medical Science (VMS) with a current enrollment of 12 MS and 13 PhD students. In contrast to the professional program, the graduate program is almost entirely subject-based and consists of traditional lectures and laboratories. Nearly all of the VMS students hold research assistantships that require 20 hours service per week in addition to the time spent in the laboratory on their thesis or dissertation research.
13 As the graduate program has grown, new program options have been added. Some of these program options require a course in epidemiological methods to meet accreditation standards. An epidemiology course is also needed for students desiring certification in particular disease specialties. I was asked to develop a new course, “Epidemiology/Biostatistics,” that would fulfil those requirements.
14 VMS students are required to schedule one (MS students) or two (PhD students) statistics courses, unless they have taken the requisite number of statistics courses as part of another degree program. Most VMS students have no prior experience with statistics and schedule “Statistical Methods,” a graduate-level service course offered by the Department of Mathematics and Statistics. That department offers only one other graduate-level service course for non-majors, “Design and Analysis of Experiments.” Although these two service courses cover numerous essential topics, many statistical methods important to biomedical research are not included. Some of those methods (e.g., linear regression analysis, nonparametric methods) are included in courses designed for statistics majors and require a mathematics background that most VMS students lack. Other topics (e.g., logistic regression, survival analysis, epidemiological methods) are not taught in any course.
“Epidemiology/Biostatistics” was therefore designed to build upon the foundation laid by “Statistical Methods” by introducing statistical methods commonly used in biomedical research. It was also designed to be taught at a level suitable to the VMS students’ mathematical training.
15 Another consideration in developing the new course was my observation that students remember very little that they are taught in traditional statistics courses. As the only biostatistician in the College, my primary faculty responsibilities are statistical consulting and collaborative research. Whether assisting students with analyses for their theses or dissertations or working as part of a research team with fellow faculty members, I continually encounter persons with a high level of “statistics anxiety” who do not feel confident choosing an appropriate analysis even in simple situations. All of these people are products of traditional lecture-based statistics courses. Because of PBL’s emphasis on developing reasoning and problem-solving skills, I decided to adopt a PBL approach instead of a lecture approach for “Epidemiology/Biostatistics.”
3.2 Choice of Cases
16 The text currently used for “Statistical Methods” is Statistical Methods by CitationFreund and Wilson (1997); texts used in the recent past include Statistics for Research by CitationDowdy and Wearden (1991) and Principles and Procedures of Statistics: A Biometrical Approach by CitationSteel and Torrie (1980). The course material is typical of introductory service courses and comprises the basics of descriptive and inferential statistics. Specific topics include the t test for paired and independent samples and one-way ANOVA for completely randomized and randomized complete block designs. Depending on the instructor, Latin square and split-plot designs and two- way ANOVA may be covered; occasionally, a brief introduction to linear regression and contingency table analysis is included. Although not all VMS students take this particular course, it does represent the general level of statistical preparation of students enrolling in “Epidemiology/Biostatistics.”
17 The cases for “Epidemiology/Biostatistics” were selected to include statistical methods cited by CitationHammer and Buffington (1994) as those most prevalent in the veterinary medical literature (). However, special emphasis was placed on those methods that students were most likely to misuse. In their study of 295 articles from ten leading medical journals, CitationSchor and Karten (1966) observed that only papers filled with statistical tests and jargon were routinely subjected to a statistical review. However, those papers typically used statistics correctly because a statistician was involved as co-author or as a collaborator on the project. A statistician did not usually review papers that only used “simple” statistical methods, such as t tests or chi-square tests, and these methods were often used incorrectly. Overall, statistical methods were used correctly in only 52.5% of the articles. CitationShott (1985) studied 635 articles appearing in the Journal of the American Veterinary Medical Association and the American Journal of Veterinary Research. Only 466 of these papers provided sufficient information to evaluate the statistics used; statistical methods were used incorrectly in 54 (11.6%) of those papers. The most common error was treating dependent observations as if they were independent; this occurred in 47 (87.0%) of the papers with errors.
18 Based on this information, I chose to devote approximately half of “Epidemiology/Biostatistics” to studies involving two independent groups or two dependent groups that would demonstrate the correct use of t tests and chi-square tests. Currently, the course uses eight cases that cover the topics listed in Appendix 1. The first time I offered this course, I used 13 cases. However, the semester is only 17 weeks long and that did not allow enough time to discuss each case fully. The five cases that were eliminated dealt with extensions of Cases 1-4 to more than two groups and with multiple regression.
19 Whenever possible, I have based the cases on research studies encountered in my statistical consulting practice. In this way I can provide the original data as well as insights into the investigator’s reasons for conducting the study and into design problems that needed to be overcome. In some cases the principal investigator or other members of the research team are still associated with the College and available to participate in class discussion. The original studies have usually been published as journal or proceedings articles, which provide the scientific context needed to make the problem important to the students.
20 Despite my varied consulting practice, I have also needed to use other sources in developing cases. Collections of case studies, such as CitationMiller, Efron, Brown, and Moses (eds.) (1980), are a good source of original data accompanied by detailed background information and references to original studies. For example, I found two papers (CitationJohnson and Johnson 1972; CitationVianna, Greenwald, and Davies 1971) cited in the case study by CitationMiller (1980) to be useful for Cases 3 and 4. Those papers investigate the same research question, but one study has independent groups and the other has paired groups. The paper by CitationJohnson and Johnson (1972) is especially valuable for class discussion because it is an example of an incorrect statistical analysis that appeared in a major medical journal. Three subsequent “Letters to the Editor” pointed out this error (CitationCole, Mack, Rothman, Henderson, and Newell 1973; CitationPike and Smith 1973; CitationShimoka, Bross, and Tidings 1973). CitationSinger and Willett (1990) compiled an annotated bibliography of published data sets that could be used as the basis for meaningful cases. Textbook examples should be used only as a last resort because they generally lack sufficient scientific context and background information to motivate students to learn.
Table 1. Statistical Methods Used in 1,062 Articles Published in Six Veterinary Medical Journals During 1992
3.3 Organization of the Course
21 The present implementation of “Epidemiology/Biostatistics” is a mixture of the case-based lectures method and the case method. Because the remainder of the curriculum consists of traditional lectures and laboratories, the VMS students cannot typically devote sufficient time outside of class to research a case completely. Thus, the instructor must decide when mini-lectures, either prepared or extemporaneous, are needed to facilitate progress on a given case. This lecture component, however, is intended to be secondary to class discussion.
22 Prior to class discussion, each student receives background information, such as a report or journal article relevant to the current case. It is immaterial that the students know from the beginning which statistical analyses were used in the actual study; the focus of the case is on learning how and why those analyses were chosen over other possible alternatives. Each student also receives a diskette containing the original data and a SASÒ program that incorporates a variety of analyses that are potentially relevant to the research question and the experimental design. However, the assumptions necessary for all of those analyses may not hold; SASÒ code for testing those assumptions is also included in the program. Other resources include a biomedical statistics text (CitationWoolson 1987) and supplementary readings placed on reserve in the College branch library. The instructor is freely available for consultation outside of class. Students are instructed to read the background information, run the SASÒ program, and bring the output to class.
23 During each class session, the instructor guides discussion to help each student develop a cognitive framework for evaluating alternative methods of analysis. Initial discussion of a case involves understanding the research question and the experimental design. Students are led to recognize how the research question and the experimental design influence the selection of statistical methods. The advantages and disadvantages of alternative procedures, assumptions underlying various statistical methods, and ways of testing those assumptions are considered. Students learn that the match between the assumptions needed for a statistical analysis and the actual experimental situation is never perfect, and that the poorer the match, the more cautious they need to be about their interpretation of the results of the analysis. Follow-up analyses, especially the use of confidence intervals to distinguish between statistical significance and practical importance, and methods for summarizing statistical results are explored. The use of hand calculations and formulas is minimized; emphasis is placed on using the SASÒ statistical package and interpreting SASÒ output. Two weeks are usually required to complete discussion of each case.
24 Students are evaluated following each case to assess statistical knowledge and problem solving skills. Each student prepares a detailed written report on the case, which allows the instructor to uncover areas of confusion and recommend additional individualized study. Then each student chooses an analogous case in his/her area of specialization that requires a similar design and analysis, analyzes the data, and justifies the choice of analysis in a written report. For the additional case, the student is urged to use data from his/her own thesis or dissertation research, from one of his/her major professor’s research projects, or from a journal article in his/her field that gives the original data. When a student must rely on a published article that does not provide the complete data, he/she is shown how to use summary statistics to generate a simulated data set using random number functions in SASÒ. Students may not use data from textbook examples unless they obtain and read the article that was the original source of the data. Each student writes 16 reports during the semester; reports on the cases discussed in class are considered homework and the student-selected cases are treated as take-home examinations. The final examination focuses on problem solving in situations similar to those encountered in class. Students receive background information and relevant computer output on four research problems; access is allowed to the class text and notes. Students are evaluated on their ability to explain and justify the reasoning process that led to their answers.
25 The short-term effectiveness of this program was measured using a student evaluation questionnaire to determine whether the course content and format met the students’ currently perceived needs. Questions concerning operational aspects of the course were included to uncover areas for improvement. Long-term effectiveness will be assessed according to the students’ success in applying course concepts in their thesis or dissertation research.
4. An Example Case
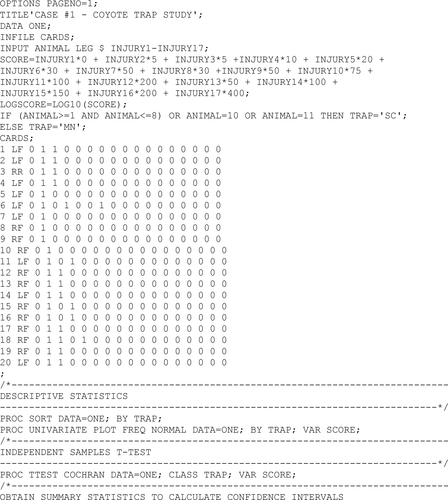
26 An example case compared the amount of injury caused to coyote legs by two types of foothold traps (modified Northwoods and modified Soft-Catch) used in north central Mississippi during 1992 (CitationHouben, Holland, Jack, and Boyle 1993). Ten coyotes were captured with each type of trap and the trauma to the trapped leg was rated according to severity on a scale devised by CitationOlsen, Linscombe, Wright, and Holmes (1988). This scale assigns points to different injuries ranging from bruises to amputations (); the injury score is the accumulated points for each type of unrelated injury. The legs were scored jointly by a veterinary pathologist and a veterinary radiologist. The study was designed by a wildlife biologist; a biostatistician was not consulted until after all the data had been collected.
27 Initial class discussion of this case concentrated on determining the experimental design and the research question. Design issues included the number of groups being compared, whether the observations were paired or unpaired, and possible sampling biases due to the geographical distribution of the traps and the fact that the modified Soft-Catch traps were set out earlier than the modified Northwoods traps. Traps were set as part of normal depredation control efforts and not distributed throughout the study area according to any kind of randomization plan. This raised concerns that the traps might not be capturing animals from the same population. For example, one type of trap might be more likely to capture older animals that were more susceptible to injury. The wildlife biologist’s stated objective was to determine whether the two trap designs differed in trap-related injuries. His original plan for data analysis was simply to report the mean and standard deviation of the injury score for each of the two types of trap. However, the class felt that a test should be performed to determine if the difference between the means was statistically significant.
28 Discussion then centered on the question of whether the mean was an appropriate summary statistic for the injury score. The raw data and SASÒ code for calculating the injury scores are given in Appendix 2; the frequency distribution for injury scores resulting from the two types of traps is shown in . All of the legs sustained at least a bruise or small cut and 90% of the scores on either trap were 15 or lower. The distribution of injury scores appears skewed because two legs suffered more serious injuries. One leg captured in a modified Northwoods trap received a bruise, a skin cut less than 2 cm, and a cut ligament for a total injury score of 30. One leg captured in a modified Soft-Catch trap received a bruise, a skin cut greater than 2 cm, and a joint luxation for a total injury score of 65. Some students in the class, who were also veterinarians, were able to provide perspective on the nature of these injuries and formed the opinion that the leg with the 65 score was not injured more than twice as badly as the leg with the 30 score. The class concluded that injury score was measured on an ordinal scale because the number of points assigned to each type of injury had only an arbitrary relationship to the actual severity of the injury. This led to consideration of the median as a more appropriate measure of the “average” injury score.
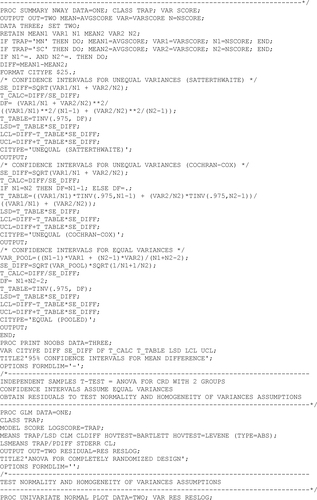
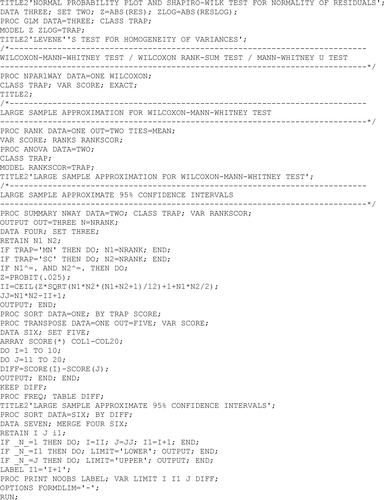
29 Attention then turned to comparing the average injury scores for the two trap types. From their previous statistics classes, the students were familiar with the t test for independent samples and the SASÒ TTEST procedure. At this point the instructor briefly reviewed the assumptions necessary for the t test. Output from the TTEST procedure was examined and the use of the F test for equality of variances and the Satterthwaite and the Cochran and Cox approximations were discussed. Students were shown the relationship between the t test and one-way ANOVA for a completely randomized design with two treatment groups. They were also shown how to use the SASÒ GLM procedure to output residuals and to test the homogeneity of variances assumption with Levene’s test. The residuals were also analyzed with the SASÒ UNIVARIATE procedure to test the normality assumption by graphical means (box plot, stem-and-leaf plot, normal probability plot) and the Shapiro-Wilk W statistic. The GLM and UNIVARIATE procedures were also used to demonstrate that a logarithmic transformation of the injury scores did not make the variances more equal or the distribution of the residuals more normal. Another mini-lecture introduced the Wilcoxon-Mann-Whitney test (also known as the Wilcoxon rank-sum test or the Mann-Whitney U test) as an alternative to the t test for ordinal data. Students were shown how to perform the Wilcoxon-Mann-Whitney test with the SASÒ NPAR1WAY procedure.
30 There was no statistically significant difference between the two types of traps in mean or median injury score by the t test (p = 0.81) or the Wilcoxon-Mann-Whitney test (p = 0.27). The discussion now focused on the practical importance of this result. Students were shown how to calculate a point estimate and a 95% confidence interval for the mean difference using programming statements in the SASÒ DATA step and using the GLM procedure, and for the median difference by manual computation and using an ExcelÒ spreadsheet. The point estimate and 95% confidence interval for the median difference were 0 and [0, 5] points, thus the difference was deemed to be of negligible practical importance. Finally, the class considered alternative ways of presenting the results in a publication (for example, in a narrative manner, as point and interval estimates, and as frequency distributions).
Table 2. Point Scores Assigned to Limb Injuries of Furbearers Captured in Foothold Traps
Table 3. Frequency Distribution of Injury Scores for Two Types of Foothold Traps
5. Experiences with the Course
5.1 Evaluation
31 “Epidemiology/Biostatistics” has been presented twice, first to a class of 18 students and later to a class of four students. In both classes, approximately half of the students were enrolled in the VMS program and the remainder consisted of graduate students in other agricultural and life sciences disciplines. All of the students had previously taken at least one introductory statistics course. None of the students had prior experience with PBL.
32 A formal evaluation questionnaire was administered to the larger class. The responses indicated satisfaction with both the case-based method and the course content. Of the 15 students completing the questionnaire, 10 agreed that “The teaching methods used in this course are well chosen,” and all agreed that “My instructor encourages student participation and questions.” All except one agreed with the statement “The content of this course is relevant to my needs.” Specific student “likes” included “This teaching style,” “Learning to interpret SAS outputs,” “Practical application related to our own project,” and “Open discussion and relaxed lecture atmosphere.” Students were generally dissatisfied with the amount of time required to prepare the reports. Although 80% agreed that “This course was demanding compared to other graduate courses that I have taken,” 74% agreed that “The course was worth the effort that I expended,” and “I would recommend this course to another student.” A typical student comment was “My overall understanding of statistics is greatly improved, but the course took an enormous amount of time.”
33 About half of the students later consulted with me concerning the analysis of data from their thesis or dissertation research. Most of those students displayed less statistics anxiety than in consultations prior to the course; however, that may be because they had become accustomed to discussing statistical matters with me in class. Nevertheless, those students were generally able to develop a suitable analysis plan for their data and they consulted with me merely for reassurance that their plan was appropriate. In contrast, VMS students who have not had my course are rarely able to devise a sound analysis plan without extensive assistance.
34 Other evidence that “Epidemiology/Biostatistics” promoted the students’ capability for self-directed learning came from two students in the second class. I served as a committee member for their dissertation research and they took their candidacy examinations at the same time. For the statistics examination, I described a generic bioassay experiment and told them that such experiments are usually analyzed by probit analysis. I knew that these two students did not have prior experience with this technique and it had not been mentioned in “Epidemiology/Biostatistics.” The students were told to teach themselves about probit analysis and write a short paper describing probit analysis, discussing when and how to use it. Next, they were told to find a set of data from a bioassay experiment and analyze it by probit analysis, either performed by hand or with a computer program, and to write a report on the analysis. Finally, they were asked to identify two techniques discussed in “Epidemiology/Biostatistics” that could be used to estimate the LD50 and to use those techniques to estimate the LD50. Both students did exceptionally well on this examination and were able to respond acceptably to questions posed about probit analysis at their subsequent oral examinations.
35 A rigorous comparison of the PBL approach to the conventional lecture approach would require conducting parallel courses using both methods to teach the same material. However, this is impossible in my situation; I am the only available instructor and the pool of potential students is so limited that the course can only be taught every two years. Providing more definitive proof that PBL approach is effective for teaching biostatistics is left to others in more favorable teaching circumstances.
5.2 Difficulties
36 Several obstacles were found in implementing the PBL course described in this paper. A major difficulty was that the students’ other concurrent courses were traditional lectures and laboratories. None of the students had enough free time to assume complete responsibility for investigating all the learning issues associated with each case. Thus, lectures were needed to complement those learning issues that the students developed in the group discussions. In this type of course, the instructor’s constant challenge is providing essential supplementary information without encouraging passive student learning behavior.
37 In the larger class, several students hampered group discussion by habitually failing to review the case materials before coming to class. It was a formidable task for the instructor to draw those students into the discussion and prevent them from being passive note-takers. This difficulty was greatly reduced in the subsequent, smaller class. Because of the lower enrollment, each student’s contribution to the group discussion was more obvious and subjected to greater scrutiny by the group. That situation appeared to stimulate healthy competition in proposing and defending problem-solving strategies. However, the variety of approaches suggested was not as great as in the larger class. Considering my experience with both a large and a small class, a maximum class size in the 6-10 range seems practical for this version of PBL.
5.3 Future Directions
38 The number of cases was reduced from 13 to eight for the second class in order to decrease the time commitment for the writing component and to increase the time available for class discussion. In the future, student participation in case presentation will be increased in order to reduce the lecture component further and to make the class even more student-centered. Additional cases, highlighting a broader range of veterinary medical research situations, will be developed. Although not planned at this time, cases could be offered as learning modules in either a computer-assisted or primer format. That development would allow students to review and practice problem-solving skills in a self-paced environment and to explore, by independent study, additional topics that are beyond the scope of a one-semester course.
6. Summary
39 With both subject-based and PBL methods, the goal is to impart the fundamental concepts of a discipline. However, with subject-based teaching approaches, the primary focus is on the concepts themselves and only secondarily on the use of those concepts. With PBL methods, the primary focus is on the process of using information to solve problems. By associating concepts with solving problems, knowledge is recalled more easily, retained longer, and more readily applied to new problems.
40 By using statistics in real-life situations, PBL methods help life sciences students develop a strategy for dealing with problems, give them a mental framework for evaluating alternative methods of analysis, and motivate them to take responsibility for their own learning. They also stimulate students to learn more about statistics and discourage the attitude that everything important about statistics can be learned in one or two semesters.
41 A PBL method was used by the author to give veterinary medical science graduate students direct practice in the statistical reasoning skills needed to choose appropriate procedures for analyzing data from their own research studies and to evaluate the research of others. In this case-based approach, actual biomedical research studies were used to explore alternative designs and methods, follow-up analyses, and methods for summarizing statistical results. Concepts were practiced and reinforced through written reports. Student evaluations indicated satisfaction with this approach. This course is continually being revised to encourage greater student involvement and better to promote self-directed learning.
Acknowledgments
Part of this paper was presented at the 1996 Joint Statistical Meetings in Chicago, IL, to the American Statistical Association Section on Teaching of Statistics in the Health Sciences. The author thanks Drs. Kristi A. Green, Kristine Tischer, and Stephen J. Waldhalm; the editor; and three anonymous referees for their constructive suggestions for improving the manuscript. This is Journal Article #J9377 from the Mississippi Agricultural and Forestry Experiment Station (MAFES). Research was supported by MAFES and the College of Veterinary Medicine, Mississippi State University, under project #MISV-6401.
References
- Albanase, M. A., and Mitchell, S. (1993), “Problem-Based Learning: A Review of Literature on Its Outcomes and Implementation Issues,” Academic Medicine, 68, 52–81.
- Barrows, H. S. (1986), “A Taxonomy of Problem-Based Learning Methods,” Medical Education, 20, 481–486.
- Barrows, H. S., and Tamblyn, R. M. (1980), Problem-Based Learning – An Approach to Medical Education, New York: Springer.
- Boring, J. R., and Nutter, D. O. (1984), “Analytic Thinking: Educating Students for the Practice of Modern Medicine,” Journal of Medical Education, 59, 875–880.
- Bradstreet, T. E. (1996), “Teaching Introductory Statistics Courses So That Nonstatisticians Experience Statistical Reasoning,” The American Statistician, 50, 69–78.
- Brightman, H., and Broida, M. (1975), “On Problem Solving, Motivation and Statistics,” The American Statistician, 29, 164–166.
- Brogan, D. R. (1980), “A Program of Teaching and Consultation in Research Methods and Statistics for Graduate Students in Nursing,” The American Statistician, 32, 96–99.
- Carter, R. A. (1987), “Biostatistics Instruction at Meharry Medical College,” The American Statistician, 41, 268–269.
- Chervany, N. L., Benson, P. G., and Iyer, R. K. (1980), “The Planning Stage in Statistical Reasoning,” The American Statistician, 34, 222–226.
- Cobb, G. W. (1993), “Reconsidering Statistics Education: A National Science Foundation Conference,” Journal of Statistics Education [Online], 1(1). (http://www.amstat.org/publications/jse/v1n1/cobb.html)
- Cole, P., Mack, T., Rothman, K., Henderson, B., and Newell, G. (1973), “Tonsillectomy and Hodgkin’s Disease,” New England Journal of Medicine, 288, 634.
- Distlehorst, L. H., and Robbs, R. S. (1998), “A Comparison of Problem-Based Learning and Standard Curriculum Students: Three Years of Retrospective Data,” Teaching and Learning in Medicine, 10(3), 131–137.
- Dowdy, S., and Wearden, S. (1991), Statistics for Research (2nd ed.), New York: John Wiley.
- Federer, W. T. (1978), “Some Remarks on Statistical Education,” The American Statistician, 32, 117–121.
- Freund, R. J., and Wilson, W. J. (1997), Statistical Methods (rev. ed.), San Diego, CA: Academic Press.
- Johnson, S. K., and Johnson, R. E. (1972), “Tonsillectomy History in Hodgkin’s Disease,” New England Journal of Medicine, 287, 1122–1125.
- Hacker, C. S. (1987), “Medical Statistics at the Medical School of the University of Texas Health Science Center at Houston,” The American Statistician, 41, 266–267.
- Hammer, A. S., and Buffington, C. A. (1994), “Survey of Statistical Methods Used in the Veterinary Medical Literature,” Journal of the American Veterinary Medical Association, 205(2), 344–345.
- Hogg, R. V. (1991), “Statistical Education: Improvements Are Badly Needed,” The American Statistician, 45, 294–299.
- Houben, J. M., Holland, M., Jack, S. W., and Boyle, C. R. (1993), “An Evaluation of Laminated Offset Jawed Traps for Reducing Injuries to Coyotes,” in Eleventh Great Plains Wildlife Damage Control Workshop Proceedings, 148–153.
- Knapp, R. G., and Miller, M. C. (1987), “Clinical Relevance: An Issue in Biostatistical Training of Medical Students,” Medical Education, 21, 32–37.
- Miller, R. G. (1980), “Combining 2 × 2 Contingency Tables,” in Biostatistics Casebook, eds. R. G. Miller, B. Efron, B. W. Brown, and L. E. Moses, New York: John Wiley, pp. 73–83.
- Miller, R. G., Efron, B., Brown, B. W., and Moses, L. E. (eds.) (1980), Biostatistics Casebook, New York: John Wiley.
- Olsen, G. H., Linscombe, R. G., Wright, V. L., and Holmes, R. A. (1988), “Reducing Injuries to Terrestrial Furbearers by Using Padded Foothold Traps,” Wildlife Society Bulletin, 16, 303–307.
- Pike, M. C., and Smith, P. G. (1973), “Tonsillectomy and Hodgkin’s Disease,” Lancet, 1, 434.
- Salsburg, D. S. (1985), “The Religion of Statistics as Practiced in Medical Journals,” The American Statistician, 39(3), 220–223.
- Schor, S., and Karten, I. (1966), “Statistical Evaluation of Medical Journal Manuscripts,” Journal of the American Medical Association, 195(13), 1123–1128.
- Shannon, H. S. (1988), “Development of a Problem-Based Course in Biostatistics,” in American Statistical Association Proceedings of the Section on Statistical Education, 220–221.
- Shimoka, K., Bross, I. D. J., and Tidings, J. (1973), “Tonsillectomy and Hodgkin’s Disease,” New England Journal of Medicine, 288, 634–635.
- Shott, S. (1985), “Statistics in Veterinary Research,” Journal of the American Veterinary Medical Association, 187(2), 138–141.
- Singer, J. D., and Willett, J. B. (1990), “Improving the Teaching of Applied Statistics: Putting the Data Back into Data Analysis,” The American Statistician, 44(3), 223–230.
- Snee, R. D. (1993), “What’s Missing in Statistical Education?” The American Statistician, 47, 149–154.
- Steel, R. G. D., and Torrie, J. H. (1980), Principles and Procedures of Statistics: A Biometrical Approach (2nd ed.), New York: McGraw-Hill.
- Vernon, D. T., and Blake, R. L. (1993), “Does Problem-Based Learning Work? A Meta-Analysis of Evaluative Research,” Academic Medicine, 68, 550–563.
- Vianna, N. J., Greenwald, P., and Davies, J. N. P. (1971), “Tonsillectomy and Hodgkin’s Disease: The Lymphoid Tissue Barrier,” Lancet, 1, 431–432.
- Wolfe, F. M. (1982), “Problem-Centered Approach to Teaching Medical Statistics,” in American Statistical Association Proceedings of the Section on Statistical Education, 201–206.
- Woolson, R. F. (1987), Statistical Methods for the Analysis of Biomedical Data, New York: John Wiley.
Appendix 1:
Topics Covered in “Epidemiology/Biostatistics”
Case 1: Comparison of two independent groups with observations measured on an ordinal, interval, or ratio scale
Statistical Topics: Design of experimental studies, scales of measurement, descriptive statistics, graphical displays (box plot, stem-and-leaf plot), linear model for a completely randomized design, t test for independent samples, Satterthwaite approximation, Cochran and Cox approximation, testing the equality of variances (F test for equality of variances, Bartlett’s and Levene’s tests for homogeneity of variances), testing the normality of residuals (box plot, stem-and-leaf plot, normal probability plot, Shapiro-Wilk W statistic), data transformations, one-way ANOVA, Wilcoxon-Mann-Whitney test (Wilcoxon rank-sum test, Mann-Whitney U test, Kruskal-Wallis test with two groups), point and interval estimates for the mean and median difference between groups
SASÒ Statistical Procedures: GLM, NPAR1WAY, RANK, TTEST, UNIVARIATE
Case 2: Comparison of two matched groups with observations measured on an ordinal, interval, or ratio scale
Statistical Topics: Linear model for a randomized complete block design, t test for paired samples, testing the normality of differences, Wilcoxon signed-rank test, sign test, Friedman’s test, point and interval estimates for the mean and median difference between groups
SASÒ Statistical Procedures: GLM, UNIVARIATE
Case 3: Comparison of two independent groups with observations measured on a dichotomous scale
Statistical Topics: Design of observational studies, chi-square test of homogeneity, Fisher’s exact test, attributable risk, relative risk, odds ratio, point and interval estimates for the difference in proportions between groups, point and interval estimates for the relative risk and odds ratio, comparison of odds ratios from independent 2 × 2 tables (Mantel-Haenszel procedure, Breslow-Day test)
SASÒ Statistical Procedures: FREQ
Case 4: Comparison of two matched groups with observations measured on a dichotomous scale
Statistical Topics: McNemar’s chi-square test, Cochran-Mantel-Haenszel statistic, odds ratio, point and interval estimates for the odds ratio, point and interval estimates for the odds ratio, point estimate for the difference in proportions between groups, interval estimates for the proportions at risk when only one member of the pair is exposed
SASÒ Statistical Procedures: FREQ
Case 5: Prediction of a continuous response variable from a continuous design variable
Statistical Topics: Scattergrams, simple linear regression, testing the significance of model parameters, testing the normality of residuals, confidence interval for a predicted response, comparing regression equations, test for lack of fit, Pearson’s product-moment correlation coefficient
SASÒ Statistical Procedures: CORR, PLOT, REG
Case 6: Prediction of a dichotomous response variable from a continuous design variable
Statistical Topics: Cumulative distribution function, logit transformation, logistic regression, testing the significance of model parameters, confidence interval for a predicted proportion, point and interval estimates for the odds ratio, Hosmer-Lemeshow goodness-of-fit test
SASÒ Statistical Procedures: LOGISTIC, PLOT
Case 7: Estimation and comparison of survival curves
Statistical Topics: Censored data, estimation of survival from grouped and ungrouped data, product limit (Kaplan-Meier) method, life table (actuarial method), using plots to test model assumptions (S plot, LS plot, LLS plot), confidence intervals for proportion surviving at each time point, comparison of two survival curves (generalized Wilcoxon rank-sum test, logrank test, likelihood ratio test)
SASÒ Statistical Procedures: LIFETEST, PLOT
Case 8: Measures of association and agreement for observations measured on a nominal, ordinal, interval, or ratio scale
Statistical Topics: Chi-square test of independence, measures of association, Kendall’s tau, Spearman’s rank correlation coefficient, Pearson’s product-moment correlation coefficient, measures of agreement, sensitivity, specificity, prevalence, predictive value, Cohen’s kappa statistic, Bland- Altman plots
SASÒ Statistical Procedures: CORR, FREQ, PLOT
Appendix 2:
SASÒ Program for the Coyote Trap Example