Abstract
Statistics educators have previously noted that university students experience some difficulty in knowing when to use statistical concepts that they have encountered in their courses. In the present study, statistics educators were asked to rate the importance of various descriptive and inferential statistical procedures for inclusion in introductory statistics courses for the behavioural sciences. Items describing research situations and presenting sample data were written, each item representing a different statistical procedure. A sample of 23 undergraduate and postgraduate students enrolled in various departments in two universities in Melbourne, Australia was presented with these items. Students attempted as many of these items as they could within a 45-minute period. They were asked to identify which procedure(s) they considered appropriate for answering the research question, to justify their choice, to state other choices they had considered and rejected, to express their level of confidence in their choice, and to rate their familiarity with the various procedures. Quantitative and qualitative data are reported, and provide detailed confirmation that the skill of identifying appropriate statistical procedures in new situations is indeed difficult. Error patterns have been identified that provide a basis for some alternative approaches to teaching this skill.
1. Introduction
1.1 The Central Problem
1 The opening sentences of a recent paper by CitationQuilici and Mayer (1996) identify the central problem being investigated in the present research:
Students in introductory statistics courses are expected to solve a variety of word problems that require using procedures such as t test, chi-square, or correlation. Although students may learn how to use these kinds of statistical procedures, a major challenge is to learn when to use them (p. 144).
CitationBradstreet (1996) makes a similar observation: statistics students “often are able to manipulate definitions and algorithms with apparent competence, and yet not reveal, to their teachers or themselves, that they would not know what to do if faced with a real world problem” (p. 73).
2 CitationSchau and Mattern (1997) offer a more elaborate exposition of the same idea:
We, and many other statistics instructors, routinely observe a critical weakness in post-secondary students who have taken applied statistics courses: they lack understanding of the connections among the important, functional concepts in the discipline. Without understanding these concepts, students cannot effectively and efficiently engage in statistical reasoning and problem-solving. They remain novices. They have “isolated” knowledge about various concepts; for example, they may be able to calculate a standard deviation and a standard error. However, they do not understand how these concepts are related (and distinguished) and so make application errors, such as using one concept when they should have used the other. Some students recognize their lack of connected understanding and will say things like “I can solve a problem using the t-test when I know I’m supposed to. But otherwise I don’t have a clue” (p. 91).
3 We label this difficulty as the problem of learning to apply statistics, i.e., the problem of developing the capability of selecting statistical tests and procedures which are appropriate for analysing data in any given research situation. CitationWare and Chastain (1991) have previously labelled this capability selection skill.
1.2 The Importance of the Capability
4 CitationAnderson and Loynes (1987), in a book on the teaching of statistics, observe that “concern with the skills needed to apply theoretical knowledge to real problems has never received much attention”; these authors argue that statistical training ought not to “ignore the problem of making real connections with practice” (p. ix). Their book devotes a chapter to the aims of statistics education that presents a systematic listing of general abilities which a statistics course might be expected to develop. Some aims are non-technical (e.g., “to work successfully with others”); some are partly technical (“to determine the aims of an investigation and its framework, e.g., how the data are defined and collected”). Others are technical: “to recognise which techniques are valid and/or appropriate” (pp. 20-24).
5 It is the assessment of this aim that is the focus of the present study. We recognise that this is a narrow focus, and that the ability to apply an appropriate statistical procedure to a research problem is only one of many capabilities that a university course in statistics would seek to achieve. Nevertheless, we regard it as an important capability, especially for those students who wish to undertake quantitative research in their field. CitationWare and Chastain (1991), whose research is discussed in more detail below, argue that selection skills are important if students are to use the information in a statistics textbook effectively.
6 With that said, we recognise that the problem of learning to apply statistics should not be regarded as isolated or easily separable from the wider and more challenging issues involved in teaching statistics effectively. CitationSnee (1993) argues that ways must be found to make the teaching and learning of statistics more relevant and meaningful; others have noted that many students experience emotional reactions when encountering statistics courses. The preface to a recent and innovative textbook (CitationDiekhoff 1996) expresses well some of the affective aspects of beginning the learning of statistics:
After nearly 20 years of teaching statistics I can count on one hand the students who took the course as an elective! Indeed, the common denominator of students beginning their study of statistics is dread. I understand this. I haven’t forgotten the confusion and frustration that I felt as I struggled through my own first course in statistics (p. xv).
1.3 Previous Research
7 CitationGarfield and Ahlgren (1988) review numerous studies showing that students have difficulty in using statistical reasoning and in solving statistics problems even after exposure to instruction. However, research in the area is rare. CitationWare and Chastain (1991) comment that “the literature on teaching statistics is sparse” (p. 219), while CitationShaughnessy (1992) in his masterly overview of research in probability and statistics notes the low level of involvement of North American mathematics educators in research on teaching and learning in this field.
8 Few studies have been found which provide evidence on students’ difficulties with applying statistical procedures to new situations. CitationWare and Chastain (1989) compared students learning statistics with the aid of a computer-based teaching program with a “traditional” group. Various cognitive and affective measures were employed, among them a multiple-choice test of selection skills. A typical item would present a research situation, sample data, and a statement of the research question, followed by four multiple-choice options listing various statistical procedures. No significant difference was found between the two groups. What is noteworthy is the relatively poor performance of both groups: a mean of 3.7 (out of 10 items) for the computer group, 3.2 for the traditional. (Random guessing would lead to an expected mean score of 2.5.) The authors note that the low scores might
reflect teachers’ failure to emphasize selection skills. A common practice is to teach statistical tests one at a time. We know of only a handful of introductory statistics teachers who expect students to select appropriate statistical tests for a variety of circumstances. Some might argue that teaching selection skills is not central to a statistics course because students can select the proper test from a book. However, the absence of guidelines for selecting suitable statistical tests can limit the effective use of a book (p. 226).
9 In a later study, CitationWare and Chastain (1991) employed a similar test (with only eight items) to evaluate the effect of deliberately teaching selection skills to students. A class in which the instructor emphasised selection skills performed significantly better than a control class not exposed to such emphasis. Widespread use of computers in statistics, these authors noted, had minimised the need for teachers to demonstrate computational procedures. Teachers might therefore “better use the available time for teaching students when to use a test, rather than simply teaching computational procedures and statistical tests one after another” (p. 219). The authors also reported (not surprisingly) that students with higher grade point averages performed better on the test.
10 More recently, CitationQuilici and Mayer (1996) conducted an experimental study of how students categorise statistics word problems, with the content of the stimulus material carefully controlled. Their twelve items consisted of four research situations (involving the weather, typing, mental fatigue, and reading) crossed with three types of appropriate statistical test (t-test, chi-squared, correlation). Their study focussed on the ways in which students drew upon knowledge of prior examples to categorise the stimulus items. These researchers argued that students need to learn how to “ignore the cover story in word problems and instead focus on the experimental design and whether the variables are quantitative or categorical” (p. 158). (We would comment that it is not so much a matter of ignoring the cover story, since data always have to be understood within a realistic context; rather, it is a matter of educating students not to be misled by irrelevant information in the cover story.)
2. Design of the Present Study
2.1 Context
11 The present study was an investigation of the capabilities of students in the behavioural sciences (e.g., psychology, education, nursing education) who have studied statistics subjects, sometimes for one or two semesters but most frequently for three years, as part of their program. For these students, statistics is an applied discipline, a tool for understanding research literature and perhaps (later) conducting their own research, rather than a “pure” academic discipline in its own right. The statistics courses they have taken invariably include basic descriptive statistics (measures of central tendency, variability, correlation) and varying amounts of inferential statistics. These courses generally aim to develop students’ computational skills, sometimes with conceptual understanding of underlying theory and sometimes without, sometimes through the use of computer packages and sometimes not.
2.2 The Design of the Present Study
12 Our study resembles those of CitationWare and Chastain (1989, Citation1991) and CitationQuilici and Mayer (1996) in some respects, but differs from them in others. Our aim was similar: to investigate how well students who were presented with a description of a research problem could select an appropriate statistical procedure for analysing it. The stimulus materials were also similar: the earlier researchers also presented students with a set of items describing various research situations and data. In other respects, the studies differ. The Ware and Chastain studies utilised a multiple-choice test; this is a convenient and objective method, but it lacks authenticity, since real-world research problems do not come packaged with multiple-choice answers. The Quilici and Mayer study reported an experiment in which characteristics of the stimulus materials were carefully controlled; their set of stimulus items covered only three statistical tests, a consequence of their experimental design; like Ware and Chastain, they employed objective data-gathering procedures which focussed on behavioural outcomes (sorting sets of cards, selecting a statistical test). In the present study, in contrast, we investigated students’ ability to categorise a wide range of statistical situations. Students were required to recall rather than recognise an appropriate test.
13 We consider that a crucial behavioural indicator of the capacity to categorise is the ability to name a statistical procedure which is appropriate for a given research situation. This ability is considered important, since it is a prerequisite for looking up an appropriate formula in a statistics text, or for selecting an appropriate procedure from the menu of a computer package. In the present study, qualitative (structured interview) as well as quantitative methods were employed in an attempt to explore the reasoning processes which students used to justify their selection and to identify the nature of the difficulties that they displayed in grappling with the task.
2.3 Choice of Statistical Topics To Be Investigated
14 A list of 34 statistics topics was compiled, consisting of statistical tests and procedures commonly found in introductory statistics texts and journal articles in the behavioural sciences. This list was constructed partly from a list reported in a study of the most common statistical procedures cited in the American Educational Research Journal over a five-year period (CitationGoodwin and Goodwin 1985), and partly from the first author’s own experience over 16 years as a teacher of statistics to postgraduate education students.
15 In order to check on the curricular validity of these topics, the list was emailed to subscribers to the EDSTAT- L network, an international group of people interested in statistics education. The number of subscribers to this network is unknown to us, but is presumably in the hundreds. Some are academic staff, some are students, while others are high school teachers of statistics. The invitation to participate requested responses from academic
staff who had “taught or co-ordinated a university statistics course in the behavioural sciences or education” (email message, 8 September 1997). Participants were asked to rate the importance of each of the 34 topics in a statistics course aimed at second- or third-year undergraduates taking courses in the behavioural sciences or education. A five-point rating scale was used (Essential, Very important, Important, Relatively unimportant, Unnecessary). Altogether, seven replies were received. In addition, four local academics responded by fax or mail to a personal invitation to participate. The topics, mean ratings and standard deviations are presented in , in decreasing order of rated importance. An entry in the final column indicates that this topic was tested. The letter codes refer to the items listed in Appendix 1; numbers in parentheses, not used during the study for reasons explained later, have been added here to facilitate location of the items in the Appendix.
Table 1. Importance of Statistics Topics
16 yields few surprises. Descriptive statistics and the more commonly used inferential statistics received high ratings. Lower ratings were given to rarely used statistics (semi-partial correlation, Sandler’s A), to more complex, multivariate parametric statistics (MANOVA, path analysis, cluster analysis, discriminant analysis), and to nonparametric inferential statistics (Kruskal-Wallis, Friedman, Mann-Whitney, Wilcoxon, sign-test, Fisher exact test). Several of these are still regarded as moderately important (with mean ratings around 3). It is worth noting that the vast majority of the entries (27 of the 34) received mean ratings above 3.00.
2.4 Items for the Interview Phase
17 The curricular validity phase of the project was carried out concurrently with the writing of the stimulus items to be used in the interview study. The findings in were used to guide the construction of the final set of items. A few items reflecting topics rated as low in importance were discarded, and additional items were written on topics rated as important. The salient word here is guide: although nonparametric inferential statistics generally were rated as low in importance, two items (on Mann-Whitney and sign-test) were retained in order to investigate students’ understanding of the relationship between levels of measurement and appropriate statistics.
18 Items consisted of an introductory paragraph describing a research situation followed, in most cases, by some illustrative data. provides an example. The complete list of 21 items is in Appendix 1.
(6) Item CF: Cat Food
A pet-food manufacturer obtains ten pairs of kittens, each pair coming from one litter. In a trial of a new-formula cat-food, one kitten in each pair is fed on a diet of Superkat, the other a diet of Powerpuss. The table shows the gain in weight (in grams) of each kitten after a week.
Figure 1. Illustrative Interview Item.
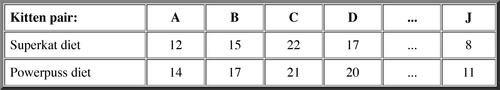
What statistical test(s) are appropriate for investigating whether there is a significant difference between the two types of cat-food?
2.5 The Sample
19 This was a small-scale study on a low budget, and it was therefore necessary to limit the sample to those students who could quickly be enlisted as volunteers through personal contacts with academic staff. (The students were genuine volunteers; our university’s ethics procedures preclude the use of any form of coercion to bring about participation in a research study.) Although the sample was small and obviously not random, we attempted to include in it a representative set of university students at various levels of education. The sample consisted of 23 students (17 female, 6 male) at two universities in Melbourne, obtained with the cooperation of academic staff involved in teaching statistics to students of psychology or education. Most students had completed six semesters of statistics as part of their degree program. Some students were in their early twenties, while others were mature-age students. Twelve students were enrolled in their final (third) year of undergraduate study; seven were pursuing a fourth-year graduate diploma program; three were taking a master’s course (two through course-work, one by research thesis) and the remaining student was enrolled in a Ph.D. degree. As the data to be presented later indicate, the 23 students varied widely in their levels of statistical knowledge.
2.6 The Interview
20 Interviews were conducted with students individually. Each session lasted for approximately one hour, divided into about five minutes of introduction, 45 minutes of interview as the student worked through the items and ten minutes of follow-up and debriefing. In the first few minutes, the purpose of the research was explained; the student signed a consent form, and the interviewer outlined the nature of the questions that would be asked.
21 Students were then presented with the items, one at a time. They were asked to state which statistical procedure they would be most likely to use to answer the research question. They were invited to “think out loud” and explain the reason for their answer. The interviewer also asked several probing questions:
| • | How did you decide? Which information in the item alerted you to that choice? What will the test tell you? | ||||
| • | Was it difficult to decide? Which information in the item made it difficult? | ||||
| • | Did alternative possibilities come to mind? Why were they rejected? | ||||
| • | How confident are you about the decision you made? Was anything about the item ambiguous? How confident are you out of 100? | ||||
Sometimes the interviewer would follow up a student’s comment by asking further questions.
22 Each item had been printed on a separate sheet of paper, inserted in a plastic cover and mounted in a ring binder, in the order shown in Appendix 1. As each item was presented, the interviewer’s questions and the student’s answers were tape-recorded. The interviewer wrote the item code letters and the student’s selected statistical test and confidence rating for each item on a response sheet.
23 As anticipated from an earlier pilot run, 45 minutes was insufficient to allow each student to answer all 21 items in the set. Full coverage of all items would have required about two hours, and this was considered to be an excessive demand upon the time of volunteers. To ensure therefore that all items would receive approximately the same number of responses, successive interviews began at different points in the set, e.g., with S1 (Student 1), the interview began with the first item, S2 with the sixth item, S3 with the eleventh item, and so on. The deliberate use of separate pages and code letters rather than item numbers meant that students were unaware that they were beginning in the middle of a sequence of items. (The numbers next to each item code in Appendix 1 have been inserted here so that readers may locate them easily; they did not appear in the material shown to students.) In the final few minutes of the hour session, students were given a version of the list of 34 statistics topics used in the earlier curricular validity phase of the study, and asked to rate how familiar they were with each of the listed topics. A five-point rating scale was used:
| • | 5: It’s very familiar and I would have no difficulty deciding when to use it. | ||||
| • | 4: It’s pretty familiar, but I would not be absolutely certain about when to apply it. | ||||
| • | 3: I recognise it, but I would not know when to apply it. | ||||
| • | 2: It rings the vaguest bell, but I certainly would not know when to apply it. | ||||
| • | 1: I have never even heard of it. | ||||
24 No material other than the items was presented to the students during the interview. Students did not have access to lists of names of statistical procedures until they answered the familiarity question. One student, however, had brought along a statistics text and consulted it at one stage of the interview.
3. Quantitative Findings
25 There were substantial variations within the sample in the numbers of items that students read within 45 minutes, in the proportion of those items that were answered correctly, and in their ratings of their confidence.
3.1 Number of Items Read and Answered
26 Students varied widely in the number of items read in 45 minutes (mean 10.9, s.d. 3.2, range from 6 to 17). In some instances, students read an item, indicated that they did not know, and moved on to the next item without offering an answer. The mean number of items for which students offered an answer was 8.6 (s.d. 3.4), with a range from 3 to 17. The cyclical presentation of the items ensured that all items received responses from about the same number of students (12 for nearly all items, with one item receiving 11 responses and the remaining item 13).
3.2 Responses to Items
27 Students’ responses to the various items were assessed as fully correct (an appropriate statistic was identified, named, and justified), partly correct (some conceptual understanding was displayed, together with some errors or omissions), incorrect, or don’t know. Of all the items read by all students, 25.3% were answered fully correctly, 15.7% partly correctly, 37.8% incorrectly, while the remaining 21.3% were left unanswered. Ratings of familiarity with the various statistical topics encompassed the full range from 1 to 5, with a modal response of 4 (“pretty familiar but not absolutely certain”).
3.3 Items Answered
28 Most students offered answers to between 8 and 12 items (out of the 21) in the session, but there were four outliers: S15 (15 items) and S1, S2, and S8 (17 each). The large number of answers offered by these four fast- working students did not serve as an indicator of the knowledge they possessed: there was no relationship between number of attempts and performance. On the one hand, S8, a master’s course-work student who had worked as a research assistant in psychology, answered 8 items fully correctly, the best performance (in terms of total number correct) of the whole sample, and S15, an undergraduate, succeeded on 6. On the other hand, S1 and S2 (both undergraduates) correctly answered 2 and 0, respectively, out of 17.
3.4 Fully Correct Answers
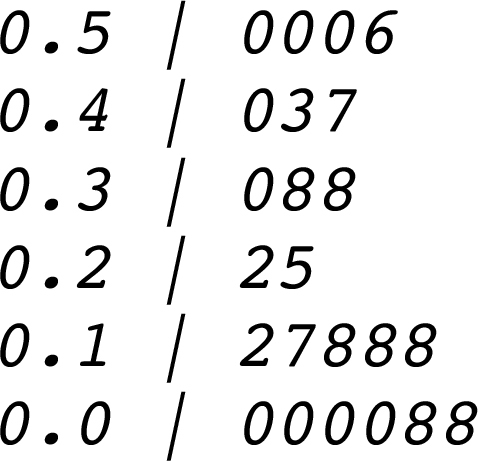
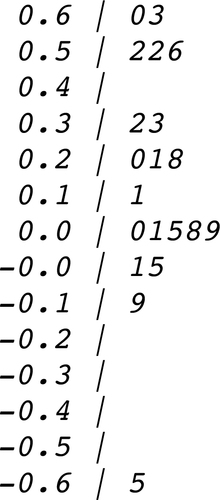
29 Numbers of fully correct answers varied from zero (S2, S11, S16, S19) to 8 (S8, already mentioned), with only 1, 2, or 3 correct responses being typical. Expressed as a proportion of items attempted, the proportion correct varied from zero to 0.56 (S23, who attempted 11 items). A stem-and-leaf plot of the proportions of correct responses is presented in . In round figures, the probability of any student correctly answering any item varied from zero up to a half, with a mean of a quarter; however, the distribution was positively skewed, and most students performed quite poorly. We recognise that the small sample size and the diverse background of the students make it difficult to generalise accurately to a wider population, but contend that the data are sufficiently clear for us to draw the following conclusions with some confidence. The findings point to a serious discrepancy between the students’ self-reports of their familiarity with the concepts and their actual ability to use them correctly. The findings also confirm previous literature reports that this is indeed a difficult task for most students.
Figure 2. Stem-and-Leaf Plot of Proportions Correct.
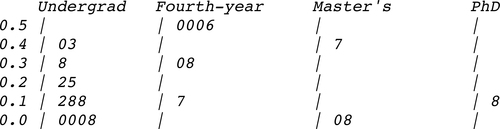
30 It will be recalled that the sample in this study was a heterogeneous one, with half the students being undergraduates and the remainder being fourth-year, master’s, or doctoral students. Do students in the various levels differ in their performance? The question can be answered by disaggregating the data in . It will be seen () that in general, the fourth-year students were among the better performers, and the undergraduates among the poorer performers. This finding is not surprising, since admission into fourth-year programs is highly selective, with prior performance in undergraduate courses a major selection criterion. Of the five students displaying the best performance, four were fourth-years, and one was the master’s student with experience as a research assistant. The finding is consistent with Ware and Chastain’s (1991) earlier report of a positive relationship between selection skill and grade point average.
Figure 3. Proportions Correct by Year Level.
31 The relatively poor performance of the other three postgraduate students may come as a surprise. As the numbers of postgraduates in the sample is very small, not too much should be made of this. Some individual biographical data may, however, illuminate the unexpected finding. The Ph.D. student had not studied statistics for ten years; one of the master’s students had severe emotional problems with statistics, and another was a master’s course work student in education who had probably studied far less statistics in her undergraduate program than the undergraduate psychology students in the sample.
3.5 Confidence Ratings
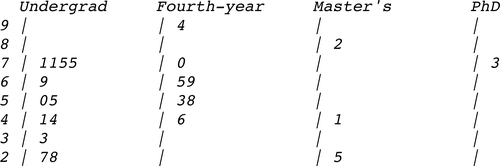
32 Students were asked to rate their confidence (on a 0 to 100% scale) in answering any item. Their mean confidence rating was found, across all items for which an answer was offered. (Don’t know answers were excluded from this calculation, since it was obviously pointless to ask students how confident they were if they answered in this way.) The mean rating can be taken as a general (trait) indicator of that student’s level of confidence. The ratings varied widely, from 94% (S18) down to 25% (S19). A stem-and-leaf plot of the ratings is presented in , while displays the same data, disaggregated by year level. Although the differences are not marked, the median confidence rating of the fourth-year students is higher than that of the undergraduates, as one might expect for a group that have been selected on the basis of successful academic achievement.
Figure 4. Stem-and-Leaf Plot of Mean Percentage Confidence Ratings.

Figure 5. Confidence Ratings by Year Levels.
3.6 Relationships Between Confidence and Performance
33 What is the relationship between students’ ratings of their confidence and their performance on the items? This question, apparently simple, can actually be answered in several different ways, depending upon the precise way the question is asked and upon the corresponding choice of an appropriate statistical design. One way to ask the question is, “Do students who generally display a higher level of confidence tend to answer a larger proportion of items correctly?” This question can be answered by finding the correlation between students’ mean confidence ratings and the proportion of items correct. This is a between-subjects design.
34 Perhaps one might expect this correlation to be strongly positive, although a study by CitationProhaska (1994) would indicate that perhaps the relationship is not so simple after all. Prohaska categorised advanced psychology students on the basis of their cumulative grade point average into high-, medium-, and low-GPA groups. He asked students to estimate their final course grade and their level of confidence (on an 11-point scale) in their estimation. Over-estimation was far more common than under-estimation or correct estimation; lower-ability students tended to over-estimate far more frequently than higher-ability students do. All three groups were, on average, rather confident about their estimates, with the high-GPA students being slightly but significantly (p <.05) more confident than the low-GPA students.
35 In the present study, a scatterplot (not included here) of students’ mean confidence ratings (across all the items they attempted) plotted against the proportion of those attempts that were correct shows a positive, but weak, linear relationship between the two variables. The correlation was only moderate (r = 0.36), which for a two-tailed test (df = 21) falls short of significance at the .05 level (critical value, 0.41). Certainly, there were students like S18 who performed relatively well (proportion correct, 0.50) and were highly confident (mean rating, 94%), but even in this case, some of the confidence was misplaced, since he was incorrect on half the items. At the lower end of the distribution, there were students like S2 who displayed a justifiable lack of confidence (no correct answers, 27% confidence). However, the weak correlation is explained by the presence of students such as S11, who displayed totally misplaced confidence (none right, 69% confident) and others like S23 who was the best performer (proportion correct 0.56) but was only 53% confident about her answers. The findings suggest that most of the students in the sample held mistaken beliefs about the extent of their own statistical knowledge. The weak positive relationship between confidence and performance is in line with Prohaska’s findings.
36 However, the question about the confidence-performance relationship can be asked in a quite different way, as a question about individuals. For any particular student, the question becomes, “Is there a tendency for students to express higher levels of confidence on items they get correct?” This requires a within-subjects design, and was answered by finding the correlation, for each student separately, between their confidence rating of a particular item, and their performance on that item (scored 2 for completely correct, 1 for partly correct, 0 for incorrect). Two students’ data had to be discarded, since they displayed no variance in their scores. The correlations for the remaining 21 students are displayed in .
Figure 6. Correlations Between Individual Confidence and Performance.
37 Apart from the problem of the limited range of possible scores for each item, this analysis also suffers from a truncation of range problem: if a student read an item but passed over it because the answer was unknown, no confidence rating was obtained. Further, the individual correlations were based on small numbers of responses (between 5 and 17 items) and are obviously not highly reliable. While we recognise all of these limitations, it is still possible to conclude that the correlations are generally weak, and that there is wide variation. If we assume that confidence ratings are an indicator of meta-cognitive self-awareness (“I know what I know and I know what I don’t know”), our findings would indicate that most of the students in the sample did not seem to possess such self-awareness. Only a few students seemed to be good judges of their own knowledge. Of the five students displaying individual correlations above 0.50, four were also well above the median in performance (S7, S18, S8, S9, proportions correct 0.50, 0.50, 0.47, 0.38, respectively). This analysis helps to explain the moderate correlation of 0.36 obtained earlier with the mean confidence ratings: for about a quarter of the sample (generally more able students), the confidence-performance correlation is moderately strong, but the correlation is attenuated by the weak relationship among the remainder of the sample.
38 One final method of probing the relationship is to take each confidence/performance data pair, pool them into a single data set, and then find the correlation. This answers the question, “Do students in the sample generally display higher confidence ratings on items they answer correctly?” Pooling the data in this way yielded 192 data pairs; the correlation was 0.23 (two-tailed test, p < .01). In line with the earlier findings, the correlation between confidence and performance, although significant here, is again quite weak.
3.7 Responses to the Various Items
39 The responses to the 21 items, together with students’ confidence ratings and their ratings of familiarity with the topic, are summarised in , in order of increasing item difficulty (decreasing frequencies of correct responses). It is interesting to note that there is a high correlation between the rank order of the entries in this table and the rank order of the importance ratings in (Spearman rs = 0.71). There was hardly any commonality of membership between the instructors who rated the importance of the topics and the instructors who taught the students in the sample. A plausible interpretation of the high correlation is that university statistics instructors in Australia and the United States hold similar views about the importance of the topics, and place more emphasis in their courses (class time, homework exercises, assessment weightings) on the more important topics.
Table 2. Item Responses: Correct, Confidence, and Familiarity
4. Qualitative Findings
4.1 Common Patterns of Difficulty
40 Qualitative findings in the form of summaries of responses to each item are presented in Appendix 2. Several patterns of difficulty, some cognitive and some affective, can be identified in these findings:
| • | Misinterpretation of the research question, | ||||
| • | Inability to name a known procedure, | ||||
| • | Difficulties in recognising the measurement level of the data, | ||||
| • | Responding inappropriately on the basis of familiar verbal cues, Difficulties in interpreting slightly unusual forms of data presentation, and | ||||
| • | Emotional factors which may inhibit learning. | ||||
4.2 Misinterpreting the Research Question
41 Several students misinterpreted the research question, so that the selected statistical method would actually answer a different question from that posed in the item. A clear example is displayed by S13, who classified Item CF(6) (t-test for correlated samples) as an ANOVA problem. She regarded the ten pairs of cats as ten independent samples. If ANOVA were to be applied to such data, the analysis would tell whether there were significant differences in weight gains among the various pairs of cats, but not whether there was a significant difference between the two diets. On Item HT(5) (testing simple regression), S16 proposed using a t-test “because we’re looking for an association between factors.”
42 Item DM(2) (Pearsonr) presented columns of values on two different variables; S21 proposed finding the means and using an “independent t-test.” Several students answering Item GI(19) (testing multiple correlation) displayed an inability to identify the nature of the research question, confusing the search for an index describing the strength of a relationship with the search for differences, or with the wish to make predictions.
4.3 Knowing the Procedure Without Knowing Its Name
43 Some students could identify the appropriate procedure but were unable to name it. S13, for example, read Item AB(4) and quickly recognised that an appropriate test was an inferential statistic that dealt with ranked data. She had access to the textbook used in her course, quickly turned to the chapter at the end on nonparametric statistics and pointed to the section on the Mann-Whitney U-test. S17 responded to Item HT(5) (the simple regression item) and recognised that “something extending from a correlation” was required to “predict using a line (like best fit) based on a certain score,” but was unable to name the procedure.
44 For others, the inability to name an appropriate procedure was associated with an extremely low level of performance during the interview. The clearest example is S9, who attempted 11 items without being able to name even one procedure correctly. She stated that she could not put a name to the theory or the steps involved while answering the items. However, she claimed that she could examine the process, what needed to be done, what needed to be compared, and then use her resources including lecture notes to find the appropriate information. (This student also displayed emotional problems in learning statistics; see below.) S14 correctly named two statistical procedures out of eleven, and mentioned that he had “a general problem remembering the names of tests, but not a comprehension problem.” He said that he could work out what was wanted, and “then look up various possibilities and use a process of elimination.” S4, who correctly answered only one of 12 items, explained that his difficulty in remembering the names of procedures arose as a result of the computer package used to analyse data not requiring him to possess such information.
4.4 Difficulties in Identifying the Appropriate Level of Measurement
45 The ability to determine whether the data in a research problem are nominal (categorical), ordinal, or interval/ratio is clearly a crucial one in learning to apply statistics. Some students displayed difficulty with this. Chi-squared tests, for example, can be used only on frequency counts of nominal data, while t-tests and ANOVA require data in the form of scores which at least approximate interval properties.
46 In Item MA(1) (ANOVA), the data presented were achievement test scores, yet S18 called the data “categorical.” In Item SH(12) (chi-squared test of association), S14 displayed no awareness of the nature of the data and proposed using a t-test, while S2 admitted that she “didn’t know how to handle the data.” Similarly, in Item TC(7) (Spearman r), S5 made no mention of the nature of the data and was unable to elaborate her answer: “correlation … don’t know which kind … I only know one kind.” S1 displayed a similar difficulty. For Item RA(11) (t-test), S19 proposed using chi-squared “to see if it is significantly different from the mean”; it is possible that this reflects a nomenclature problem, but nothing in her answer indicated awareness of the interval nature of the data.
4.5 “Triggering” of Incorrect Responses by Familiar Words or Forms of Data Presentation
47 Occasionally, students would note key words and phrases, or observe a familiar form of data presentation, that would lead them to an incorrect response. This phenomenon is mentioned in Appendix 2 in connection with Item II(13) (Fisher z transformation) where students seized upon the words “significant difference” or “observed and expected values” to offer “t-test” or “chi-squared” as their answers.
48 In Item SH(12) (chi-squared), S2 noted the word “association” and answered “correlation … that’s how you measure association.” S1 looked at the table included with this item, commented that it caused him some doubt, but then treated it as an ANOVA problem. Conversely, S12 looked at the table in Item MA (ANOVA) and said that it was a “chi-squared 2 × 2” problem.
4.6 Unusual Forms of Data Presentation
49 Students occasionally found an item difficult because the physical layout of the sample data was apparently unfamiliar. For example, S23 stated that in the one-way ANOVA item, the horizontal listing of the values within each treatment level, rather than the more conventional vertical listing within columns, made the item awkward to read and ambiguous. Similarly, in the t-test for correlated samples item, the presentation of the matched pairs as columns rather than the usual rows may have contributed to the difficulty that some students had in identifying the appropriate statistical procedure.
4.7 Affective Factors in Applying Statistical Procedures
50 The emotional aspects of learning statistics were noted in the introduction to this report. During the interviews, several students made statements and displayed behaviour that indicated clearly that the task had emotional overtones for them. S7 stated that he had little experience in using the statistics he had learned, and he felt that his own confidence was low. S5 similarly commented on her lack of confidence; during one item, she stated that she was “frustrated with herself” because she couldn’t recall the procedure, while in answers to other items she referred to her “phobia” for statistics; she also referred to her frustration at the contradiction between her getting top marks for statistics assignments and her inability to answer questions during the interview easily and quickly. S9 also lacked confidence in the interview, and started off feeling confused by the “mass of words and figures,” although she claimed that at home, with resources available, she would be able to answer the questions. While attempting the one-way ANOVA item, she said that her ability to absorb information and think critically was obstructed by anxiety. S4, who had reported his difficulty in remembering the names of statistical procedures, mentioned during debriefing that he had felt “stupid” during the interview.
51 S19 reported having suffered serious emotional abuse over her statistical ability by a supervisor, who had called her an “idiot” and doubted her capacity for post-graduate work. She stated that she felt panic and paralysis of thought and could not respond to the items with any confidence. She attempted eleven items and was unable to offer fully correct answers to any of them. She could recall the name of only one statistical test, chi- squared, and tended to offer this repeatedly as an answer.
5. Implications for Teaching
52 The findings of the present study confirm the extreme difficulty of the task. The items were adapted from material used as illustrative examples or homework exercises in typical university statistics texts (or written in a style resembling such material). The students had completed courses in which most of the procedures had been taught, and students generally claimed that they were quite familiar with these procedures. Yet the probability that any student could correctly identify an appropriate procedure for any item is about 0.25. Clearly, if an important goal of statistics education is the development of the ability to use, independently, the statistics one learns at university, then there is enormous scope for improvement. Perhaps, in introductory courses, more time could be spent on giving students opportunities to practise this skill; such time might be found by reducing the number of topics taught.
53 How to improve the teaching and learning of this skill is a question worthy of extensive further research. Although not specifically concerned with this skill, CitationSnee (1993) expresses a more general concern of many statistics educators that all is not well with the teaching of statistics at university level. Greater use should be made of knowledge from the behavioural sciences in order to enhance learning; statistics educators “need to deepen our understanding of how people learn” (p. 150). This, Snee argues, is not merely a matter of cognition. Learning has an affective component: people will study something only if they see value in it. CitationShaughnessy (1992) similarly calls for more “cooperative research efforts between psychologists and mathematics/statistics educators” (p. 490).
54 The present study has focussed solely on the assessment of students’ abilities and therefore sheds no direct light on how the ability to apply statistics might be enhanced. However, a few suggestions drawn from the research literature and from statistics texts may prove fruitful in the meantime:
| • | Employ a “concept map” (“decision tree”) to provide an overview of all the decisions that must be made in choosing an appropriate test. CitationSchau and Mattern (1997) advocate the use of concept mapping to help students visualise the relationships between statistical ideas. Texts by Andrews, Klem, Davison, O’Malley, and CitationRodgers (1981) and CitationDiekhoff (1996) contain material of this kind. Diekhoff presents this material as the final chapter of his statistics text, intended no doubt as an effective summary of the central concepts of the book (which it certainly is). However, the chapter could possibly also be valuable as an advance organiser right from the beginning of a course. | ||||
| • | Place more emphasis on learning to identify the number of variables involved in a research situation, and the nature of the research question. This advice parallels that of CitationQuilici and Mayer (1996); CitationDiekhoff (1996) makes these attributes central to his decision-tree approach. | ||||
| • | Give more practice at identifying the types of variable (i.e., the level of measurement) in a research situation. CitationAnderson and Loynes (1987), in their book on the teaching of statistics, emphasise the importance of students being “aware of the various kinds of measurement – to distinguish counts from continuous variables and so on – since some techniques are inappropriate for some kinds of data” (p. 24). CitationRunyon, Haber, Pittenger, and Coleman (1996), whose statistics text the first author uses in his own class, recognise the importance of this advice by devoting a chapter specifically to this topic (Ch. 15, “Statistical inference with nominal data”). CitationQuilici and Mayer (1996) also emphasise that students need to learn “whether the variables are quantitative or categorical” (p. 158). | ||||
| • | Educate students to avoid making decisions simply on the basis of key words and familiar forms of data presentation. | ||||
| • | Emphasise the importance of knowing accepted names (including synonyms) for statistical procedures in order to be able to use textbook indexes and computer package menus correctly and efficiently. | ||||
| • | Use items of the kind employed in this study as a basis for workshop exercises for training in this skill. Textbooks generally fail to include such exercises. It is of course eminently logical to place exercises on correlation in the chapter on correlation and exercises on ANOVA in the chapter on ANOVA. However, such forms of presentation offer little opportunity for students to learn to choose an appropriate procedure when research problems arise (as they do in the real world) outside their textbook settings. | ||||
| • | Encourage students to build up a personal portfolio, drawn from published research, textbook exercises, or their own creative writing, of research scenarios, annotated with comments reflecting understanding of the research question being asked, the nature of the data, or any special conditions requiring an unconventional procedure. CitationKeeler (1997) offers detailed advice on the use of portfolios; she notes that these can provide evidence of students’ capacity to “engage in authentic or real-world tasks which are worth doing” (p. 170). | ||||
| • | Invite students to participate in projects in which they design the data-gathering instrument and gather the data themselves; the instructor then draws upon the dataset at various points in the course to exemplify the use of various statistical procedures (CitationThompson 1994). CitationStarkings (1997) also favours the use of projects which may involve either the analysis of a given dataset, or the gathering of data to answer a given research question; she argues that such projects require students to make decisions about what statistics to use. CitationMcBurney (1995) advocates posing a series of research problems throughout the course and giving students a week or two to propose appropriate research designs. In a similar vein, CitationDunn (1996) favourably evaluates a teaching strategy in which pairs of students design an experiment, collect and analyse the | ||||
| • | data, and write it up; much emphasis is placed on process writing in which ideas are continually outlined, drafted, and revised. | ||||
| • | Employ interesting and genuine examples for motivational purposes. Although their article is not centrally concerned with the ability to apply statistics, CitationAnderson, Brewer, and Davis (1996) argue for the use of genuine case studies drawn from sport and social psychology to illustrate the use of statistical methods. They cite a study in which chi-squared was used to demonstrate that racial considerations influenced the playing positions of US footballers and baseballers. Arguing along similar lines, CitationDerry, Levin, and Schauble (1995) place value on authenticity by emphasising “cultural relevance and social activity” (p. | ||||
| • | 53) in teaching statistics, rather than “decontextualised lectures” and the analysis of “contrived data” (p. | ||||
| • | 54). CitationSnee (1993) argues, similarly, that statistics educators “must change the content and delivery of statistical education to enable students to experience the use of statistical thinking and methods in dealing with real-world problems and issues” (p. 153). | ||||
55 The first author is currently adopting a few of these approaches in his course, one of them for the first time (the use of the Diekhoff decision tree as an advance organiser into which to fit new procedures as they are encountered in the course).
Acknowledgments
This research was supported by a grant from the Research Committee, Faculty of Education, Monash University. The willing cooperation of staff and students in the two universities that participated in the study is gratefully acknowledged. The project (No. 97/363) was approved by the university’s Standing Committee on Ethics in Research on Humans on 16 September 1997. The authors also acknowledge the helpful comments of the three anonymous reviewers on an earlier version of this article.
References
- Anderson, M. B., Brewer, B. W., and Davis, S. F. (1996), "Sport and Exercise Psychology in the Undergraduate Curriculum," Teaching of Psychology, 23(1), 40–42.
- Anderson, C. W., and Loynes, R. M. (1987), The Teaching of Practical Statistics, Chichester: John Wiley.
- Andrews, F. M., Klem, L., Davison, T. N., O'Malley, P. M., and Rodgers, W. L. (1981), A Guide for Selecting Statistical Techniques for Analyzing Social Science Data (2nd ed.), Ann Arbor, MI: The University of Michigan Institute for Social Research.
- Bradstreet, T. E. (1996), "Teaching Introductory Statistics Courses So That Nonstatisticians Experience Statistical Reasoning," The American Statistician, 50(1), 69–78.
- Derry, S., Levin, J. R., and Schauble, L. (1995), "Stimulating Statistical Thinking Through Situated Simulations," Teaching of Psychology, 22(1), 51–57.
- Diekhoff, G. M. (1996), Basic Statistics for the Social and Behavioral Sciences, Upper Saddle River, NJ: Prentice Hall.
- Dunn, D. S. (1996), "Collaborative Writing in a Statistics and Research Methods Course," Teaching of Psychology, 23(1), 38–40.
- Garfield, J., and Ahlgren, A. (1988), "Difficulties in Learning Basic Concepts in Probability and Statistics: Implications for Research," Journal for Research in Mathematics Education, 19, 44–63.
- Goodwin, L. D., and Goodwin, W. L. (1985), "Statistical Techniques in AERJ Articles, 1979–1983: The Preparation of Graduate Students to Read the Educational Research Literature," Educational Researcher, 14(2), 5–11.
- Keeler, C. M. (1997), "Portfolio Assessment in Graduate Level Statistics Courses", The Assessment Challenge in Statistics Education, eds. I. Gal and J. B. Garfield, Amsterdam: IOS Press, pp. 165–178.
- McBurney, D. H. (1995), "The Problem Method of Teaching Research Methods," Teaching of Psychology, 22(1), 36–38.
- Prohaska, V. (1994), "`I Know I'll Get an A': Confident Overestimation of Final Course Grades", Teaching of Psychology, 21(3), 141–143.
- Quilici, J. L., and Mayer, R. E. (1996), "Role of Examples in How Students Learn to Categorise Statistics Word Problems", Journal of Educational Psychology, 88(1), 144–161.
- Runyon, R. P., Haber, A., Pittenger, D. J., and Coleman, K. A. (1996), Fundamentals of Behavioral Statistics (8th ed.), New York: McGraw Hill.
- Schau, C., and Mattern, N. (1997), "Assessing Students' Connected Understanding of Statistical Relationships", The Assessment Challenge in Statistics Education, eds. I. Gal and J. B. Garfield, Amsterdam: IOS Press, pp. 91–104.
- Shaughnessy, J. M. (1992), "Research in Probability and Statistics: Refiections and Directions", Handbook of Research on Mathematics Teaching and Learning , ed. D. A. Grouws, New York: MacMillan, pp. 465–494.
- Snee, R. D. (1993), "What's Missing in Statistical Education?," The American Statistician, 47(2), 149–154.
- Starkings, S. (1997), "Assessing Student Projects", The Assessment Challenge in Statistics Education, eds. I. Gal and J. B. Garfield, Amsterdam: IOS Press, pp. 139–151.
- Thompson, W. B. (1994), "Making Data Analysis Realistic: Incorporating Research into Statistics Classes," Teaching of Psychology, 21(1), 41–43.
- Ware, M. E., and Chastain, J. D. (1989), "Computer Assisted Statistical Analysis," Teaching of Psychology, 16(4), 222–227.
- Ware, M. E., and Chastain, J. D. (1991), "Developing Selection Skills in Introductory Statistics," Teaching of Psychology, 18(4), 219–222.