Abstract
The statistical power of an experiment is a subtle idea that is difficult to explain to a non-statistician, and yet it is fundamental to the design of scientific experiments. We have developed some spreadsheets that have been useful in illustrating the ideas by simulation. These allow scientists to simulate situations using parameters similar to what they expect in their own work, and to explore the effect of experimental variability. Our examples are available on the World Wide Web.
1. Introduction
1 Perhaps the greatest difficulty in presenting statistical ideas is the need to consider simultaneously variation and uncertainty at many levels. In a classical comparative experiment, we need to have in mind the variation in the variables observed as well as variation in the potential sets of results plausible under different scenarios or hypotheses. We must also accept the uncertainty, expressed via confidence or Bayesian posterior probabilities, in the conclusions of an experiment. When designing an experiment, there is added to these a consideration of the variation among potential experimental conclusions, relative to what the truth might be. This comes naturally to those accustomed to thinking statistically, but presents a substantial obstacle to others.
2 At Biomathematics and Statistics Scotland, we regularly provide scientists with help and training in experimental design. A fundamental question in any experimental planning is that of sample size. This is usually addressed via some sort of power calculation. In explaining what this involves, the difficulties of multiple levels of variation inevitably arise. In our experience, confusion about the different roles of the significance level and the power of the experiment, and their association to observational variability and number, is inevitable. This continual need to explain these concepts has led us to exploit the power of spreadsheets to simulate experimental situations.
3 The wide availability and ease of use of spreadsheets for data handling has attracted wide interest in their use in statistical education (CitationElliott and Starkings 1994, CitationHunt 1994). They now form an integral part of many statistics courses (see, for example, CitationFillebrown 1994; CitationHall 1995) . Their uses are discussed by CitationHunt (1996) and Currall (1996) . They are considered in the context of other tools for students learning statistics by CitationLudbrook (1995) . A page of resources is maintained at URL http://www.mailbase.ac.uk/lists/assume/files/.
4 Our experience indicates that their main advantages are
| • | They come with a well-developed easy-to-use interface. | ||||
| • | Scientists are usually already familiar with spreadsheets, using them for data entry and manipulation. | ||||
| • | Course participants seem to expect that statistics will be less frightening and intimidating when conducted in the environment of a spreadsheet. As a result, they are more likely to sign up for courses. | ||||
5 Against these must be set the main disadvantage:
| • | Although adequate for teaching and doing basic statistical analyses, the abilities of spreadsheets are severely limited. There is a danger that scientists with data requiring more complex analyses will persist in using spreadsheets when more specialist statistics programs are appropriate. Some statistics programs can be configured to act as extra menus in a spreadsheet, and this may help alleviate the problem. | ||||
A good review of these, and other, advantages and disadvantages is given by CitationNash and Quon (1996).
6 We illustrate our use of spreadsheets with two examples. The first is intended to help explain the idea of experimental power, and to convince scientists of the reality of experimental variability. The second does the same in a more complex situation, where analytical evaluation of experimental variation is intractable. These spreadsheets do not provide power calculation, only demonstration. For calculation, students are referred to tables or other computer programs. It has recently been argued (CitationGatti and Harwell 1998) that such programs are easier for students than tables or charts, and our experience supports this.
2. Spreadsheet for the Power of the Two-Sample t-Test
7 The basic idea of experimental power can best be illustrated in the case of the two-sample comparative experiment, which leads to an analysis by a Student’s t-test. The spreadsheet illustrated in was developed in Microsoft Excel. It shows all the parts of the experiment, including the “truth,” the experimental data, the analysis and a diagram.
Figure 1. Simulation of a Two-Sample Comparative Experiment.
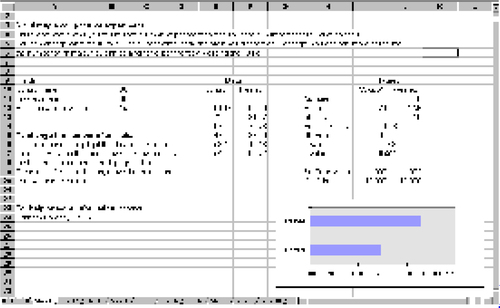
8 This spreadsheet is intended to illustrate the concepts of experimental power to scientists working on animal nutrition, and so the experimental units are referred to as animals, and the two groups as control and treated. This can very easily be changed. The spreadsheet allows rapid exploration of the effect of changing experimental parameters:
| • | The simulation can be repeated as often as wished by pressing a single function key. Updating appears instantaneous. | ||||
| • | The “truth” (control and treatment means and standard deviations) can be changed. | ||||
| • | The number of animals is easily changed by selecting and dragging with the mouse. | ||||
9 Instructions are provided on the spreadsheet. This is an environment with which scientists will be familiar, as it is the usual way for experimental data to be entered and manipulated. It is also used for straightforward statistical analyses. Users can easily customise the spreadsheet by changing not only the experimental parameters but also the descriptions, the reference to animals, and the appearance of the chart.
3. Exploring a Dose-Response Experiment
10 The issue in the comparative experiment illustrated above was fairly simple: Does the treatment have an effect? The spreadsheet shown in addresses a more complex question.
Figure 2. Simulation of a Dose-Response Experiment.
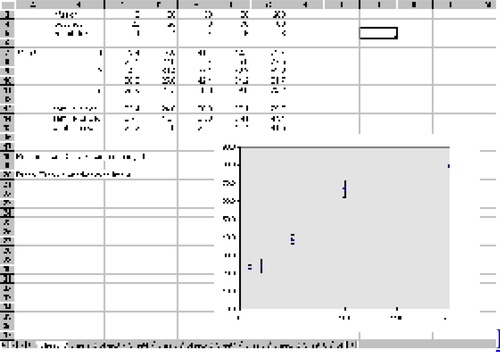
11 Here, animals are given infusions of different amounts of a compound, and its effect on blood metabolites is studied. There is interest in the dose-response curve. The issue of whether this is linear or sigmoid is one question to be examined in an experiment. However, it is not clear whether the modest number of animals to be used means that the data will allow this to be resolved. Trying to answer this analytically would be very demanding. The spreadsheet allows the effect of differing sample sizes, likely response levels, and between- animal variability to be explored in an interactive way. These parameters can be easily changed, and the experiment repeated many times by pressing a function key. With only a little more effort, additional dose levels can be added, or existing ones deleted.
4. Construction of the Spreadsheets
12 The construction of these spreadsheets makes use of two of their most powerful features: the ability of cells to contain formulae referring to other cells, and automatic updating when these are changed. The use of the “fill handle,” whereby a formula in cells can be extended to other cells, is very useful, both for creating the spreadsheets, and as a tool to allow the user to change the sample size. Data were simulated using the uniform random number generator and the normal inverse function, scaled by the content of the “truth” cells. The analysis was constructed using appropriate formulae, and the charts based on the analysis and data summary.
5. Discussion
13 The spreadsheets are used in classroom teaching and one-to-one consultancy discussions. For classroom situations, where the concept of power is being explained, the t-test spreadsheet is used. It is preceded by an explanation, along traditional lines, of the power of an experiment: Type I and type II errors are introduced, and the interdependence of the test significance level, experimental power, true biological response, and sample size described. Tables for doing these calculations are offered. Usually it becomes apparent that too many abstract ideas are being presented for most of the audience to feel they understand it. Asking if anyone can say what, for example, “90% power” is quantifying does not produce any good answers. At this point, the spreadsheet is introduced as a way of illustrating power. Participants are then invited to experiment with it (in a classroom with PCs), and encouraged to try adapting the “truth” to values plausible in their own experimental work. Discussing the simulations with participants as they do this makes it clear that understanding has much improved.
14 The dose-response spreadsheet is an example of one that would be useful in a consultancy discussion where a scientist is seeking help in designing a new experiment, where the power calculations involved are not easily pursued using available tables or computer programs. Scientists generally say they find the spreadsheets helpful in appreciating the extent of experimental variability, and the meaning of statistical power. It is not unusual for there to be some dismay that their intended experimental size (limited by cost) will only be able to detect quite large responses. A common additional comment is something along the lines that they would make it very easy to fake the data!
7. Availability
15 The spreadsheets are available at the following URLs:
T-test: http://www.amstat.org/publications/jse/secure/v7n1/esim2.xls
Dose-response: http://www.amstat.org/publications/jse/secure/v7n1/r5.xls
Acknowledgment
This work was supported by the Scottish Office Agricultural Environment and Fisheries Department.
Addendum (added July 6, 1999)
Volume 7, Number 2, of the Journal of Statistics Education contains a Letter to the Editor concerning this paper. The spreadsheet for the t-test was revised slightly by the author in response to this letter.
Original t-test spreadsheet: http://www.amstat.org/publications/jse/secure/v7n1/esim.xls
References
- Currall, J. (1996), “Excel in Statistics” [Online]. (http://www.stats.gla.ac.uk/cti/activities/reviews/96_11/excel/intro.html)
- Elliott, G., and Starkings, S. (1994), “The Use of Spreadsheets for Teaching Statistics at Degree Level” in Proceedings of the Fourth International Conference on Teaching Statistics, Vol. 1, p. 140.
- Fillebrown, S. (1994), “Using Projects in an Elementary Statistics Course for Non-Science Majors,” Journal of Statistics Education [Online], 2 (2). (http://www.amstat.org/publications/jse/v2n2/fillebrown.html)
- Gatti, G. G., and Harwell, M. (1998), “Advantages of Computer Programs Over Power Charts for the Estimation of Power,” Journal of Statistics Education [Online], 6 (3). (http://www.amstat.org/publications/jse/v6n3/gatti.html)
- Hall, A. G. (1995), “A Workshop Approach Using Spreadsheets for the Teaching of Statistics and Probability,” Computers & Education, 25(1-2), 5-12.
- Hunt, N. (1994), “Teaching Statistics Using a Spreadsheet” in Proceedings of the Fourth International Conference on Teaching Statistics, Vol. 2, p. 432.
- —– (1996), “Teaching Statistics with Excel 5.0” [Online]. (http://www.stats.gla.ac.uk/cti/activities/reviews/96_05/excel.html)
- Ludbrook, J. (1995), “Microcomputer Statistics Packages for Biomedical Scientists: Opinion,” Clinical and Experimental Pharmacology and Physiology, 22(12),976-986.
- Nash, J. C., and Quon, T. K. (1996), “Issues in Teaching Statistical Thinking with Spreadsheets,” Journal of Statistics Education [Online], 4 (1). (http://www.amstat.org/publications/jse/v4n1/nash.html)