 ?Mathematical formulae have been encoded as MathML and are displayed in this HTML version using MathJax in order to improve their display. Uncheck the box to turn MathJax off. This feature requires Javascript. Click on a formula to zoom.
Abstract
The First International Conference on the Teaching of Mathematics was held in Samos, Greece, in July 1998. Presentations by the attendees reflected a recent debate on reforms of the mathematics curriculum and related pedagogy. Chief among these was a greater emphasis on connecting the mathematics curriculum with applications, to make courses in mathematics more "relevant" to students. This manuscript notes that mathematicians tend to teach students to approach data analysis in a constructive manner, proceeding from an understanding of the basic science, while statisticians concentrate on reductive approaches, whereby models are generated upon consideration of the data themselves. It is suggested that departments of mathematics and statistics will need to adopt a new spirit of cooperation, and partner with colleagues in application areas, if curricular enhancements in either domain are to have a reasonable chance at success.
1. Introduction
1 In Lynne CitationBillard’s (1998) recent discussion of “The Role of Statistics and the Statistician,” she laments that many of our academic, business, and governmental leaders and colleagues are still “unversed in the statistical method.” Most of these persons are former students who were missed during the primary window-of-opportunity for such training: their formative undergraduate years. Some took “hated” courses in statistics. Others avoided statistical training altogether. Dr. Billard reiterates an opinion shared by many of us, that reforms to address this multifaceted problem continue to be needed throughout the statistics curriculum. In particular, she states
… it is also my belief wholeheartedly that to train our students for the 21st Century, it will be necessary for the often exclusively theoretically based program to move toward what we might call an “applied theoretical” and/or an “applied-applied” emphasis to remain viable, rather than the reverse (p. 321).
2 While it is true that we statisticians could do a better job of popularizing the statistical method to our students and to society, most of today’s statistics curriculum is taught outside the context of departments of statistics. Many students take statistics courses offered by departments of psychology, nursing and medicine, economics and business, engineering, chemistry, and so on. These are often taught by faculty with Ph.D.’s in their respective fields and with substantial practical experience in statistical application, but without degrees in statistics itself. Other students are introduced to statistics under the umbrella of a mathematics curriculum. CitationLoftsgaarden and Watkins (1998) report in the same issue of The American Statistician that 76.1% of students taking a statistics course in the fall of 1995 through undergraduate programs in the mathematical sciences were enrolled in courses offered by departments of mathematics. While many of these faculty do have Ph.D.’s in statistics, the fact that their courses are part of a mathematics curriculum suggests that curricular reforms in other areas of mathematics will play an important role in determining the success or failure of reforms introduced at the undergraduate level by statisticians.
3 This summer I was one of two or three statisticians (if one counts the chemist) who had the opportunity to attend the First International Conference on the Teaching of Mathematics, on the island of Samos, Greece. There I learned that the field of mathematics is undergoing a great degree of upheaval, with many potential repercussions for the field of statistics. Mathematicians are seeking to reverse the declines in enrollment in mathematics courses, estimated at about a 9% decline between 1990 and 1995 for courses given at four-year colleges and universities (CitationLoftsgaarden and Watkins 1998). During the same time period, statistics enrollments in mathematical sciences programs have increased 26%. Consequently, the traditionally theoretical field of mathematics is currently undergoing a crisis of identity, with many mathematicians calling for curricular reforms that would stress to their students the relevance of mathematical training. The reforms discussed in Samos were directed at students at many levels, from elementary school to graduate education. Of the reforms directed at undergraduate education, many were directed towards students seeking degrees in partially or wholly quantitative natural and social sciences.
4 Many of the participants at the Samos conference emphasized the use of mathematical modeling, particularly computer- or calculator-oriented modeling, either as a pedagogical tool for illustrating mathematical concepts and enhancing understanding, or as the end goal of mathematics instruction. Proponents of this approach argue that participatory modeling of real world phenomena, especially in the context of a wider curriculum, is a viable way to transmit a mathematical toolbox while creatively involving students in the subject material (CitationMumford 1997). Opponents fear a corresponding loss of mathematical rigor, often characterized as “the death of the proof.” They argue that the study of “pure” mathematics has instilled in generations of lay persons a healthy respect for logic, as well as assisted many an insightful scientist. Thus, they caution, the possibility that such changes will seriously undermine the value of mathematics education cannot be lightly ignored (CitationKlein and Rosen 1997)
5 The reforms being discussed and implemented today bring mathematics educators solidly into the realm of problems that have been the traditional domains of statisticians and practitioners of so-called “applied mathematics.” It is interesting to note that as late as the early 1990s, most mathematics departments did not encourage the practice of applied mathematics. Few undergraduate or graduate programs with concentrations in applied mathematics were available. Those that existed were poorly funded. Students with a primary interest in applied mathematics were drawn instead to programs in engineering, physics, economics, and other applied fields, as well as to statistics. I was one of these students. After completing a master’s degree in mathematics at the University of Pennsylvania in 1990, I elected to complete graduate work in statistics at the University of Chicago, in part because other opportunities to practice applied mathematics were limited.
6 We statisticians should applaud the reform-minded mathematicians who seek to increase the relevance of mathematical training to their students by increasing the applied content of their courses; however, both we and they should be careful not to seek curricular reforms exclusively of each other. Mathematicians and statisticians tend to approach the same problem in different ways, using different sets of tools. Both sets of tools are relevant to problem-solving, and each approach can inform the application of the other. This observation will be developed below in the context of modeling data on the chlorosity of the IJssel lake. Thus, it is very important that statistics and mathematics curricular reformers work together to instill in their students a commitment to both sets of approaches.
2. Constructionism vs. Reductionism: An Example
7 A fundamental difference in philosophy seems to exist between current mathematical and statistical approaches to modeling applications, although I forthrightly admit that my observation is derived substantially from personal experience as opposed to rigorously collected data. Mathematicians involved in mathematical modeling seem to place greater emphasis on functional forms than do statisticians. Their concentration is focused on the overall relationship in the data that is to be described, and tends to exclude from analysis the stochastic nature of the leftover deviations of the data from the model. Applied mathematicians are trained to be constructionists, preferring the creation of reasonable models from consideration of the underlying science to immediate consideration of data. On the other hand, many statisticians today are primarily trained to be reductionists, preferring to generate a model from the observed data, perhaps illumined by a small subset of scientific considerations, instead of dealing with the full-scale intricacies of the underlying science. The data-driven approach requires that statisticians place greater emphasis on the stochastic components of their models, which allow a means to reasonably evaluate the importance of deviations of the data from the model structure. I hypothesize that this difference in modeling philosophy – constructionism vs. reductionism – is fundamental to understanding what tools can be acquired by students of mathematics and statistics courses, respectively. The exposure of an undergraduate student to one or the other philosophy during formative undergraduate years may have much to do with acceptance or rejection of the “statistical method.”
8 To illustrate this difference, consider the following example from the conference proceedings, which uses a constructionist approach to solve a modeling problem (Citationvan Herwaarden 1998, pp. 299-300):
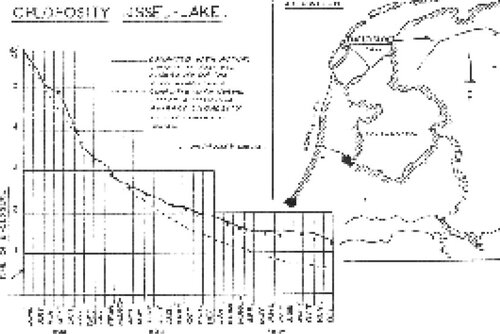
A nice example illustrating the use of differential equations concerns the effects on the chlorosity of the IJssel-lake (the Netherlands) caused by the construction of the Enclosure-dam. In 1932 the Enclosure-dam closed of [sic] the Zuiderzee (a lagoon) from the sea. The chlorosity of the water of the resulting lake, named IJssel-lake, gradually decreased because of the inflow of fresh water from the river IJssel (a branch of the river Rhine). The decrease of the chlorosity can be described with the following simple model. The IJssel-lake contains V m3 water with chlorosity c(t), depending on the time t of that has elapsed since the completion of the Enclosure-dam. There is an annual inflow of A m3 water from the river IJssel with a constant chlorosity a, and an annual outflow of A m3 water with chlorosity c(t) through the sluices with in the Enclosure-dam. Assuming that the water in the IJssel-lake is well-mixed and that other effects (like precipitation and evaporation) cancel out, we obtain the differential equation
describing the rate of change of the total amount of salt in the IJssel-lake. Solving this equation using the data V=13x109 m3, A=13x109 m3/year, c(0)=5.9 kg/m3 and a=0.1 kg/m3 the solution is obtained
In spite of the many simplifications this model very well described the decrease of the chlorosity in the IJssel-lake during the first year after the completion of the Enclosure-dam. In the second year, though, the measured chlorosity values were higher than those calculated with the model, see the figure. This was due to the very dry and warm summer of 1933, causing the rainfall not to compensate the evaporation. After correction for this effect the model and the measured values were again in good agreement.
9 The author also provided the graphic shown in Figure 1 to illustrate the situation.
Figure 1. IJssel-Lake Chlorosity Measurements.
10 Unfortunately, the author does not present his second and better analysis, which incorporates the effect of the very dry and warm summer of 1933. Instead of speculating as to the exact form of that model based on the science, the data are re-explored using a different analytic perspective. The data were first reconstructed based on a computer scan of Figure 1 (see ).
Table 1. Approximate IJssel-Lake Chlorosity Measurements
11 Were this problem to cross the desk of a statistician in the context of a data analysis problem, the results of statistical modeling might be reported as follows:
A nice example illustrating the use of transformations in a regression analysis concerns the effects on the chlorosity of the IJssel-lake (the Netherlands) caused by the construction of the Enclosure- dam. In 1932 the Enclosure-dam closed off the Zuiderzee (a lagoon) from the sea. The chlorosity of the water of the resulting lake, named IJssel-lake, gradually decreased because of the inflow of fresh water from the river IJssel (a branch of the river Rhine).
The relationship between chlorosity and time is decidedly nonlinear and looks like it might be well described by an exponential function. We transformed the response to the log scale, and, to enhance the interpretability of model estimates, we also transformed the date variable so that 6/1/32 was day 0 in our analyses. Initially we modeled the log of water chlorosity as a linear function of time as follows:
where
We generated the residual plot (Figure 2), which suggested that a quadratic component was missing from our model. Addition of a quadratic term substantially improved the fit of our model to the data.
Inspection of fit, residuals, and influence statistics suggested that no further alterations to the model were necessary. Thus, the decrease in chlorosity can be described by the following simple model:
where
Estimates of the parameters a, b and c were obtained using a linear regression package:
12 Figure 2 shows the residual plot on which basis the statistician decided to try a quadratic term in the model.
Figure 3 compares the three models against the data on the original scale.
Figure 2. Residuals vs. Fitted Values from Statistician’s First Model.
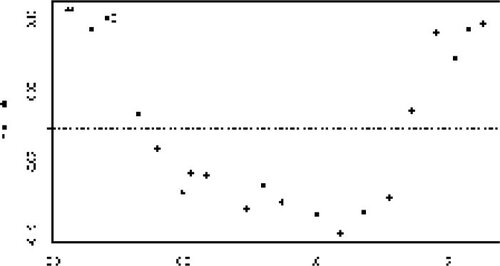
Figure 3. Comparison of the Three Models.
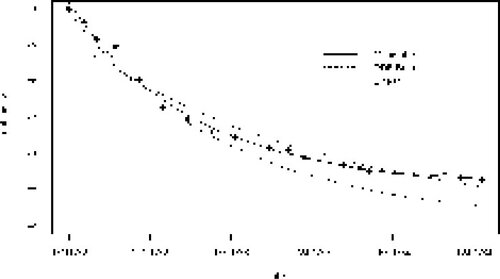
13 In this example, we see that the reductionist approach to data analysis, which argues for a reasonable model based on the observed data, may result in a better-fitting model for these data more quickly than does the constructionist approach.
3. Discussion
14 Even so, it would be inappropriate to conclude that the statistician’s modeling approach is simply superior to that of the mathematician. Comparisons of effort expended by the two analysts are meaningless, depending much more on the available assisting technology (for example, powerful and easy to use computer software) than on the methods. The mathematician’s analysis communicates a better understanding of the process whereby the water chlorosity changed than does the statistician’s. Especially note the lack of the mathematician’s additive constant (a = 0.1) in the statistician’s exponential model. Even though good science argues for the existence of this effect, the reductionist approach would overlook it because it is of insignificant additional importance relative to the fit already achieved by the quadratic exponential model. Its insignificance is due to its relatively small size in this particular problem; were similar data to be collected in a situation where inflow chlorosity were larger, say a = 0.5 kg/m3, the effect might be much more apparent. Still, the mathematician comes away from this exercise knowing that this is a necessary effect to consider. The statistician would have to revamp his entire analytic approach to incorporate it because a simple log transformation on the response to get a polynomial expression in terms of time would not be possible in the presence of the additional additive effect. Instead of being an exercise in transformation to polynomial regression, it would require more difficult nonlinear function fitting.
15 It is also evident that the statistician has greatly benefitted from a passive knowledge of differential equations that helps him intuit the structure of the problem. “The relationship between chlorosity and time is decidedly nonlinear and looks like it might be well-described by an exponential function.” Where does the intuition to use an exponential function come from? Of course, it comes from the differential equations that describe growth and decay. All good statisticians are aware of the exponential nature of growth and decay problems and immediately know to draw on the logarithm for assistance. In the context of regression, logarithms have additionally good statistical properties, such as being variance-stabilizing and reducing the influence of outlying points on the model fit.
16 Now consider what the mathematician stands to gain from the results of the statistical analysis. Because it is immediately evident that a quadratic term would substantially improve on the original model, the analysis encourages consideration of a revised differential equation and analogous reasoning. Again, it is hard to speculate exactly what model was explored to account for the effects of precipitation and evaporation. Indeed, changes in precipitation and evaporation may not be the only likely culprits. Another possibility is that the rates of inflow and outflow, A, are decreasing over time, a reasonable possibility if dry weather were having a prolonged effect on the inflow. Over this relatively short period of time, this change in rate might be approximated by a linear term, and thus one can obtain the revised differential equation
where the constant D reflects the decrease in the inflow and outflow currents. This differential equation would lead to the quadratic exponential form uncovered in the statistical analysis, with an additional constant added outside the exponent.
17 Although modifications that would improve the fit of a model to these data are easy to uncover and explore in this simple example, the process might be much more difficult in less well-understood modeling situations. Without the statistician’s approach to draw on, it might be less evident what steps are needed to better understand the deviations of a hypothesized model from the observed data. Arguably the most important skill taught in statistical training is that the deviations of the data from a model are often more important than the model itself. It is likely that this style of thinking is currently under-emphasized in the mathematics curriculum.
18 There is much to lose if mathematicians and statisticians do not partner in reforms of their individual curricula. Mathematicians may fail at substantially increasing the applied relevance of mathematical training. I base this fear on an observation drawn from attendance at the Samos conference, that the new emphasis on mathematical modeling belied a general lack of statistical awareness among the participants. A corresponding lack of statistical awareness in mathematical pedagogy would be a serious omission. In Samos, I was struck by the absence of practices that statisticians would consider mandatory. For example, evaluations of changes to teaching protocols or materials were mostly presented in raw numerical form, without so much as a t-test to help evaluate the nature of differences observed between study groups. In one session I suggested that a randomized controlled clinical trial design would be appropriate to evaluate the effectiveness of a new computer-based lesson plan. I was left speechless when a serious-minded gentleman responded that he did not believe in the results of clinical trials. Examples of mathematical models for various observable data were presented in multiple sessions. Few of these had stochastic components in them, and their evaluation did not include analyses of the deviations of the data from the models. When stochastic models were used, the probabilistic nature of these models remained mostly hidden. (I observed this multiple times in the case of models using Markov chains.) Thus, I found myself questioning the relevance of a certain pedagogical method, which does not seek to illuminate the nature of stochastic randomness in applied problems, for instructing students in techniques for modeling observable phenomena.
19 For mathematical pedagogy, the implications of the IJssel lake example are clear. As with the study of statistics, mathematics can expose students to models of a wide variety of observable phenomena, to offer them a broader experience base than is available in other academic programs. In this context, the field of mathematics can best contribute to students’ understanding of model structures, but it should be careful not to do so by tossing out the useful paradigm of stochasticity altogether. Also, many have observed that beginning students have a difficult time building constructionist models on their own. A greater sensitivity to reductionist tools might help students grasp difficult modeling principles more easily.
20 Contrarily, statistical training should focus more on the issues that determine model relationships, and less on the stochastic components that, at best, simply serve as useful means to probe a model’s weaknesses. It is a common observation among statisticians with mathematical backgrounds that most recently graduated non-Ph.D. statisticians lack the skills needed to construct functional model relationships, and we wonder whether our reliance on data-oriented thinking may be somewhat misplaced. There are few situations where a nonparametric model would be superior to an equally well-performing functional one that reflects scientific principles.
21 Truly what is needed is a hybrid pedagogical approach, that would seek to empower students with the tools to look at modeling problems from many angles. Mathematicians and statisticians should be encouraged to partner with colleagues in applied fields in order to provide students with effective, multidisciplinary training environments. This can be done at the university level through mathematics-across-the-curriculum initiatives, in which students of many fields acquire mathematical skills simultaneously with and in the context of their chosen studies. Smaller, more focused initiatives can also be successful. To the extent that applications enter mathematics and statistics coursework, individual faculty need to be sensitive to issues of analytic perspective as well. A reviewer suggested that mathematics faculty who are receptive to statistical ideas can take short courses offered by the Mathematical Association of America in conjunction with the American Statistical Association. These courses are directed especially at mathematicians who find themselves in the position of teaching statistics with no formal statistical training. The author is unaware of initiatives designed to communicate to statisticians the perspectives and methods of applied mathematicians. Perhaps the Institute of Mathematical Statistics should consider sponsoring such opportunities.
22 At the University of South Florida (USF), we are constructing a pilot interdisciplinary center that will focus on creation and application of techniques for the mathematical and statistical Modeling of Image-related Data Across the Sciences (MIDAS). MIDAS brings together researchers from across USF with interests in quantitative biology. Partnership with undergraduate and graduate programs across USF provides students with important multidisciplinary support and training opportunities in areas of growing importance to health research. One of our goals is to design a for-credit, multidisciplinary, bioinformatics internship at Moffitt that teaches students to model image-related data from many perspectives, thereby serving the needs of multiple academic programs. MIDAS also sponsors a multidisciplinary mathematical-modeling lecture series that seeks to enhance both research and learning environments. Faculty from across USF with expertise in mathematics, imaging, computer science, bioengineering, biology, medicine, bioinformatics, and statistics participate in center activities. Multiple USF departments, as well as collaborative studies and programs of the Moffitt Cancer Center, are represented.
23 Regardless of the cooperative mechanism chosen, one should strive to show students that there may be benefits to approaching the same analytic problem from multiple perspectives, and to give them experience in doing so. Such experience may help students better understand the relevance of quantitative fields to the bigger picture of their own educational direction and goals. Perhaps departments of mathematics and statistics will need to adopt a new spirit of cooperation if curricular enhancements in either environment are to have a reasonable chance at long-term success.
Acknowledgments
This work was partially supported by National Institutes of Health Grant 1-R03-AG15180-01. The author thanks Jerry Uhl, Bruce Pollack-Johnson, and Deborah Hughes-Hallett for helpful comments.
References
- Billard, L. (1998), “The Role of Statistics and the Statistician,” The American Statistician, 52, 319–324.
- Klein, D., and Rosen, J. (1997), “Calculus Reform – For the $Millions,” Notices of the American Mathematical Society, 44, 1324–1325.
- Loftsgaarden, D. O., and Watkins, A. E. (1998), “Statistics Teaching in Colleges and Universities: Courses, Instructors, and Degrees in Fall 1995,” The American Statistician, 52, 308–314.
- Mumford, D. (1997), “Calculus Reform – For the Millions,” Notices of the American Mathematical Society, 44, 559–563.
- van Herwaarden, O. A. (1998), “Teaching Mathematics for the Agricultural and Environmental Studies: The Use of Mathematical Applications,” in Proceedings of the International Conference on the Teaching of Mathematics, Samos, Greece, July 3–6, 1998, John Wiley & Sons, Inc., pp. 299–301.