Abstract
Previous research has linked perfectionism to anxiety in the statistics classroom and academic performance in general. This article investigates the impact of the individual components of perfectionism on academic performance of students in the statistics classroom. The results of this research show a clear positive relationship between a student's personal standards and academic performance consistent with the literature. Surprisingly, the inherent need of some students for organization and structure was found to be negatively related to academic performance. This finding suggests that the organization of statistics as perceived by some students may not always foster understanding, resulting in student confusion and lack of achievement. This infers that statistics instructors may need to put sufficient emphasis on the underlying composition of statistical ideas and the linking of statistical techniques that are presented in the classroom and in the textbook. The implications of these results are discussed in terms of current trends in the reform of the statistics curriculum and approaches that may improve the clarity of the underlying structure of statistics.
1. Introduction
Over the past decade there has been substantial research dedicated to the improvement of statistical education. Numerous articles have suggested changes in the use of technology (CitationMills 2002; CitationVelleman and Moore 1996; CitationMarasinghe, Meeker, Cook, and Shin 1996), pedagogy (CitationSedlmeier 1999; CitationMagel 1998; CitationSmith 1998), and content (CitationBordley 2001; CitationYesilcay 2000; CitationRinaman 1998). Existing studies have provided a wealth of information that has led to the successful transformation of many statistics courses. Additional research has been more focused on non-cognitive characteristics of the student that may alter the success of the student. Research in the area of attitudes towards statistics (CitationRoberts and Bilderback 1980; CitationWise 1985; CitationGal and Ginsburg 1994; CitationSchau, Stevens, Dauphinee, and Del Vecchio 1995; CitationDauphinee, Schau, and Stevens 1997) has led to the development and validation of instruments that can be used to measure preconceived feelings held by students. These instruments have been used to show that attitude and beliefs can play a major role in the success or failure of a student (CitationGal, Ginsburg, and Schau 1997). The findings of these studies have given instructors many beneficial insights into the hurdles that must be overcome within a student prior to successful statistics achievement.
CitationPacht (1984) noted that perfectionism is a prevalent characteristic in the general population. In an academic setting, perfectionism can lead to perceptions of a more difficult course, higher anxiety, and a more negative mood (CitationBrown, Heimburg, Frost, Markis, Juster, and Leung 1999). Perfectionism is considered an aspect of personality (CitationHabke and Flynn 2003), which is defined by CitationMillon (1996) as “a complex pattern of deeply embedded psychological characteristics that largely nonconscious and not easily altered, expressing themselves automatically in almost every facet of functioning.” In comparison, attitudes are defined as the “tendency to evaluate objects favorably or unfavorably” (CitationOlson and Maio 2003) and can be based on a set of beliefs. A favorable aspect of attitudes is that they are changeable (CitationPetty, Wegener, and Fabrigar 1997). Perfectionism, as a dimension of personality, is more intractable. Thus, the study of perfectionism and its role in the statistics classroom may give instructors an insight into a relatively rigid personality trait that can cause significant student dissention and increased difficulty in the dissemination of knowledge.
The intent of this study is to focus the development of the statistics course on the internal needs of students. It is believed that a better understanding of the inherent behavioral weaknesses of students may lead to more common use of instructional modes designed to overcome these weaknesses. A psychological refinement of statistics instruction may result in increased student comprehension, academic achievement, and utilization of statistics post graduation. This is accomplished by (1) analyzing existing literature and validated measures of perfectionism, and then (2) developing a refined model of the perfectionist's attributes and its relationship to performance in the classroom, by surveying statistics students. Finally, practical implications of the refined model are discussed and future directions for the statistics classroom are analyzed.
2. Literature Review
Perfectionism has been described as the tendency of individuals to set unrealistically high standards and then critically evaluate one's ability to achieve those standards (CitationFrost, Marten, Lahart, and Rosenblate 1990). Although the concept of perfectionism has been investigated for more than four decades, it was the concurrent efforts of separate research teams in the 1990s that have led to the multidimensional perfectionism measures commonly utilized today. CitationHewitt and Flett (1991) developed an instrument (HMPS; Hewitt Multidimensional Perfectionism Scale) that measured perfectionism based on three subscales: Self-Oriented Perfectionism (the setting of high expectations for oneself and the motivation to avoid failure), Other-Oriented Perfectionism (the setting of high expectations for others), and Socially Prescribed Perfectionism (the need to attain perceived high expectations of significant others). Independent research by CitationFrost et al. (1990) led to the development of the Frost Multidimensional Perfectionism Scale (MPS). The MPS measures perfectionism in six dimensions: Concern over Mistakes (CM), Doubts about Actions (D), Personal Standards (PS), Parental Expectations (PE), Parental Criticism (PC), and Organization (O). Both the MPS and the HMPS have been used extensively in the literature (CitationFrost, Heimburg, Holt, Mattia, and Neubauer, 1993; CitationFrost, Trepanier, Brown, Heimburg, Juster, Leung, and Makris, 1997;CitationCox, Enns, and Clara, 2002).
Much of the research involving perfectionism concerns the differentiation of positive and negative aspects of the trait. CitationHamachek (1978) identified individuals that set high standards and allow little leeway for mistakes as neurotic perfectionists, while those that set high standards and allow themselves some degree of latitude for not achieving those goals were labeled as normal perfectionists. Research by CitationEnns and Cox (1999), CitationFrost et al. (1993) and CitationHill, McIntire, and Bacharach (1997) isolated adaptive (healthy) and maladaptive (unhealthy) aspects of perfectionism, suggesting that some facets of perfectionism lead to higher performance and some lead to higher anxiety over performance. CitationFrost et al. (1993) identified separate adaptive subscales in the HMPS and the MPS, specifically labeling subscales Personal Standards and Organization from the MPS as a “positive striving” characteristic of perfectionism. In the original research, CitationFrost et al. (1990) also found that Personal Standards and Organization were negatively correlated with the frequency of procrastination, ascribing this to the possible planning of work strategies. CitationFlett, Blankstein, Hewitt, and Koledin (1992) and CitationFlett, Hewitt, and Martin (1995) determined that certain aspects of perfectionism can lead to the setting of unattainable goals and procrastination. The isolation of the impact of certain aspects of perfectionism was suggested by CitationFrost et al. (1990), who noted that in order to understand perfectionism, it is necessary to examine its dimensions separately. The individual aspects of perfectionism as measured by the MPS have been validated by CitationFrost et al. (1990) and CitationFrost et al. (1997).
Given the nature of perfectionism and its bidirectional effects on performance, it is surprising that very little research has been done on the impact of perfectionism in the college classroom. One such study by CitationBrown et al. (1999), involving female undergraduate students enrolled in an abnormal psychology course, found that the Personal Standards subscale of perfectionism was associated with improved academic performance on a subsequent exam when the individual scored higher than expected on an initial examination. Results of the study also indicated that, as a single dimension, Personal Standards was positively associated with overall academic performance as measured by GPA. Not unexpectedly, elevated levels of Personal Standards were linked with increased study time and time spent in discussion with instructors about grades. In a study of students enrolled in a second year psychology course, CitationBieling, Israeli, Smith, and Antony (2003) found that college students with higher levels of perfectionism set higher goals and were more likely to fall short. They also concluded that adaptive perfectionism was related modestly with performance and was positively associated with a preparedness attribute, which is consistent with the findings of CitationBrown et al. (1999). It appears that in the limited research involving college students, Personal Standards has been identified as a clear link of perfectionism to academic performance. Therefore, the first research question to be examined in this article is:
RQ1: Will increased levels of Personal Standards (PS) be associated with increased levels of academic performance as measured by the overall grade in an introductory statistics classroom?
Aside from the PS subscale of perfectionism, the connection to academic performance is not as clear. CitationBrown et al. (1999) did find that while higher levels of Concern over Mistakes were not predictive of lower performance, it did show higher anxiety and increased study habits, and perceptions of a more difficult course. Although Concern over Mistakes has been linked to anxiety over performance (CitationFrost, Turcotte, Heimburg, Mattia, Holt, and Hope 1995), no direct link to performance was found in their study of undergraduate social science students. In fact, CitationFrost et al.(1997) suggest that Concern over Mistakes plays no role in the frequency of mistakes. Thus, an additional research question to be examined in this article is:
RQ2: Will increased levels of Concern over Mistakes (CM) be associated with increased levels of academic performance as measured by the overall grade in an introductory statistics classroom?
There has been more success linking statistics anxiety among college students to perfectionism in the literature. CitationOnwuegbuzie, DaRos, and Ryan (1997) stated that statistics anxiety “occurs as a result of encountering statistics in any form or at any level” and may “involve a complex array of emotional reactions which have the propensity to debilitate learning” (CitationOnwuegbuzie and Daley 1999). CitationFeinberg and Halperin (1978) and CitationOnwuegbuzie and Seaman (1994) determined that many college students appear to have high levels of anxiety when confronted with the concepts, application, or education in statistics. Research by CitationOnwuegbuzie and Daley (1999) on graduate liberal arts students in a research methodology course established that individuals who had an elevated level of Other-Oriented Perfectionism or Socially Prescribed Perfectionism tended to have high levels of statistics anxiety. When trait anxiety and procrastination are controlled, Self-Oriented Perfectionism was also found to be linked to statistics anxiety in a group of undergraduate social science students (CitationWalsh and Ugumba-Agwunobi 2002). Statistics anxiety has been directly linked to academic performance in a graduate research methodology course (CitationOnwuegbuzie 1997) and high school math matriculation scores (CitationZeidner 1991). However, this relationship has not been established in undergraduate students and the direct link between perfectionism and academic performance has not been investigated.
Perfectionism has been shown to exist in certain college populations. CitationOnwuegbuzie and Daley (1999) found that graduate students in the social sciences exhibited extremely high levels of Self- and Other-Oriented Perfectionism. CitationWalsh and Ugumba-Agwunobi (2002) determined that undergraduates in the same discipline displayed similarly high levels of Other-Oriented Perfectionism, lower levels of Self-Oriented Perfectionism, and higher levels of Socially Prescribed Perfectionism. The extent of perfectionism outside of these college populations has not been established. However, given that perfectionism has been linked to factors that can affect academic performance and that perfectionism is an innate and relatively unchangeable aspect of the personality of some students, it would appear beneficial to understand its direct implications on student performance and the effectiveness of the statistics instructor. Furthermore, little research has been put forward that addresses the psychological barriers preventing students from excelling in a standard business college statistics course, an arguably different type of student than those enrolled in the standard mathematics or social science statistics courses.
This research intends to investigate the relationship of perfectionism of college business statistics students and academic performance. As previous studies of perfectionism in college students were done on non-business students, the measures of perfectionism must be checked for reliability on this population. Additionally, the relationships of perfectionism subscales Personal Standards and Concern over Mistakes to academic performance as established in the literature need to be retested in the population of interest via the proposed research questions. While this research does not consider any other specific link between perfectionism and academic performance, it is proposed that additional links be investigated for possible insights that may lead to instructional improvement.
3. Method
3.1 Measures
Perfectionism was measured via the 35-item Multidimensional Perfectionism Scale (MPS; CitationFrost et al., 1990). The MPS utilizes a 5-point Likert type measure ranging from 1 (strongly disagree) to 5 (strongly agree) and consists of six subscales (). As defined by CitationFrost et al. (1990): Concern over Mistakes (CM) refers to “negative reactions to mistakes, a tendency to interpret mistakes as equivalent to failure, and a tendency to believe that one will lose the respect of others following failure”; Doubts about Actions (D) is “the tendency to feel that projects are not completed to satisfaction”; Parental Expectations (PE) regards “the tendency to believe that one's parents set very high goals and are overly critical”; Parental Criticism (PC) concerns “the tendency of parents to engage in consistent, often critical, evaluation of their child, coupled with the child's tendency to place considerable value on these evaluations”; Personal Standards (PS) is the tendency to set “very high standards and the excessive importance placed on these high standards for self-evaluation”; and Organization/Order (O) is defined as “the importance of and preference for order”. Internal consistencies for these subscales were reported by CitationFrost et al. (1990) as ranging from 0.77 to 0.93. CitationEnns and Cox (2002), in a review of studies using the MPS, stated, “Collectively the studies reviewed…provide compelling evidence of the construct, concurrent, and discriminant validity of the Frost MPS”. Composite reliabilities for the six MPS subscales in this sample, calculated using the method recommended by CitationJöreskog (1971), were determined as 0.842, 0.658, 0.769, 0.784, 0.794, and 0.933 for CM, D, PE, PC, PS, and O respectively.
Table 1. Items and their primary subscale attribution on CitationFrost et al. (1990) Multidimensional Perfectionism Scale (MPS), CitationStöber (1998) four-factor MPS (MPS-4), CitationPurdon et al. (1999) three-factor MPS (MPS-3), and CitationCox et al. (2002) brief MPS (MPS-B)
Subsequent studies have challenged the number of subscales in the MPS and the arrangement of the items to subscales. CitationStöber (1998) argued for the existence of four rather than six perfectionism subscales stemming from the original Frost MPS instrument (). In the model proposed by Stöber, Concern over Mistakes and Doubts about Actions from the Frost MPS model were combined into a single factor named Concern over Mistakes and Doubts (CMD). In a similar manner, subscales Parental Expectations and Parental Criticism were aggregated into a factor named Parental Expectations and Criticism (PEC). All items as specified in the original Frost MPS instrument were retained without change and items preserved their allocation to subscales in their original or aggregate form. An apparent lack of unidimensionality within the subscales was noted - CitationStöber (1998) identified several items that had significant secondary loadings. This reorganization of the Frost MPS model will be referred to as the MPS-4 in this paper to signify the employment of four subscales. This arrangement was confirmed in a later paper by CitationStumpf and Parker (2000).
A three-factor solution was also proposed as providing a better fit than the original six-factor model suggested by CitationFrost et al. (1990). CitationPurdon, Antony, and Swinson (1999) identified three factors - Fear of Mistakes (FM), Goal/Achievement Orientation (GAO), and Perceived Parental Pressure (PPP) - which were created through the combination of original subscales and the reallocations of items attributed to Personal Standards (). FM consisted of items previously attributed by CitationFrost et al. (1990) to Concern over Mistakes and Doubts about Actions and included some of the items ascribed to the Personal Standards subscale. Subscale GAO included the balance of the Personal Standards items along with items from the Organization subscale. Identical to the Parental Expectations and Criticism (PEC) subscale suggested by CitationStöber (1998), PPP was made up of all items attributed to Parental Expectations and Parental Criticism. MPS-3 will be used as the moniker for the three-factor perfectionism model in this paper.
CitationCox et al. (2002) conducted an extensive confirmatory analysis of the various perfectionism models in order to elucidate the factorial nature of the Frost MPS. Although the original six-factor solution was preferable to the three- and four-factor solutions, it too failed to meet any of the evaluative criteria used in their study. In an effort to provide a more reliable model, CitationCox et al. (2002) used exploratory factor analysis to cull a set of items that best represented each of the factors. These derived factors were then cross-validated with a confirmatory factor analysis (CFA) on a second dataset. Unidimensionality of the subscales was improved by eliminating items that cross-loaded on more than one factor. Their five-factor solution () included only 22 of the original 35 items that comprised the Frost MPS. This brief version of the MPS, referred to as MPS-B in this article, defined each of the original subscales from the Frost MPS with a smaller set of items. Subscales Parental Expectations and Parental Criticism were combined and summarized by a new brief subscale called Parental Perceptions (PPB). Acronyms for brief versions of the original subscales, as determined by CitationCox et al. (2002), are notated by the subscript “B” in this paper to distinguish them from the original subscales defined in the MPS.
The measure of performance in a statistics course provided a more difficult problem. Although the same textbook and general class structure was used, the two instructors utilized dissimilar assignment/project/exam configurations, graded student submissions differently, and used different scaling for the assignment of grades. To allow for more consistent results across instructors, it was determined that the final percentage of available points would be used as the measure of student performance. It is acknowledged that student grades may not often accurately reflect statistical learning, but it is clear that grades are the most commonly accepted measure of performance in academia.
3.2 Participants
The sample was comprised of undergraduate business students enrolled in an introductory statistics course normally taken in the second year. The course is the first segment of a two course statistics requirement for all degrees offered through the school of business. Participation in the study was voluntary; no incentives were offered to take part in the study. Permission for the study was received from the Institutional Review Board at the university. Confidentiality of results was maintained using student ID numbers for identification and matching of questionnaire results with performance scores from the course. The sample was drawn during consecutive summer and fall semesters. To expand the generality of the results, observations were obtained from courses taught by two instructors: 143 observations were taken from the classes of a seasoned professor with above average student evaluations, with the other 81 from a new instructor with no significant prior teaching experience. The gender breakdown for the study was 113 males and 110 females; one individual did not specify a gender. Of the 224 students who participated in the study, 16 students withdrew from the course prior to the end of the semester and did not have a final measure of their classroom performance. Of the remaining 208 students, 184 answered all 35 questions on the MPS instrument and 203 answered all 22 questions on the MPS-B instrument. Observations with missing responses to items were removed from the dataset.
3.3 Analysis
The initial phase of this study involved the comparison of the fit of perfectionism models by CitationFrost et al. (1990), CitationStöber (1998), CitationPurdon et al. (1999), and CitationCox et al. (2002) to the data. Subsequent to the determination of the appropriate perfectionism model, a structural equation was modeled relating aspects of perfectionism to academic performance as measured by the final grade. Both the initial confirmatory factor analysis (CFA) and the structural equation modeling (SEM) were performed using maximum likelihood (ML) estimation and LISREL 8.54 (Scientific Software International, Inc., Chicago, IL). Absolute fit indices were employed to measure the reasonableness of the models. The root mean square error of approximation (RMSEA) is a measure of the closeness of fit, with values less than 0.05 indicating good model fit, and values up to 0.08 indicating reasonable model fit (CitationBrowne and Cudeck 1993; CitationHu and Bentler 1999). CitationSteiger (1990), CitationBrowne and Cudeck (1993), and CitationMacCallum, Browne, and Sugawara (1996) suggested that a confidence interval (CI) be calculated which should include values between 0 and 0.05 to indicate the possibility of good fit. LISREL provides a 90% CI for RMSEA as standard output. The χ2 statistic measures the absolute fit of the model to the data, but is well known to be sensitive to sample size. The ratio of the χ2 statistic to degrees of freedom (χ2/df) has been proposed as an alternative with values of 2.0 or less indicative of acceptable fit (CitationKline 1998). CitationBentler's (1990) comparative fit index (CFI) is a sample-size adjusted measure of fit derived from the comparison of the hypothesized model to the independence model. CFI values of 0.90 or greater are indicative of acceptable model fit (CitationKline, 1998). The Tucker-Lewis index (TLI; CitationTucker and Lewis 1973), alternatively known as the Bentler-Bonett non-normed fit index (NNFI), compares the hypothesized model to a model with no structure in terms of the variance-covariance of items. The acceptable values for TLI are similar to those for the CFI (CitationBentler and Bonett 1980; CitationHu and Bentler 1999). The use of one or more of the fit indices along with the standardized root mean square residual (SRMR) is suggested by CitationHu and Bentler (1999) with SRMR at 0.08 or less for good fit. It is believed that this subset of comparative goodness-of-fit measures should provide a solid overall base for model selection and development.
Note that the use of a single measure for academic performance will have specific effects on the nature of the structural model formed. A direct result of this approach is the elimination of measurement error as it pertains to the measure of academic performance. The general effect is that of a standard regression analysis, where the dependent variable is assumed to be measured without error.
For additional information on the use of structural equation modeling, CitationHoyle (1995) provides a thorough discussion of the issues, testing, and application of this statistical technique. Further information can be attained from the website for the LISREL software: www.ssicentral.com/lisrel/mainlis.htm.
4. Results
4.1 Perfectionism subscale
The means, standard deviations, skewness, and kurtosis values for the individual items on the MPS for the 208 students who did not withdraw from the course are reported in . A CFA was performed to determine the adequacy of the competing MPS models in describing the data. Results from the CFAs on the MPS, MPS-3, MPS-4, and the MPS-B models are shown in . Fit indices for the MPS-3 model suggested by CitationPurdon et al. (1999) indicate that this model did not fit the data - all fit statistics did not meet the evaluative criteria and the 90% CI for RMSEA did not include 0.05. Results for the MPS and MPS-4 models were comparable, with both registering acceptable statistics for the CFI and RMSEA measures. However, the 90% CI for RMSEA, SRMR, and the TLI fit statistic for both models did not meet the acceptable criteria. Additionally, the ratio of χ2/df exceeded 2.0 for the MPS-4 model. The fit indices for the 22-item MPS-B model were substantially better than the other three models. All fit statistics were within acceptable bounds, and the 90% CI for RMSEA included values below the 0.05 threshold. Thus, the MPS-B was utilized to determine the relationship between perfectionism and academic performance. Correlations (and their significance) among the five brief subscales defined in the MPS-B are shown in .
Table 2. Descriptive Statistics for the 35-Item MPS
Table 3. Fit Indices for Perfectionism Models
Table 4. Correlations between Subscales of the MPS-B and their Significance (n=203)
4.2 Classroom performance
A cursory analysis was performed on student performance scores to determine if differences existed between instructors and between sections within an instructor (). Results indicated that the mean performance scores differed significantly between instructors (two-sample t test assuming unequal variance, t(93.39) = 2.989, p = 0.004). Additional analyses of the sections within each instructor showed that no significant differences were detected in the mean performance scores for instructor 1 (ANOVA, F(3,137) = 0.647, p = 0.586) and instructor 2 (ANOVA, F(2,59) = 1.73, p = 0.186). Thus, even though the instructors' final grades had significantly different means, there was no evidence to indicate that the mean grades were not consistent from section to section within each instructor. As the intent of the study was not to describe differences between the limited instructors, sections, or semesters sampled, academic performance scores were standardized within each instructor prior to relating the scores to the perfectionism instrument. While this did remove the significant difference in mean raw performance scores between the instructors, it allowed the model to measure the relative impact of perfectionism on classroom performance within an instructor and allowed for differences in grading schemes. Aggregate descriptive statistics on post-standardization grades for both instructors are 0.00, 1.01, −1.00, and 1.13 for the mean, standard deviation, skewness, and kurtosis respectively.
Table 5. Performance Score Descriptive Statistics by Instructor and Section
4.3 Relationship of perfectionism to performance
CitationMacCullum (1986), CitationAnderson and Gerbing (1988), and others have stated the necessity for the thorough investigation and establishment of a measurement model prior to the construction of a structural model. The purpose of a measurement model is to evaluate the relationships between observed and unobserved variables by addressing the pattern of loadings on each factor. No relationships between unobserved factors are defined in this model. A CFA on the measurement model, including all subscales of the MPS-B and the measure of academic performance, was performed to evaluate the overall fit. An acceptable fit was found with all evaluative criteria met (). All factor loadings were significant at the .0001 level.
Table 6. Fit Indices for Structural Equation Models (n=203)
Figure 1. Overall MPS-B model of the factor structures of perfectionism and academic performance, and their relationship.
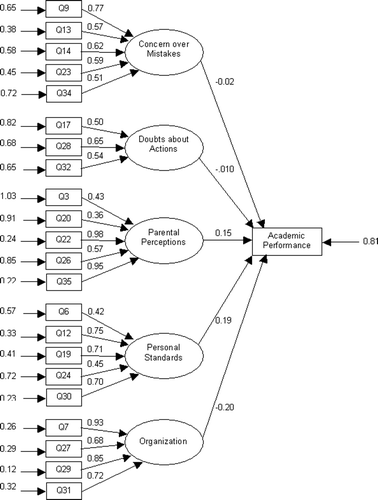
Based on an acceptable measurement model, an initial structural equation was modeled allowing relationships between all five MPS-B subscales and the measure of academic performance (. Note that rectangles represent observed variables in the study, and ellipses represent latent variables. Latent variables are unobserved variables, factors, or constructs that are assumed to be measured by one or more directly observable variables. Measurement error, in terms of adequacy in describing the latent variables, is signified by the arrows leading into the observed variables. Single-arrowed lines represent path coefficients in the model, whereas double-arrowed lines between the ellipses indicate correlations between these unobserved variables. Path coefficients are the estimated effect size and can be interpreted similarly to regression weights. The metric for the coefficient will be the scale of the originating variable if observed and in terms of standard deviations if the originating variable is latent. Note that structural equation models do not utilize intercept terms.
As indicated in , fit statistics showed an acceptable fit of this structural model with all statistics within criteria bounds. A statistically significant positive relationship was found between Personal Standards and academic performance (p = 0.011), addressing the question raised by RQ1. An additional non-theorized negative relationship between Organization and academic performance (p = 0.010) was also found. No other perfectionism subscale was found to have a significant relationship with academic performance - observed significance levels for the relationships between Concern over Mistakes, Doubts about Actions, and Parental Perceptions with academic performance were 0.826, 0.418, and 0.097 respectively. Thus, there was insufficient evidence of a relationship between Concern over Mistakes and academic performance (RQ2), consistent with prior studies in other academic fields.
To determine the strength and significance of the primary relationships between perfectionism and the measure of academic performance, subscales not showing a significant relationship in the initial model were dropped. Model fit indices for this reduced model showed acceptable model fit (). The significance and the magnitude of the relationships of Personal Standards and Organization to academic performance were not materially changed in this model ().
Figure 2. Final model of the factor structures of perfectionism and academic performance, and their relationship.
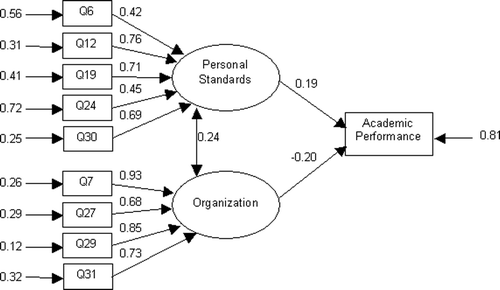
Of particular interest from these results were the nature and the direction of the relationship found between Personal Standards, Organization, and the measure of academic performance. As predicted by previous studies, Personal Standards showed a positive relationship with performance, with a standardized coefficient of 0.19. The relationship of perfectionism subscale Organization to performance was negative, with a standardized coefficient of −0.20. However, consistent with the correlations found in the CFA on the MPS-B scale, the correlation of Personal Standards and Organization remained positive (r = 0.24, p = 0.001). Personal Standards and Organization have been segregated from the other subscales and labeled as adaptive aspects of perfectionism (CitationFrost et al., 1993). The positive correlation between these subscales is expected, as is the positive coefficient of Personal Standards and academic performance. The suggestion from the results that Organization, a positive aspect of perfectionism, has a negative relationship with academic performance is disconcerting. This result was also particularly interesting in that although the relationships of Personal Standards and Organization to academic performance were in opposing directions, the relationship between the two perfectionism subscales remained positive. To determine if the relationship of Organization to academic performance was invariant to instructor, semester (fall and summer), and gender, tests were performed using the final model (). No significant difference was found between instructors (χ2 = 2.27, df = 1, p = 0.132), semesters (χ2 = 1.02, df = 1, p = 0.313), or genders (χ2 = 0.27, df = 1, p = 0.603).
5. Discussion and Practical Implications
The results of this study have established the reliability of the Frost multidimensional perfectionism scale within the population of university students in the school of business. Previous studies specifically targeting the classroom (CitationOnwuegbuzie and Daley 1999; CitationBrown et al. 1999; CitationWalsh and Ugumba-Agwunobi 2002) and much of the seminal work in the area (CitationFrost et al. 1990; CitationStöber 1998) have focused on students in social and behavioral science disciplines. Furthermore, it was found that the brief multidimensional perfectionism scale (MPS-B) suggested by CitationCox et al. (2002) provided the best fit of the available MPS-based perfectionism models.
The main purpose of this study was to determine whether perfectionism may be related to the ability of a student to achieve success in a statistics classroom. Central to that purpose were two primary research questions assessing the relationship between perfectionism subscales Personal Standards and Concern over Mistakes with academic achievement. Regarding Personal Standards, which was theorized as having a direct positive effect on academic performance in the statistics classroom, the results were supportive. This result is in agreement with research done in other academic fields and should be received positively by instructors in this curriculum. Personal Standards is defined by CitationFrost et al. (1990) as a person's tendency to set “very high standards” and reflects “excessive importance placed on these high standards for self-evaluation.” The connection between this adaptive aspect of perfectionism and academic performance seems to validate the belief that statistics is not unique among college subjects in that hard work and high standards will result in increased achievement.
The confirmation that the factor Concern over Mistakes is not related to academic achievement is also of some importance. Concern over Mistakes is considered a maladaptive aspect of perfectionism that is defined by CitationFrost et al. (1990) as “negative reactions to mistakes, a tendency to interpret mistakes as equivalent to failure, and a tendency to believe that one will lose the respect of others following failure.” Although students often consider the field of statistics as mathematics, statisticians realize that there is usually more than one way to analyze and interpret data. It would have been a concern to instructors if excessive apprehension by students over potentially subjective decisions was detrimental to academic achievement. Fortunately, that is not the case.
The investigation of the relationship between other factors of perfectionism and academic performance generally agreed with the existing literature, with Organization being the lone exception. Outside of that exception, there is no clear indication from this research that student perfectionism is linked in ways to academic performance in a statistics course that are not in line with other disciplines. The relationship of Organization to academic performance appears unique in the literature. This result is both surprising and intriguing, since Organization and Personal Standards are both considered adaptive aspects of perfectionism. The finding that Organization is working against academic achievement is contrary to expectations. It is possible that this relationship is the result of a Type I error. Although all items on the MPS and its derivatives loaded properly on their respective factors and correlations between factors agreed with previous research, the shear number of required estimations would naturally elevate the probability of a Type I error. In terms of coefficient estimation, five new relationships were estimated between perfectionism subscales and academic performance in the original structural model. Given the chance that the result was not generated erroneously, it may be beneficial to understand the nature of the Organization subscale and the role it might play in academic achievement in the statistics classroom.
As an aspect of perfectionism, CitationFrost et al. (1990) stated that the dimension, Organization, overemphasizes “precision, order, and organization.” CitationHollender (1965) defined it as a tendency to be “fussy and exacting” going so far as to state that these individuals think “there is a place for everything, and everything must be in its place.” However, Organization is considered the least interlinked of the subscales of perfectionism, but yet it regularly shows the highest level of reliability (CitationFrost et al., 1990).
One possible explanation of the relationship between Organization and academic performance would be through statistics anxiety. Research by CitationOnwuegbuzie and Daley (1999) has linked statistics anxiety to Socially Prescribed and Other-Oriented perfectionism, factors found in the CitationHewitt et al. (1991) multidimensional perfectionism scale (HMPS). Subscales from the HMPS has been linked to subscales from the Frost MPS by CitationFrost et al. (1993). If statistics anxiety explained much of the negative relationship between Organization and academic performance, it would be expected that HMPS subscales Socially Prescribed and Other-Oriented perfectionism would be significantly correlated to the Personal Standards and Organization subscales from the Frost MPS. The linkages found by CitationFrost et al. (1993) show that this is not that case. Personal Standards and Organization correlate highly with Self-Oriented perfectionism. However, in a subsequent paper, CitationWalsh and Ugumba-Agwunobi (2002) found that Self-Oriented perfectionism was related to a fear of statistics instructors and Computational Self-Concept when procrastination and trait anxiety are controlled. CitationCruise, Cash, and Bolton (1985) define Computational Self-Concept, a dimension of statistics anxiety, as the self perception of mathematical abilities and the anxiety experienced when attempting to solve mathematical problems. CitationWalsh and Ugumba-Agwunobi (2002) attributed the link between Self-Oriented perfectionism and Computational Self-Concept to a student's history with statistics courses and their inability to meet their own high expectations in those courses. As Personal Standards was defined by CitationFrost et al. (1990) as the tendency to set “very high standards and the excessive importance placed on these high standards for self-evaluation”, the link of Computation Self-Concept to subscales from Frost's MPS would seemingly be to Personal Standards. There has been no link proposed in the literature of statistics anxiety to Organization.
For benefits to be gleaned from this study, the practical implications must be addressed. Design considerations may need to be made in future textbooks to allow for the processing of statistical ideas without the mathematical rigor imposed in the past. With the additional emphasis now placed on the use of statistical software, statistics courses are shifting their focus from mathematical explanation to business analysis and decision making. This may make it even more imperative that business statistics instructors take the necessary time to link topics conceptually. A clear “final destination” to the knowledge gained during the semester should be shown with an explanation of how each subject relates to that “final destination”. Overviews of where and how statistical techniques fit together and aid in the analysis and interpretation of data should be considered to improve the organization of the material. Instructors may also need to place additional importance on the relationship of statistical techniques to each other and how the use of multiple techniques may work collectively to answer questions not addressable by a single approach. However, this cannot be achieved without placing sufficient emphasis on the structure underlying statistics. Common ground must be found to allow for student perception of a coherent and meaningful linkage between statistical topics when the mathematical connection is minimized.
A promising teaching technique that may alleviate some of the organizational issues is the implementation of a constructivist approach, whereby students actively construct their knowledge through activation of previously learned material. CitationVerkoeijen et al. (2002) describe the constructivist approach as a process where new information is linked to preexisting knowledge structures leading “to the development of sophisticated and elaborate mental knowledge structures”. For this to work in the statistics classroom, instructors should be able to link current topics with other business-related material that will help the students comprehend more than just the process, but the reason for its use. For example, the instruction of hypothesis testing may not connect with students unless they understand the reason for performing such a test and the impact it may have on everyday business decision making.
6. Conclusion
This research investigated the relationship between attributes of perfectionism and academic performance of students in the statistics classroom. This research confirmed the factor reliability of the measures developed by CitationCox et al. (2002) and also found support for both research questions. The indication of a negative relationship between the perfectionism factor Organization and academic performance is cause for concern for the statistics instructor. Additional research is necessary on the implementation of techniques that may address student organizational needs. The identification of issues inhibiting academic achievement is only one step in creating a more effective learning environment. The pervasiveness of pedagogical research in the area of statistics is encouraging. The acceptance and utilization of these findings should give renewed life to student perception of statistics as critical knowledge in this era of information. It is hoped that continued research into the psychological makeup of students will give instructors better insights into the barriers that students perceive in the learning of statistics.
References
- Albert, J. (2000), “Using a Sample Survey Project to Assess the Teaching of Statistical Inference,” Journal of Statistics Education [Online], 8 (1). ww2.amstat.org/publications/jse/secure/v8n1/albert.cfm
- Anderson, J. C., and Gerbing. D. W. (1988), “Structural Equation Modeling in Practice: A review and recommended two-step approach,” Psychological Bulletin, 103, 411–423.
- Bentler, P. M. (1990), “Comparative Fit Indexes in Structural Modeling,” Psychological Bulletin, 107, 238–246.
- Bentler, P. M. and Bonnet, D. G. (1980), “Significance Tests and Goodness of Fit in the Analysis of Covariance Structures,” Psychological Bulletin, 88, 588–606.
- Bieling, P. J., Israeli, A., Smith, J., and Antony, M. M. (2003), “Making the Grade: the behavioural consequences of perfectionism in the classroom,” Personality and Individual Differences, 35, 163–178.
- Bordley, R. F. (2001), “Teaching Decision Theory in Applied Statistics Courses,” Journal of Statistics Education [Online], 9 (2). ww2.amstat.org/publications/jse/v9n2/bordley.html
- Brown, E. J., Heimburg, R. G., Frost, R. O., Makris, G. S., Juster, H. R., and Leung, A. W. (1999), “Relationship of Perfectionism to Affect, Expectations, Attributions and Performance in the Classroom,” Journal of Clinical Psychology, 18, 98–120.
- Browne, M. W., and Cudeck, R. (1993), “Alternative Ways of Assessing Model Fit.” In K.A. Bollen and J.S. Long (Eds.), Testing Structural Models (pp. 136–162). Newbury Park, CA: Sage Publications, Inc.
- Cox, B. J., Enns, M. W., and Clara, I. P. (2002), “The Multidimensional Structure of Perfectionism in Clinically Distressed and College Student Samples,” Psychological Assessment, 14, 365–373.
- Cruise, R. J., Cash, R. W., and Bolton, D. L. (1985), “Development and Validation of an Instrument to Measure Statistical Anxiety,” 1985 Proceedings of the American Statistical Association, Statistics Education Section (pp. 92–97). Alexandria, VA: American Statistical Association.
- Dauphinee, T. L., Schau, C., and Stevens, J. J. (1997), “Survey of Attitudes Towards Statistics: Factor structure and factorial invariance for females and males,” Structural Equation Modeling, 4, 129–141.
- Enns, M. W., and Cox, B. J. (1999), “Perfectionism and Depression Symptom Severity in Major Depressive Disorder,” Behavior Research and Therapy, 37, 783–794.
- Enns, M.W., and Cox, B.J. (2002), “The Nature and Assessment of Perfectionism: A critical analysis.” In G.L. Flett and P.L. Hewitt (Eds.), Perfectionism: Theory, research, and treatment (pp. 33–62). Washington, DC: American Psychological Association.
- Feinberg, L, and Halperin, S. (1978), “Affective and Cognitive Correlates of Course Performance in Introductory Statistics,” Journal of Experimental Education, 46 (4), 11–18.
- Flett, G., Blankstein, R., Hewitt, P., and Koledin, S. (1992), “Components of Perfectionism and Procrastination in College Students,” Social Behaviour and Personality, 6, 147–160.
- Flett, G., Hewitt, P., and Martin, T. (1995), “Dimensions of Perfectionism and Procrastination.” In S. Ferrari, J. Johnson, and W. McCown (Eds.), Procrastination and Task Avoidance: Theory, research, and treatment (pp. 113–136). London: Plenum Press.
- Frost, R. O., Heimburg, R. G., Holt, C. S., Mattia, J. I., and Neubauer, A. L. (1993), “A Comparison of Two Measures of Perfectionism,” Personality and Individual Differences, 14, 119–126.
- Frost, R. O., Marten, P., Lahart, C., and Rosenblate, R. (1990), “The Dimensions of Perfectionism,” Cognitive Therapy and Research, 14, 449–468.
- Frost, R. O., Trepanier, K. L., Brown, E. J., Heimburg, R. G., Juster, H. R., Leung, A. W., and Makris, G. S. (1997), “Self-Monitoring of Mistakes Among Subjects High and Low in Concern Over Mistakes,” Cognitive Therapy and Research, 21, 209–222.
- Frost, R. O., Turcotte, T. A., Heimburg, R. G., Mattia, J. I., Holt, C. S., and Hope, D. A. (1995), “Reactions to Mistakes Among Participants High and Low in Perfectionistic Concern Over Mistakes,” Cognitive Therapy and Research, 19, 195–205.
- Gal, I., and Ginsburg, L. (1994), “The Role of Beliefs and Attitudes in Learning Statistics: Towards an assessment framework,” Journal of Statistics Education [Online], 2 (2). ww2.amstat.org/publications/jse/v2n2/gal.html
- Gal, I., Ginsburg, L., and Schau, C. (1997), “Monitoring Attitudes and Beliefs in Statistics Education.” In I. Gal and J.B. Garfield (Eds.), The Assessment Challenge in Statistics Education (pp. 37–51). Netherlands: IOS Press.
- Habke, A. M., and Flynn, C. A. (2003), “Interpersonal Aspects of Trait Perfectionism.” In G.L. Flett and P.L. Hewitt (Eds.), Perfectionism: Theory, Research and Treatment (pp. 151–180). Washington, D.C.: American Psychological Association.
- Hamachek, D. E. (1978), “Psychodynamics of Normal and Neurotic Perfectionism,” Psychology, 15, 27–33.
- Hewitt, P. L., and Flett, G. L. (1991), “Perfectionism in the Self and Social Contexts: Conceptualization, assessment, and association with psychopathology,” Journal of Personality and Social Psychology, 60, 456–470.
- Hill, R.W., McIntire, K., and Bacharach, V. R. (1997), “Perfectionism and the Big Five Factors,” Social Behaviour and Personality, 12, 257–270.
- Hollender, M. H. (1965), “Perfectionism,” Comprehensive Psychiatry, 6, 94–103.
- Hoyle, R. H. (Ed.) (1995), Structural Equation Modeling: Concepts, Issues, and Applications, Thousands Oaks, CA: Sage.
- Hu, L., and Bentler, P. M. (1999), “Cutoff Criteria for Fit Indexes in Covariance Structure Analysis: Conventional criteria versus new alternatives,” Structural Equation Modeling, 6, 1–55.
- Jöreskog, K. G. (1971), “Statistical Analysis of Sets of Congeneric Tests,” Psychometrika, 36, 109–33.
- Kline, R. B. (1998), The Principles and Practice of Structural Equation Modeling, New York: Guilford Press.
- MacCallum, R. (1986), “Specification Searches in Covariance Structure Modeling,” Psychological Bulletin, 100, 107–120.
- MacCallum, R.C., Browne, M. W. and Sugwara, H. M. (1996), “Power Analysis and Determination of Sample Size for Covariance Structure Modeling,” Psychological Methods, 1, 130–149.
- Magel, R. C. (1998), “Using Cooperative Learning in a Large Introductory Statistics Class,” Journal of Statistics Education [Online], 6 (3). ww2.amstat.org/publications/jse/v6n2/magel.html
- Marasinghe, M. G., Meeker, W. Q., Cook, D., and Shin, T. (1996), “Using Graphics and Simulation to Teach Statistical Concepts,” The American Statistician, 50, 342–351.
- Millon, T. (with Davis, R. D.) (1996), Disorders of Personality: DSM-IV and Beyond (2nd ed.), New York: Wiley.
- Mills, J. D. (2002), “Using Computer Simulation Methods to Teach Statistics: A review of the literature,” Journal of Statistics Education [Online], 10 (1). ww2.amstat.org/publications/jse/v10n1/mills.html
- Olson, J. M. and Maio, G. R. (2003), “Attitudes in Social Behavior.” In I.B. Weiner, T. Millon, and M.J. Lerner (Eds.), Handbook of Psychology: Personality and Social Psychology (pp. 299–325). Hoboken, NJ: John Wiley.
- Onwuegbuzie, A. J. (1997), “Writing a Research Proposal: The Role of library anxiety, statistics anxiety and composition anxiety,” Library and Information Science Research, 19, 5–33.
- Onwuegbuzie, A. J., and Daley, C. E. (1999), “Perfectionism and Statistics Anxiety,” Personality and Individual Differences, 26, 1089–1102.
- Onwuegbuzie, A. J., DaRos, D., and Ryan, J. (1997), “The Components of Statistics Anxiety: A phenomenological study,” Focus on Learning Problems in Mathematics, 19 (4), 11–35.
- Onwuegbuzie, A. J., and Seaman, M. (1994), “The Effect of Time and Anxiety on Statistics Achievement,” Journal of Experimental Psychology, 63, 115–124.
- Pacht, A. R. (1984), “Reflections on Perfection,” American Psychologist, 39, 386–390.
- Petty, R. E., Wegener, D. T., and Fabrigar, L. R. (1997), “Attitudes and Attitude Change,” Annual Review of Psychology, 48, 609–647.
- Purdon, C., Antony, M. M., and Swinson, R. P. (1999), “Psychometric Properties of the Frost Multidimensional Perfectionism Scale in a Clinical Anxiety Disorders Sample,” Journal of Clinical Psychology, 55, 1271–1286.
- Reid, A., and Petocz, P. (2002), “Students' Conceptions of Statistics: A phenomenographic study,” Journal of Statistics Education [Online], 10 (2). ww2.amstat.org/publications/jse/v10n2/reid.html
- Rinaman, W. C. (1998), “Revising a Basic Statistics Course,” Journal of Statistics Education [Online], 6 (2). ww2.amstat.org/publications/jse/v6n2/rinaman.html
- Roberts, D. M., and Bilderback, E. W. (1980), “Reliability and Validity of a Stataistics Attitude Survey,” Education and Psychological Measurement, 40, 235–238.
- Roberts, D. M., and Saxe, J. (1982), “Validity of a Statistics Attitude Survey: a follow-up study,” Educational and Psychological Measurement, 42, 907–912.
- Schau, C., Stevens, J., Dauphinee, T. L., and Del Vecchio, A. (1995), “The Development and Validation of the Survey of Attitudes Toward Statistics,” Educational and Psychological Measurement, 55, 868–875.
- Sedlmeier, P. (1999), Improving Statistical Reasoning: Theoretical Models and Practical Implication, Mahwah, NJ: Lawrence Erlbaum.
- Smith, G. (1998), “Learning Statistics by Doing Statistics,” Journal of Statistics Education [Online], 6 (3). ww2.amstat.org/publications/jse/v6n3/smith.html
- Steiger, J. H. (1990), “Structural Model Evaluation and Modifications: An interval estimation approach,” Multivariate Behavioral Research, 25, 173–180.
- Stöber, J. (1998), “The Frost Multidimensional Perfectionism Scale Revisited: More perfect with four (instead of six) dimensions,” Personality and Individual Differences, 24, 481–491.
- Stumpf, H. and Parker, W. D. (2000), “A Hierarchical Structure Analysis of Perfectionism and its Relation to Other Personality Characteristics,” Personality and Individual Differences, 28, 837–852.
- Tucker, C., and Lewis, C. (1973), “A Reliability Coefficient for Maximum Likelihood Factor Analysis,” Psychometrika, 38, 1–10.
- Velleman, P. F. and Moore, D. S. (1996), “Multimedia for Teaching Statistics: Promises and pitfalls,” American Statistician, 50, 217–225.
- Verkoeijen, P. P. J. L., Imbos, T.J., van de Wiel, M. W. J., Berger, M. P. F., and Schmidt, H. G. (2002), “Assessing Knowledge Structures in a Constructive Learning Environment,” Journal of Statistics Education [Online], 10 (2). ww2.amstat.org/publications/jse/v10n2/verkoeijen.html
- Walsh, J. J., and Ugumba-Agwunobi, G. (2002), “Individual Differences in Statistics Anxiety: The roles of perfectionism, procrastination and trait anxiety,” Personality and Individual Differences, 33, 239–251.
- Wise, S. L. (1985), “The Development and Validation of a Scale Measuring Attitudes Toward Statistics,” Educational and Psychological Measurement, 45, 401–405.
- Yesilcay, Y. (2000), “Research Project in Statistics: Implications of a case study for the undergraduate statistics curriculum,” Journal of Statistics Education [Online], 8 (2). ww2.amstat.org/publications/jse/secure/v8n2/yesilcay.cfm
- Zeidner, M. (1991), “Statistics and Mathematics Anxiety in Social Science Students: Some interesting pitfalls,” British Journal of Educational Psychology, 61, 319–328.