Abstract
This paper describes an interactive activity that revolves around the dice-based golf game GOLO.
The GOLO game can be purchased at various retail locations or online at igolo.com. In addition, the game may be played online free of charge at igolo.com. The activity is completed in four parts. The four parts can be used in a sequence or they can be used individually. Part 1 illustrates the binomial distribution. Part 2 illustrates the sampling distribution of the sample proportion. Part 3 illustrates confidence intervals for a population proportion. Part 4 illustrates hypothesis tests for a population proportion.
Extensions of the activity can be used to illustrate discrete probability distributions (including the geometric, hypergeometric, and negative binomial) and the distribution of the first order statistic. The activity can be used in an AP statistics course or an introductory undergraduate statistics course. The extensions of the activity can be used in an intermediate undergraduate statistics course or a mathematical statistics course. Each extension is self-contained and can be carried out without having worked through other extensions or any of the four parts of the main activity.
- Active learning
- Statistics in sports
- Binomial distribution
- Sampling distribution of a sample proportion
- Confidence interval for a proportion
- Hypothesis test on a proportion
- Geometric distribution
- Hypergeometric distribution
- Negative binomial distribution
- Distribution of the first order statistic
- Theoretical and empirical probabilities
1. Introduction
In this paper, we discuss an interactive activity that we use to illustrate inferences for proportions, a variety of discrete probability distributions, and the distribution of the first order statistic. The activity is based upon playing the dice-based golf game GOLO. The GOLO game can be purchased online at igolo.com or at various retail locations. Additionally, one very appealing aspect of the use of the GOLO game is that the game may be played online free of charge at igolo.com.
We first provide some general background on the game of golf and the rules of play for the GOLO game.
1.1 Background on Golf
The Merriam-Webster online dictionary defines golf as “A game in which a player using special clubs attempts to sink a ball with as few strokes as possible into each of the 9 or 18 successive holes on a course.” Golf is played on a tract of land designated as the course. Players walk (or often drive in motorized electric carts) over the course, which consists of a series of holes. A hole means both the hole in the ground into which the ball is played (also called the cup), as well as the total distance from the tee (a pre-determined area from where a ball is first hit) to the green (the area surrounding the actual hole in the ground). Most golf courses consist of 9 or 18 holes.
The first stroke on each hole is made or hit from the tee, where the grass is well tended to facilitate the tee shot. After teeing off, a player hits the ball again from the position at which it came to rest, either from the fairway (where the grass is cut so low that most balls can be easily played) or from the rough (where the grass is cut much longer than fairway grass, or which may be uncut) until the ball is hit into the cup. Many holes include hazards, which may be of two types: water hazards (lakes, rivers, etc.) and bunkers (sand). Special rules apply to playing balls that come to rest in a hazard that make it undesirable to hit a ball into one of the hazards.
At some point on every hole, each player hits her ball onto the putting green. The grass of the putting green (or more commonly the green) is cut very short so that a ball can roll easily. The cup, which is always found within the green, has a diameter of 4.25 in. and a depth of 3.94 in. The cup usually has a flag on a pole positioned in it so that it may be seen from some distance, but not necessarily from the tee. This flag and pole combination is often called the pin. Once on the green, a player putts the ball into the cup in as few strokes as possible.
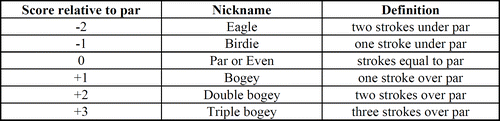
A hole is classified by its par. Par is the maximum number of strokes that a skilled golfer should require to complete the hole. A skilled golfer expects to reach the green in two strokes less than par and then use two putts to get the ball into the hole. For example, a skilled golfer expects to reach the green on a par four hole in two strokes, one from the tee, another to the green, and then roll the ball into the hole with two putts. Traditionally, a golf hole is either a par three, four, or five. The par of a hole is primarily, but not exclusively, determined by the distance from tee to green. A typical length for a par three hole is anywhere between 100 to 250 yards. A par four is generally between 251 to 475 yards. Par five holes are typically at least 476 yards, and can be as long as 600 yards. Many 18-hole courses have approximately four par-three, ten par-four, and four par-five holes. As a result, the total par of an 18-hole course is usually around 72. One's score on a hole relative to par is given a nickname. displays the nicknames for the common scoring outcomes.
Figure 1. Some Common Golf Scores
1.2 Background on GOLO
1.2.1. History of GOLO
It all started at an Irish pub in Los Gatos, California. Patrick Shea, a local PGA professional, was playing standard dice games with his buddies. He was intrigued with the possibility of playing golf with dice, so he placed 9 standard dice in a cup and within minutes had created the basic rules of the game now called GOLO. The response from friends and family was overwhelming. As the game grew in popularity, a few rules and some new features were added. For further information on GOLO, see: igolo.com.
1.2.2. What is GOLO?
GOLO consists of 9 dice, a dice cup, the rules of GOLO, scorecards, and a pencil. shows an image of the GOLO game.
Figure 2. The GOLO Game

The goal of the game, as in real golf, is to shoot the lowest possible score, or “go low!” The 9 dice represent 9 golf holes on a typical golf course. Each die has twelve sides with various scores on each side - some great, some not so good. Players roll and remove dice to “score.” One can play a variety of games depending on the number of players involved and the length of time available.
There are two par 3 dice (which are red), five par 4 dice (which are white), and two par 5 dice (which are blue).
We call the two par 3 dice Par 3A and Par 3B. The twelve equally-likely faces on the dice are numbered as follows:
Par 3A – 1, 3, 3, 3, 4, 4, 5, 5, 6, 6, 6, 8 and
Par 3B – 2, 3, 3, 3, 4, 4, 5, 5, 6, 6, 6, 7.
All five par 4 dice are the same. The twelve equally-likely faces on the par 4 dice are numbered as follows:
Par 4 – 3, 4, 4, 4, 5, 5, 6, 6, 7, 7, 7, 8.
We call the two par 5 dice Par 5A and Par 5B. The twelve equally-likely faces on the dice are numbered as follows:
Par 5A – 3, 5, 5, 5, 6, 6, 7, 7, 8, 8, 8, 10 and
Par 5B – 4, 5, 5, 5, 6, 6, 7, 7, 8, 8, 8, 9.
For convenience, on each of the die, a par score is outlined by a square, a birdie is outlined by a circle, and an eagle is outlined by a star.
1.2.3. How to Play GOLO
The basic rules of GOLO are very simple:
Roll all nine dice.
Remove your lowest score(s). You must remove at least one die, but you may remove as many as you wish.
Place the remaining dice in the cup and roll again.
Continue to roll until all nine dice have been removed.
Add up the scores for all nine dice to get your nine-hole score. (To play 18 holes, repeat the process and add both nine-hole scores together.)
1.2.4. The GOLO Web Site
We have obtained numerous GOLO game sets and when we ask students to collect data based upon GOLO we circulate one game set for each student in a class of 30. An alternative to purchasing a large number of GOLO game sets is to ask students to collect GOLO data online. The GOLO web site contains a fully functional interactive version of the GOLO game (upon visiting the web site, igolo.com, the user can select the link: Play the online version of GOLO).
2. The Activity
The activity is completed in four parts. The four parts of the activity can be used in a sequence or they can be used individually. In each of the subsequent sections we will describe the implementation of the four parts of the activity. Each part will require approximately one hour of class time.
For each part of the activity students work individually or in teams of two or three students. Each student or team needs a GOLO game set or access to the Internet so that the GOLO game may be played online.
2.1 Part 1 – Illustrating the Binomial Distribution
In this part of the activity, students explore the properties and use of the binomial distribution. Prior to completing this part of the activity, students have been introduced to the concept of a discrete random variable. In addition, students have constructed probability distributions in table form.
Each student needs a copy of the Background Sheet (Appendix A.0) and the Part 1 Worksheet (Appendix A.1)
We begin the activity by introducing the GOLO game. We provide a brief background on golf and we discuss typical golf scores. The Background Sheet contains a summary of golf scoring similar to (as well as a summary of the GOLO game dice). After the brief discussion of golf scoring we mention the origin of the GOLO game and we describe how to play the game. We illustrate the three colors of dice; and we note that a par is outlined on each die by a square, a birdie is outlined by a circle, and an eagle is outlined by a star. We mention that we are interested in examining outcomes of rolling the GOLO dice that produce a result of par or better. Thus, when we roll the dice we are looking for squares, circles, and stars.
We discuss the setting for a binomial random variable. We explain that the binomial setting is characterized by the following:
n independent observations (usually called trials),
each observation is categorized as either a success or a failure, and
the probability of a success, denoted by p, is the same for each observation.
We explain that the number of successes in the n trials, denoted by X, is called a binomial random variable and is said to have a binomial distribution.
We explain that each roll of a GOLO die can be thought of as a single trial in a binomial experiment where success on a given trial is defined as a specified outcome or better on the up-face of the die. For example, suppose that we define a success as par or better on a die. If n dice are rolled, the probability that X dice are par or better follows a binomial distribution. The probability that n rolls result in x successes can be found as: , where x=0,1,2,…,n and p is the probability of success on each roll; 0 ≤ p ≤ 1.
We ask students to answer a series of questions, assuming that a GOLO player is beginning a “new nine.” First, we ask students to explain why the number of pars or better thrown on the roll of all 9 dice can be considered a binomial random variable. We consider each of the nine dice to represent a separate, independent trial. By examining the GOLO dice we can see that the proportion of rolls that result in an outcome of par or better is 1/3, since on each die, four of the twelve possible equally likely outcomes is par or better than par. Thus, the probability of a success (par or better) on each trial is the same The random variable of interest is the number of successes X in the n=9 trials.
We ask students to calculate the following probabilities:
the probability of throwing exactly 2 pars or better:
the probability of throwing at most 1 par or better:
the probability of throwing at least 1 par or better:
the probability of throwing at least 3 and no more than 6 pars or better:
Next, we discuss the theoretical cumulative distribution for a random variable X evaluated at a number x. The theoretical cumulative distribution is defined as the probability of getting a value less than or equal to x. For example, the theoretical cumulative distribution for the binomial random variable defined above evaluated at x = 2 is Pr (X ≤ 2) = Pr (X = 0) + Pr (X = 1) + Pr (X = 2). This corresponds to the probability of 2 or fewer pars or better in the roll of all 9 dice. We ask students to find the theoretical cumulative distribution for the number of pars or better in a roll of all nine dice.
We emphasize that all binomial probabilities calculated so far are theoretical probabilities because they are based on the presumed properties of the dice (all sides equally likely), not on the results of actually rolling the dice. We explain that probabilities based upon actually rolling the dice (i.e., on real data) are called empirical probabilities. We have students roll all nine dice 50 times and count the number of successes (defined by par or better) that are thrown on each roll of the nine dice. On the Part 1 Worksheet each student completes a table similar to below. Each student writes her results on the board. We create columns on the board corresponding to the Number of Pars of Better, and we ask each student to write her numbers in the appropriate row.
Table 1. Example individual data collection table.
Once each student has collected her individual data for 50 rolls of the 9 dice, we tally the class data.
We define the empirical cumulative distribution for a random variable X evaluated at a number x as the proportion of values less than or equal to x for an actual sample. For example, the empirical cumulative distribution for the class data evaluated at x =2 is the proportion of class rolls that resulted in 2 or fewer successes (par or better). Students use the outcomes from the class rolls to develop an empirical cumulative distribution and complete a table on the Part 1 Worksheet. provides an example comparison of the theoretical and empirical cumulative distributions.
Table 2. Example comparison of theoretical and empirical cumulative distributions.
Students compare the theoretical cumulative distribution and the empirical cumulative distribution to determine if the binomial model proposed is a reasonable model for the class data. If the theoretical values are close to the empirical values, then the binomial model is reasonable. For the example class data, when we compare the two distributions, we find that most values are very close with the biggest difference when x = 4 where the theoretical value is 0.8551 and the empirical value is 0.8200. Thus, it seems that the binomial model with n = 9 and p = 1/3 is a reasonable model for the number of pars or better for rolling all nine dice in GOLO.
2.2 Part 2 – Illustrating the Sampling Distribution of the Sample Proportion
This part of the activity was designed to help students visualize the process of repeatedly sampling from a population and using the sample data to make an inference about an unknown population proportion. Through completion of this part of the activity, students will develop an understanding of the effect of sampling variability on the center and spread of the sampling distribution of the sample proportion. Students will also develop an understanding of the effect of sample size on the spread of the distribution of the sample proportion.
Prior to completing this part of the activity, students have studied descriptive statistics, normal distributions, and basic probability concepts.
Each student needs a copy of the Background Sheet (Appendix A.0) and the Part 2 Worksheet (Appendix A.2).
We ask students to assume that we are going to conduct a binomial experiment with n trials or that we are going to record the value of a categorical variable for a sample of n individuals. We explain that in either case, we can compute the statistic = the sample proportion; that is, the proportion of trials resulting in success (or the proportion of individuals in a sample with a specified value of a measured categorical variable). We explain that if we repeated the binomial experiment or took a new sample we would most likely get a different value for the sample proportion. The sampling distribution for a sample proportion is the probability distribution of possible values of the sample proportion for repeated samples of the same size taken from the same population. Here, the population proportion of interest, p, is the proportion of rolls of the GOLO dice that result in an outcome of par or better. Recall that the true value of p is 1/3.
Students are asked to utilize the data collection procedure described on the Part 2 Worksheet in order to determine the sample proportion of rolls that are par or better for the sample sizes of n = 9, 18, 36, and 72. Rolling all 9 GOLO dice once results in a sample of size 9, rolling all 9 GOLO dice two times results in a sample of size 18, and so on. Individual results are recorded on the Part 2 Worksheet and each student writes her individual results on the board under an appropriately labeled column.
We treat the results of multiple rolls of the GOLO dice as independent trials. For each of the sample sizes there will be roughly 30 sample proportion values. Collecting the data provides an opportunity for students to see a concrete example of repeated sampling. Calculating the proportion of rolls that are par or better for each sample reinforces the idea of a sample proportion being a random variable with values that change from sample to sample.
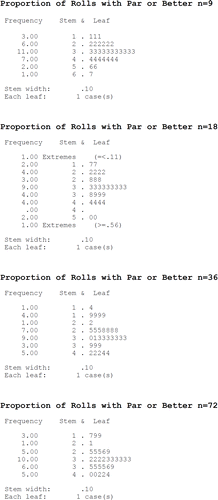
After the individual sample proportions have been calculated and the results copied onto the board students are instructed to input the class data into the Class Data Table on the Part 2 Worksheet. contains stem-and-leaf plots that display typical class outcomes for the tosses of the GOLO dice.
Figure 3. Example Class Stem-and-Leaf Plots
By examining the class data and answering a series of questions students begin to discover properties of the distribution of a sample proportion. In the discussion to follow we refer to the example class data for purposes of illustration. Students will note that the distribution of sample proportion values is centered on the value of the population proportion. For the example class data, the calculated values of the mean of the sample proportion distributions are 0.34, 0.33, 0.31, and 0.32 for samples of size 9, 18, 36, and 72; respectively. Students will note that the variability of the sample proportion values is related to the sample size, with a larger sample size resulting in smaller variability in the sample proportion values. For the example class data, the calculated values of the standard deviation of the sample proportion distributions are 0.13, 0.11, 0.08, and 0.07 for samples of size 9, 18, 36, and 72; respectively.
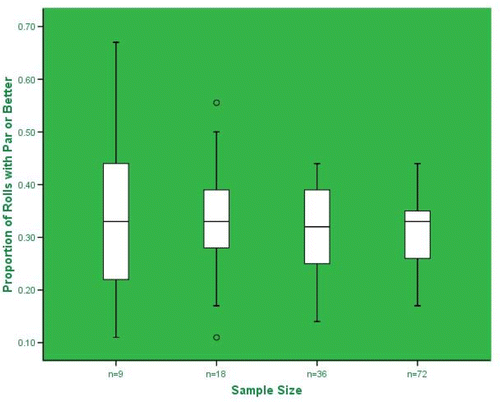
The instructor may also wish to ask students to calculate five-number summaries and construct side-by-side boxplots to compare the distributions of the sample proportion values for the different sample sizes. displays example comparative boxplots constructed from the class data. The boxplots provide a visual aid to help reinforce the properties of the center and spread of the sampling distribution of a sample proportion.
Figure 4. Example Class Comparative Boxplots
At this point we summarize the results from the analyses of the repeated sampling and discuss the theoretical properties of the sampling distribution of a sample proportion. The mean value of the distribution of a sample proportion is equal to the corresponding value of the proportion of the population that was sampled from, p. The standard deviation of the distribution of a sample proportion decreases with an increase in the sample size. Technically, the standard deviation is given by: . And, provided that the sample size is large enough (np, n(1-p) ≥ 10), the distribution of a sample proportion will be approximately normal (bell-shaped).
2.3 Part 3 – Illustrating Confidence Intervals for a Proportion
This part of the activity was designed to help students visualize the process of repeatedly sampling from a population and using the sample data to construct a confidence interval for an unknown population proportion. Through completion of this part of the activity, students will develop an understanding of how to interpret a confidence interval and the relationship between the confidence level and confidence interval width.
Prior to completing this part of the activity, students have studied normal distributions, basic probability concepts, sampling distributions, and basic elements of confidence interval construction and interpretation. Additionally, students have been introduced to the formula for an approximate confidence interval for the population proportion.
Each student needs a copy of the Background Sheet (Appendix A.0) and a copy of the Part 3 Worksheet (see Appendix A.3).
If Part 2 of the activity has been completed, the data collection for Part 3 can be by-passed and the previously collected data may be used. Otherwise, students are asked to utilize the data collection procedure described on the Part 3 Worksheet in order to determine the sample proportion of rolls that are par or better for the sample size of n = 36. Recall that the true proportion of GOLO die rolls resulting in an outcome of par or better is p = 1/3.
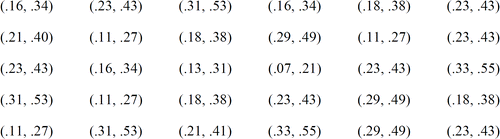
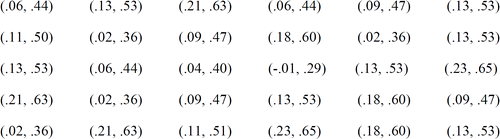
Students are asked to construct an 80% confidence interval for the proportion of GOLO die rolls resulting in par or better from their data for 36 trials. Each student writes her interval on the board. displays example class 80% confidence intervals. The shaded intervals do not cover the true proportion of GOLO rolls resulting in par or better.
Figure 5. Example Class 80% Confidence Intervals
For a typical class of 30 students, roughly 24 (80%) of the class confidence intervals should cover the value of p = 1/3. We stress that if we claim that we are 80% confident that a proportion lies within the endpoints of a confidence interval we are saying that the endpoints of the confidence interval were calculated by a method that gives correct results in 80% of all possible samples. We ask students to write a statement explaining how an 80% level of confidence should be interpreted.
Students construct a 99% confidence interval for the proportion of GOLO rolls resulting in par or better using individual data collected from 36 tosses. Class confidence intervals are displayed on the board. displays example class 99% confidence intervals. The shaded interval does not cover the true proportion of GOLO rolls resulting in par or better than par.
Figure 6. Example Class 99% Confidence Intervals
For a typical class of 30 students, roughly 29 or 30 (99%) of the class confidence intervals should cover the value of p = 1/3. We stress how to properly interpret a 99% confidence level and we ask students to write a statement explaining how a 99% level of confidence should be interpreted. We ask students to write a statement explaining how increasing the confidence level from 80% to 99% changed their confidence interval. In order to gain more confidence in an interval, the interval will become wider. We ask students to write an intuitive justification for the relationship between the width of a confidence interval and the level of confidence. We ask students to give one advantage of using 99% confidence rather than 80% confidence and to give one disadvantage. A 99% confidence interval is a highly reliable interval estimate but it may be imprecise. An 80% confidence interval is more precise but has relatively low reliability. The advantage of the 99% confidence interval is that it is very likely to enclose the true population proportion. The disadvantage of the 99% confidence interval is that it may be too wide to give us a good estimate of the value of the population proportion.
Through completing this part of the activity, students will see a demonstration of the process of repeatedly selecting samples from a population and constructing confidence intervals for the population proportion. Writing class results on the board allows for a discussion of the meaning of the level of confidence. Students can see that in repeated sampling the confidence level represents the percentage of the time that the process of constructing a confidence interval will result in an interval that successfully encloses the true value of the population parameter. Changing the confidence level allows students to see the relationship between level of confidence and confidence interval width.
2.4 Part 4 – Illustrating Hypothesis Tests on a Proportion
This part of the activity was designed to help students visualize the process of repeatedly sampling from a population and using the sample data to perform a hypothesis test on an unknown population proportion. Through completion of this part of the activity, students will develop an understanding of how to interpret the level of significance of a hypothesis test (Type I error rate), how to interpret the p-value of a hypothesis test, how to interpret the Type II error rate of a hypothesis test, and the relationship between Type I and Type II error rates.
Prior to completing this part of the activity, students have studied normal distributions, basic probability concepts, sampling distributions, and confidence intervals. Additionally, students have been introduced to the procedure for performing a hypothesis test on a population proportion.
Each student needs a copy of the Background Sheet (Appendix A.0) and a copy of the Part 4 Worksheet (see Appendix A.4).
If Parts 2 or 3 of the activity have been completed, data collection for Part 4 can be by-passed and previously collected data may be used. Otherwise, students are asked to use the data collection procedure described on the Part 4 Worksheet in order to determine the sample proportion of GOLO rolls that are par or better for the sample size of n = 36. After data collection is completed, students are reminded that the true proportion of GOLO die rolls resulting in an outcome of par or better than par is p = 1/3.
2.4.1 Illustrating Type II Errors
Students use their GOLO data to perform two hypothesis tests of H0 : p = 1/9 versus HA : p > 1/9. The tests are performed with different levels of significance. Since the true value of p = 1/3, the null hypothesis, H0 : p = 1/9 is false. Since H0 is false, performing these tests provides an opportunity to use simulation to illustrate properties of p-values and Type II errors.
The first test of H0 : p = 1/9 versus HA : p > 1/9 is performed using a level of significance α = 0.05. Each student writes her calculated p-value on the board. Assuming a class size of 30 students, the board will contain 30 calculated p-values. The p-values are calculated under the assumption that H0 : p = 1/9 is true (when, in fact, p = 1/3), so the p-values will tend to be small. displays example class p-values.
Figure 7. Example Class P-Values
The point that small p-values contradict H0 is discussed with students. However, some students will not obtain small p-values. We ask students to examine the class p-values and count the number of p-values falling at or below the 0.05 cut-off. These p-values correspond to a rejection of H0(a correct decision). The remaining p-values falling above the 0.05 cut-off represent a failure to reject H0 (a Type II error). Since 30 samples are taken, and 30 tests are performed, students can see that some samples result in a correct decision and other samples result in an incorrect decision (Type II error). Students are asked to calculate the fraction of incorrect decisions to obtain a simulated value for the Type II error rate, β. For the example class data the simulated β value is 5/30 = 0.17. We ask students to explain how to interpret a Type II error rate. If we repeatedly perform the procedure of selecting a sample and using the sample data to test a hypothesis about a population parameter, the Type II error rate is the percentage of the samples that would lead us to fail to reject a false null hypothesis.
The second test is performed using α = 0.20. The p-value is the same as for the first test; however, the α value has been increased. We ask students to examine the class p-values and count the number of p-values falling at or below the 0.20 cut-off. These p-values correspond to a rejection of H0 (a correct decision). The remaining p-values falling above the 0.20 cut-off represent a failure to reject H0 (a Type II error). Students are asked to calculate the fraction of non-rejections of H0 out of the 30 tests to obtain a simulated value for β. For the example class data the simulated β value is 1/30 = 0.03. In examining the class results, students will note that an increase in the level of significance α results in a decrease in the Type II error rate. We ask students to explain how the level of significance and Type II error rates are related. The level of significance is inversely related to the Type II error rate. If, for instance, we decrease the value of α, we are making it more difficult to reject the null hypothesis, which in turn will increase the chances of failing to reject a false null hypothesis; therefore, increasing the Type II error rate.
2.4.2 Illustrating Type I Errors
Students use their GOLO data to perform two hypothesis tests of H0 : p = 1/3 versus HA : p ≠ 1/3. The tests are performed with different levels of significance. Since the true value of p = 1/3, performing these tests provides an opportunity to illustrate properties of p-values and Type I error.
The first test of H0 : p = 1/3 versus HA : p ≠ 1/3 is performed using α = 0.05. The second test is performed using α = 0.20. The p-values are calculated under the assumption that H0 : p = 1/3 is true, so the p-values will tend to be large. displays example class p-values.
Figure 8. Example Class P-Values
The point that large p-values do not contradict H0 is discussed with students. However, some students will not obtain large p-values. We ask students to write their p-values on the board. Each p-value falling at or below each of the level of significance values (α = 0.05 and α = 0.20) represents a rejection of H0 (a Type I error). Each p-value falling above the cut-offs represents a failure to reject H0 a correct decision). Since 30 samples are taken, and 30 tests are performed, students can see that some samples result in a correct decision and other samples result in an incorrect decision (Type I error). Students are asked to calculate the fraction of rejections of H0 out of the 30 tests to obtain a simulated value for each level of significance. For the example class data the simulated Type I error rates are 4/30 = 0.13 and 8/30 = 0.27 corresponding to levels of significance of α = 0.05 and α = 0.20; respectively. We ask students to explain how to interpret a Type I error rate. If we repeatedly perform the procedure of selecting a sample and using the sample data to test a hypothesis about a population parameter, the Type I error rate is the percentage of the samples that would lead us to reject a true null hypothesis.
In this part of the activity we use the same data set to perform two different hypothesis tests at two different levels of significance. The instructor should emphasize that the level of significance, null hypothesis, and alternative hypothesis should be determined prior to data collection. We use the same data for multiple hypothesis tests to save time. Technically, we should have collected four separate data sets, one for each of the four tests conducted.
3. Extensions
In this section we present extension GOLO activities that can be used to illustrate the geometric distribution, hypergeometric distribution, negative binomial distribution, and the distribution of the first order statistic. Each extension activity stands alone and can be done without having completed any of Parts 1 through 4 of the main activity.
3.1 3.1 Illustrating the Geometric Distribution
In this extension students explore the properties and use of the geometric distribution. Prior to completing this extension, students have been introduced to the concept of a discrete random variable. In addition, students have constructed probability distributions in table form.
Each student needs a copy of the Background Sheet (Appendix A.0) and the Extension 1 Worksheet (Appendix B.1)
The GOLO game often ends by needing to roll exactly one die. Suppose that you are playing GOLO and have come down to having only one die remaining. For some inexplicable reason the “golfers” that you are playing against have left the table (obviously assuming that your integrity is unflappable). Further, you decide that you are going to cheat by rolling the die until a par or better is obtained! This leads us to what is called the geometric distribution.
The setting for a geometric random variable is:
| ◦ | r independent observations (usually called trials) where (unlike the binomial setting) r is not known beforehand, | ||||
| ◦ | each observation is categorized as either a success or a failure, and | ||||
| ◦ | the probability of a success, denoted by p, is the same for each observation. | ||||
The number of trials R until the first success is called a geometric random variable and is said to have a geometric distribution. The probability that it takes r trials until the first success is: Pr(R=r) = p(1-p)r-1, where r = 1,2,3,…; 0 ≤ p ≤ 1.
On the Extension 1 Worksheet students comment on the characteristics of the geometric setting and explain why the number of rolls of a single die until a par or better is obtained can be considered a geometric random variable. Each roll of the die is an independent trial whose outcome can be categorized as either a success (par or better) or a failure. The probability of a success is the same for each trial and the number of trials required to obtain an outcome of par or better is not known beforehand. The probability of success on any trial is p = 1/3. Furthermore students argue that it does not matter which die is left, because there is a 1/3 chance of getting par or better on each of the 9 dice.
Students calculate the following probabilities:
| ◦ | the probability that a par or better is obtained on the first roll of the die: | ||||
| ◦ | the probability that the die must be rolled at most twice to get par or better:
| ||||
| ◦ | the probability that the die must be rolled at least twice to get par or better:
| ||||
| ◦ | the probability that the die must be rolled at least 3 times and no more than 5 times to get a par or better:
| ||||
Students find the first ten values for the theoretical cumulative distribution for the number of rolls until a par or better is achieved.
In order to examine the empirical cumulative distribution, we ask each student to roll one die repeatedly until obtaining a par or better and keep track of the number of rolls that it takes. Each student repeats this process 10 times and on the Extension 1 Worksheet completes a table similar to .
Table 3. Example individual data collection table.
Once each student has completed 10 repetitions, individual results are copied onto the board in order to obtain class results. Students use the outcomes from the entire class (consisting of 30 students) to develop an empirical cumulative distribution by completing a table on the Extension 1 Worksheet. provides an example empirical cumulative distribution.
Table 4. Example comparison of theoretical and empirical cumulative distributions.
Students compare the theoretical cumulative distribution and the empirical cumulative distribution to determine if the geometric model proposed is a reasonable model for the class data. If the theoretical values are close to the empirical values, then the geometric model is reasonable. For the example class data, when we compare the two distributions, we find that most values are very close with the biggest difference when x = 6 with the theoretical value of 0.9122 and the empirical value of 0.8900. Thus, it seems that the geometric model with p = 1/3 is a reasonable choice for the number of rolls of a GOLO die until a par or better is achieved.
3.2 Illustrating the Hypergeometric Distribution
In this extension, students explore the properties and use of the hypergeometric distribution. Prior to completing this extension, students have worked with discrete random variables and have learned counting techniques.
Each student needs a copy of the Background Sheet (Appendix A.0) and the Extension 2 Worksheet (Appendix B.2)
When a GOLO die rolls off of the designated field of play (for example, the table), it is out of bounds. Whenever dice are rolled out of bounds, the rules of GOLO stipulate that a player must add a two stroke penalty to each die that rolls out of bounds. The rolls that are in bounds are voided, and the player must select at least one of the out-of-bounds dice. Suppose that all 9 dice are rolled and M of the dice roll out of bounds. Let X denote the number of colored dice (i.e. par 3 and par 5 dice) that roll out of bounds. This leads us to what is called the hypergeometric distribution.
The setting for a hypergeometric random variable is characterized by the following:
| ◦ | a finite population of N items, | ||||
| ◦ | of which M have a certain characteristic, and | ||||
| ◦ | a sample of size n is drawn without replacement (i.e. items cannot be resampled). | ||||
In this setting the number of items X in the sample that have the characteristic is said to have a hypergeometric distribution. The probability of x items having a characteristic in a sample of size n drawn from a population of size N that has M items with the characteristic can be found as: , where max (0, n - N + M) ≤ x ≤ min (n, M).
We ask students to consider a roll in the game of GOLO of all 9 dice of which 4 are colored dice. Students are told to assume that 3 of the dice roll out of bounds. Students identify the values of N = 9 dice rolled, M = 4 colored dice rolled, and n = 3 dice rolled out of bounds.
Students explain the rationale of the lower bound of x ≥ max (0, n − N + M) and the rationale for the upper bound of X ≤ min (n, M) for the probability statement Pr (X = x) where the random variable X represents the number of colored dice that roll out of bounds. Since we cannot have a negative number of colored dice rolling out of bounds, x ≥ 0. Since we are selecting n − x dice out of N − M dice, n − x ≤ N − M so n − N + N + M ≤ x. Thus x ≥ max (0, n − N + M). Since x is the number of colored dice that roll out of bounds, x cannot be greater than the total number of dice selected, n, and x cannot be greater than the total number of colored dice, M. Thus, x ≤ min (n, M).
Students calculate the following probabilities:
| ◦ | the probability that none of the colored dice are out of bounds:
| ||||
| ◦ | the probability that at most 1 of the colored dice are out of bounds:
| ||||
| ◦ | the probability that at least 1 of the colored dice are out of bounds:
| ||||
Students find the theoretical cumulative distribution for the number of colored dice that are rolled out of bounds and on the Extension 2 Worksheet they complete a table similar to the first two columns of . For comparison, SPSS was used to simulate 300 trials and results are given in the third column of .
Table 5. Theoretical cumulative distribution.
3.3 Illustrating the Negative Binomial Distribution
In this extension, students explore the properties and use of the negative binomial distribution.
Prior to completing this part of the activity, students have worked with binomial random variables.
Each student needs a copy of the Background Sheet (Appendix A.0) and the Extension 3 Worksheet (Appendix B.3).
One of the two blue GOLO dice has the potential of rolling an eagle. Suppose that this blue die is successively rolled until R (R = 1,2,…) eagles are rolled. Let Z denote the number of times this die is rolled until the Rth eagle is rolled. This leads us to the negative binomial distribution.
The setting for a negative binomial random variable is:
| ◦ | z independent observations (usually called trials) where z is not known beforehand, | ||||
| ◦ | each observation is categorized as either a success or a failure, and | ||||
| ◦ | the probability of a success, denoted by p, is the same for each observation. | ||||
In this setting the number of trials Z until the Rth success is called a negative binomial random variable and is said to have a negative binomial distribution. The probability that it takes z rolls until the Rth success can be found as: where z = R, R + 1, R + 2,…; 0 ≤ p ≤ 1.
We ask students to assume that they are trying to roll the blue GOLO die named Par 5A until two eagles are obtained. Students comment on the characteristics of the negative binomial setting to explain why the number of rolls until two eagles are obtained can be considered a negative binomial random variable. A trial consists of rolling the blue Par 5A die. Trials are independent and each results in either a success (an eagle is obtained) or a failure (an eagle is not obtained) with the success probability staying the same from trial to trial (p = 1/12). Since we are interested in rolling the die until we obtain R = 2 successes, the number of trials Z is not fixed and Z has a negative binomial distribution.
Students calculate the following probabilities:
| ◦ | the probability that two successive rolls result in two eagles:
| ||||
| ◦ | the probability that the die must be rolled at least three times in order to get two eagles:
| ||||
| ◦ | the probability that the second eagle occurs on the tenth roll:
| ||||
Students find the theoretical cumulative distribution for the number of trials needed to obtain two eagles and on the Extension 3 Worksheet they complete a table similar to the first two columns of . For comparison, SPSS was used to simulate 500 trials and results are given in the third column of .
Table 6. Theoretical cumulative distribution.
The instructor might wish to have students collect some data to illustrate the hypergeometric and negative binomial distributions. However, to save classroom time, a complete simulation done with a computer software package might be a more practical approach for data collection.
3.4 Illustrating the Distribution of the First Order Statistic
In this extension, we discuss how students in a mathematical statistics course can use GOLO to explore the properties of the distribution of the first order statistic. Prior to completing this part of the activity, students have studied distribution theory associated with order statistics.
Each student needs a copy of the Background Sheet (Appendix A.0) and the Extension 4 Worksheet (Appendix B.4)
To begin the GOLO game all 9 dice are rolled, and a player selects the die (or dice) with the minimum score relative to par. Let I denote the set of labels for the 9 dice such that I = {3A, 3B, 4A, 4B, 4C, 4D, 4E, 5A and 5}. Two of the dice (3A and 5A) have the potential of rolling an eagle. The best outcome for the remainder of the dice is birdie. Let X3A, X3B, X4A, …, X4E, X5A, X5B be the 9 independent variates where X3A and X5A have cumulative distribution function FE (x) and X3B, X4A, …, X4E and X5B have cumulative distribution function FB (x).
We ask students to develop expressions for both FE (x) and FB (x). Here, we consider values below par to be negative, values at par to be zero, and values above par to be positive (see ). Then, the corresponding expressions are:
We then ask students to develop an expression for the cumulative distribution of the first order statistic, denoted by X(1). The corresponding expression is given by:
where
Students are asked to use EXCEL to compute the values for F(1)(x) when x = − 2, − 1,…, 5. Students use EXCEL to calculate the second column in Table7. We then ask students to use EXCEL to compute the values for the probability distribution of the first order statistic (denoted by p(1)(x)) and compute the expected value of this distribution. Students use EXCEL to calculate the third and fourth columns in .
Table 7. Computed values associated with the first order statistic.
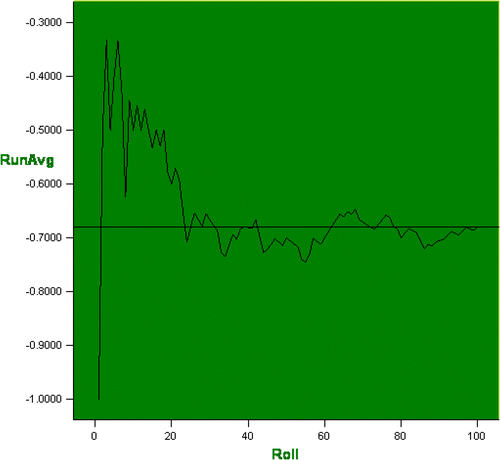
In order to examine the expected value empirically, we ask each student to roll the 9 GOLO dice 100 times and keep track of the minimum score relative to par on each roll. In an effort to demonstrate the Law of Large Numbers, each student is asked to compute the running average after each roll and then use a statistical software package to graph these running averages. We have demonstrated the type of results that the students can expect to obtain in . Note in this simulation the final running average was: −0.6800 (a value that is converging on the computed expected value of −0.6747).
Figure 9. Example Demonstration of the Law of Large Numbers
4. Conclusions
Our experience with GOLO indicates that nearly everyone finds the game intrinsically interesting. The variety in the dice and the connection to a competitive sport make the game more interesting than something like Yahtzee where the dice have identical faces. Analyzing the GOLO dice roll data is a fun and interesting way to introduce the binomial distribution and the sampling distribution of a sample proportion. Active data collection helps reinforce the idea of repeated sampling with different samples producing different results.
This paper describes a number of scenarios that revolve around GOLO that can be used to demonstrate inferences for proportions and other probability concepts.
Proportions of rolls resulting in par or better can be calculated for different numbers of rolls. Changing the sample size allows students to formulate ideas about the center and spread of the distribution of a sample proportion and to determine the relationship between sample size and variability. The instructor can refer to this activity when discussing the distribution of a sample proportion from a theoretical perspective. Students have examined empirical properties of the sampling distribution and will be ready to advance to a discussion of the theoretical properties.
Constructing and plotting class confidence intervals aids in the correct interpretation of the confidence level. Repeated hypothesis testing helps students understand the ideas of p-value and Type I and Type II errors.
In addition, concepts from the GOLO game can be used to illustrate discrete probability distributions and the distribution of the first order statistic.
Acknowledgment
The authors gratefully acknowledge Patrick Shea for developing GOLO and supporting our efforts to utilize GOLO in our courses.
References
- Golf Background adapted from: Golf – Wikipedia, the free encyclopedia at: http://en.wikipedia.org/wiki/Golf.
- Golf Definition taken from: http://www.m-w.com/dictionary/golf.
- GOLO Background adapted from: igolo.com.
Appendix A:
Activity Worksheets
A.0 Background Sheet – How LO can you GO?
Background on GOLO and Golf
A golf hole is classified by its par. Par is the maximum number of strokes that a skilled golfer should require to complete the hole. One's score relative to par on a hole is given a nickname.
The table below displays the nickname for the common scoring outcomes.
The goal of the GOLO game, as in real golf, is to shoot the lowest possible score. The 9 dice represent 9 golf holes on a typical golf course. Each die has twelve sides with various scores on each side.
There are two par 3 dice (which are red), five par 4 dice (which are white), and two par 5 dice (which are blue). We call the two par 3 dice Par 3A and Par 3B. The twelve equally-likely faces on these dice are numbered as follows:
Par 3A – 1, 3, 3, 3, 4, 4, 5, 5, 6, 6, 6, 8 and Par 3B – 2, 3, 3, 3, 4, 4, 5, 5, 6, 6, 6, 7.
All five par 4 dice are the same. The twelve equally-likely faces on the par 4 dice are numbered as follows:
Par 4 – 3, 4, 4, 4, 5, 5, 6, 6, 7, 7, 7, 8.
We call the two par 5 dice Par 5A and Par 5B. The twelve equally-likely faces on the dice are numbered as follows:
Par 5A – 3, 5, 5, 5, 6, 6, 7, 7, 8, 8, 8, 10 and Par 5B – 4, 5, 5, 5, 6, 6, 7, 7, 8, 8, 8, 9.
For convenience, on each of the die, a par score is outlined by a square, a birdie is outlined by a circle, and an eagle is outlined by a star.
The basic rules of GOLO are very simple:
| Step 1. | Roll all nine dice. | ||||
| Step 2. | Remove your lowest score(s). You must remove at least one die, but you may remove as many as you wish. | ||||
| Step 3. | Place the remaining dice in the cup and roll again. | ||||
| Step 4. | Continue to roll until all nine dice have been removed. | ||||
| Step 5. | Add up the scores for all nine dice to get your nine-hole score. (To play 18 holes, repeat the process and add both nine-hole scores together.) | ||||
A.1 Worksheet 1 – How LO can you GO? Binomial Distribution
The binomial setting is characterized by the following:
| ◦ | n independent observations (usually called trials), | ||||
| ◦ | each observation is categorized as either a success or a failure, and | ||||
| ◦ | the probability of a success, denoted by p, is the same for each observation. | ||||
In this setting the number of successes, denoted by X, is called a binomial random variable and is said to have a binomial distribution.
Each roll in the game of GOLO can be thought of as a binomial experiment where success on a given die is defined as a specified outcome or better on the up-face. For example, suppose that we define a success as par or better on a die. If n dice are rolled, the probability that X dice are par or better follows a binomial distribution. The probability that n rolls result in x successes can be found as: where x = 0,1,2,…,n and p is the probability of success on each roll; 0 ≤ p ≤ 1.
Questions: Assume that a player is beginning a “new nine” to complete the following questions.
Above we wrote, “If n dice are rolled, the probability that X dice are par or better follows a binomial distribution.” Comment on the three characteristics of the binomial setting to explain why the number of pars or better obtained by rolling the 9 GOLO dice can be considered a binomial random variable.
What are the values of the number of trials n and the probability of success p on any trial?
What is the probability that you throw exactly 2 pars or better?
What is the probability that you throw at most 1 par or better?
What is the probability that you throw at least 1 par or better?
What is the probability that you throw at least 3 pars or better and no more than 6 pars or better?
The theoretical cumulative distribution for a random variable X evaluated at a number x is defined as the probability of getting a value less than or equal to x. For example, the theoretical cumulative distribution for the binomial random variable defined above evaluated at x = 2 is: Pr (X ≤ 2) = Pr (X = 0) + Pr (X = 1) + Pr (X = 2). This corresponds to the probability of 2 or fewer pars or better in the roll of all 9 dice.
Find the theoretical cumulative distribution for the number of pars or better in a roll of all nine dice. Complete the second column of the Theoretical vs. Empirical Cumulative Distributions table with the correct probabilities.
Theoretical vs. Empirical Cumulative Distributions
The probabilities found in questions 3, 4, 5, 6, and 7 are called theoretical probabilities because they are based on the properties of the dice, NOT on the results of actually rolling the dice. Probabilities based on actually rolling the dice (i.e., on real data) are called empirical probabilities.
Roll all nine dice 50 times and count the number of successes (defined by par or better) that are thrown on each roll of the nine dice. Recall that outcomes of par or better on the dice are outlined by circles, squares, and stars. Complete the Individual Empirical Results table. Write your results on the board. Wait until the entire class' numbers of successes are tallied to continue.
Individual Empirical Results
The empirical cumulative distribution for a random variable X evaluated at a number x is defined as the proportion of values less than or equal to x for an actual sample of data. For example, the empirical cumulative distribution for the class data evaluated at x = 2 is the proportion of the class' rolls that resulted in 2 or fewer pars or better.
Use the outcomes from the class' rolls to develop an empirical cumulative distribution. Complete the third column of the table in Question 7 with the correct proportions.
Compare the theoretical cumulative distribution (from Question 7) and the empirical cumulative distribution (from Question 9). Is the binomial model proposed a reasonable model for the class' data? Explain.
A.2 Worksheet 2 – How LO can you GO? Sampling Distribution of the Sample Proportion
Purpose:
This activity is intended to illustrate properties of the sampling distribution of a sample proportion.
Statistical Guide:
Suppose that we conduct a binomial experiment with n trials. Or, suppose we record the value of a categorical variable for a sample of n individuals. In either case, we can compute the statistic = the sample proportion; that is, the proportion of trials resulting in success (or the proportion of individuals in a sample with a specified value of a measured categorical variable). If we repeated the binomial experiment or took a new sample, we would probably get a different value for the sample proportion. The sampling distribution for a statistic is the probability distribution of possible values of the statistic for repeated samples of the same size taken from the same population.
Instructions:
Suppose that you were to roll a GOLO die an extremely large number of times. What proportion of the rolls would you expect to be par or better? p = ______________.
What if we were not able to examine the die and calculate the proportion of rolls resulting in par or better? What if we were stuck rolling the die and using the results from our rolls to estimate the proportion of all rolls that would result in a par or better? That is, what if we wanted to use the sample proportion of rolls that are par or better (which we will denote by ) in order to estimate the population proportion of rolls that are par or better (which we will denote by p)?
Consider the outcome of rolling the GOLO dice as an experiment with 9 trials. Roll the GOLO dice once and count the number of rolls that are par or better (outcomes outlined by circles, squares, or stars). Write the number of rolls that are par or better in the appropriate location on the Individual Data Table. Calculate the proportion of rolls that are par or better and write the value in the appropriate location on the Individual Data Table. Conduct this experiment three more times. Each time, double the number of times that you roll the GOLO dice. For example, the second time, roll the 9 GOLO dice twice in order to obtain 18 trials, and so on.
Individual Data Table
Copy your sample proportions onto the board in the appropriately labeled columns. Use two decimal places.
Questions:
Input the class proportion of rolls resulting in par or better in the Class Data table. Record the proportions as decimals with two significant digits.
Class Data
Answer the following questions using the Class Data. Remember that p = 1/3.
(a) For each sample size calculate the mean and median of the sample proportions.
(b) What do you think is the relationship between the center of the distribution of the sample proportions and the value of the population proportion?
(c) For each sample size calculate the standard deviation of the sample proportions.
(d) For which sample size is the standard deviation the largest and for which sample size is the standard deviation the smallest? Why do you suppose this happens?
(e) Construct comparative boxplots to display the distributions of the sample proportions for the four sample sizes.
A.3 Worksheet 3 – How LO can you GO? Confidence Interval for a Proportion
Purpose:
This activity is intended to illustrate properties of confidence intervals and constructing a confidence interval for a proportion.
Statistical Guide:
A (1 − α) 100% confidence interval for p, the population proportion, is given by: where
is an appropriate percentile of the standard normal distribution, n is the size of the random sample,
is the sample proportion, and both
This interval gives a range of values within which we expect the population proportion, p, to fall. The interval is based on just one sample proportion. The sample proportion, is a point (single number) estimate for the population proportion, p. A confidence interval estimate for the population proportion, p, is an interval of values, computed from the sample data, that we believe contains p. The confidence level is the probability that the estimation method will give an interval that contains the parameter (p, in this case). The confidence level is denoted by 1 − α, where common values of α are 0.10, 0.05, and 0.01, corresponding to 90%, 95%, and 99% confidence, respectively.
Instructions:
Suppose that you were to roll a GOLO die an extremely large number of times. What proportion of the rolls would you expect to be par or better? p = ______________.
What if we were not able to examine the die and calculate the proportion of rolls resulting in par or better? What if we were stuck rolling the die and using the results from our rolls to estimate the proportion of all rolls that would result in a par or better? That is, what if we wanted to use the sample proportion of rolls that are par or better in order to estimate the population proportion of rolls that are par or better?
Consider the outcome of rolling the GOLO dice as an experiment with 9 trials. Roll the GOLO dice four times in order to obtain 36 trials. Keep track of the number of rolls that are par or better (outcomes outlined by a circle, square, or a star). Calculate the proportion of rolls that are par or better.
sample proportion of rolls resulting in par or better: =______________.
Questions: Remember that p = 1 / 3
Use your data from 36 trials (n = 36) to construct an 80% confidence interval for the proportion of rolls resulting in par or better. Once you have constructed your confidence interval, write your confidence interval on the board. On the board, you will see all of the confidence intervals constructed by the class.
(a) How many of the confidence intervals include the value of p = 1/3? What percent is this?
(b) What percent of the confidence intervals did we expect to include the value of p = 1/3?
(c) Explain, using complete sentences, how to interpret a level of confidence of 80%.
Use your data from 36 trials (n = 36) to construct a 99% confidence interval for the proportion of rolls resulting in par or better. Once you have constructed your confidence interval, write your confidence interval on the board. On the board, you will see all of the confidence intervals constructed by the class.
(a) How many of the confidence intervals include the value of p = 1/3? What percent is this?
(b) What percent of the confidence intervals did we expect to include the value of p = 1/3?
(c) Explain, using complete sentences, how to interpret a level of confidence of 99%.
(d) Explain, using complete sentences, how increasing the confidence level from 80% to 99% changed the confidence intervals.
(e) Explain, using complete sentences, an intuitive justification for the relationship between the width of the confidence intervals and the level of confidence.
(f) Give one advantage of using 99% confidence rather than 80% confidence. Give one disadvantage.
A.4 Worksheet 4 – How LO can you GO? Hypothesis Test on a Proportion
Purpose:
This activity is intended to illustrate properties of hypothesis testing and performing hypothesis tests on a proportion.
Statistical Guide:
We want to test hypotheses about the population proportion p. The null hypothesis is H0 : p = p0, where p0 is the hypothesized value for p. The data are assumed to be a random sample of size n from the population, where n must be large enough so that np0 ≥ 10 and n (1 − p0) ≥ 10. From the sample, we calculate the sample proportion, . We base our decision about p on the standardized sample proportion,
. This z-score is called the test statistic and its distribution under H0 is approximately standard normal.
We calculate the p-value for the test, which depends on how the alternative hypothesis is expressed:
| (1) | If HA : p > p0, then the p-value is the area to the right of the observed test statistic under the H0 model. | ||||
| (2) | If HA : p < p0, then the p-value is the area to the left of the observed test statistic under the H0 model. | ||||
| (3) | If HA : p ≠ p0, then the p-value is the sum of the area to the left of negative the absolute value of the observed test statistic and the area to the right of the absolute value of the observed test statistic under the H0 model. | ||||
The p-value is the probability, computed under the assumption that H0 is true, of obtaining a test statistic value at least as favorable to HA as the value that actually resulted from the data. H0 is rejected if the p-value is small enough.
Rejecting the null hypothesis when in fact it is true is called a Type I error. The significance level, α, is the chance of committing a Type I error. H0 is rejected if the p-value ≤ α. Failing to reject the null hypothesis when in fact it is not true is called a Type II error. The chance of committing a Type II error is denoted β.
Instructions:
Consider the outcome of rolling the GOLO dice as an experiment with 9 trials. Roll the GOLO dice four times in order to obtain 36 trials. Keep track of the number of rolls that are par or better. Calculate the proportion of rolls that are par or better.
sample proportion of rolls resulting in par or better:
Questions: Remember that p = 1 / 3.
Based upon your sample proportion of rolls resulting in par or better, perform a test of: H0 : p = 1 / 9 versus HA : p > 1 / 9. Note: H0 is false. A correct decision would be to reject H0. An incorrect decision would be to fail to reject H0. (This would be a Type II error.)
| |||||||||||||||||||||||||||||
Based upon your sample proportion of rolls resulting in par or better than par, perform a test of: H0 : p = 1 / 3 versus HA : p ≠ 1 / 3. Note: H0 is true. A correct decision would be to fail to reject H0. An incorrect decision would be to reject H0. (This would be a Type I error.)
| |||||||||||||||||||||||||||||
| (b) | Use a 20% level of significance (α = .20). calculated test statistic = p-value = decision = expected number of rejections of H0 for the class = number of rejections of H0 for the class = | ||||||||||||||||||||||||||||
| (c) | Explain, using complete sentences, how to interpret a Type I error rate in terms of repeatedly performing the procedure of selecting a sample and using the sample data to test a hypothesis about a population parameter. | ||||||||||||||||||||||||||||
Appendix B:
Extensions
B.1 Extension 1 Worksheet – How LO can you GO? Geometric Distribution
Often in GOLO the game ends by needing to roll exactly one die. You've used up 8 of the 9 dice and are left with one die. You roll that die and just hope that it turns out to be a par or better, because you've got to take whatever it is. This leads us to what is called the geometric distribution.
The setting for a geometric random variable is characterized by the following:
| ◦ | r independent observations (usually called trials) and unlike the binomial setting r is not known beforehand, | ||||
| ◦ | each observation is categorized as either a success or a failure, and | ||||
| ◦ | the probability of a success, denoted by p, is the same for each observation. | ||||
In this setting the number of trials R until the first success is called a geometric random variable and is said to have a geometric distribution. The probability that it takes r rolls until the first success can be found as: Pr (R = r) = p (1 − p) r − 1, where r = 1,2,3,…; 0 ≤ p ≤ 1.
Questions: Suppose that you are playing GOLO and have come down to having only one die remaining. For some inexplicable reason the “golfers” that you are playing against have left the table (obviously assuming that your integrity is unflappable). You decide to cheat by rolling the die until a par or better is obtained!
Comment on the characteristics of the geometric setting to explain why the number of rolls until you throw a par or better can be considered a geometric random variable.
What is the value of the probability of success p on any trial? Does it matter which die is left?
What is the probability that you get a par or better on the first roll of the die?
What is the probability that you roll the die at most twice to get par or better?
What is the probability that you roll the die at least twice to get par or better?
What is the probability that you roll the die at least 3 times and no more than 5 times to get par or better?
Find the first ten values for the theoretical cumulative distribution for the number of rolls until a par or better is achieved. Complete the second column of the Theoretical vs. Empirical Cumulative Distributions table with the correct probabilities.
Theoretical vs. Empirical Cumulative Distributions
Roll one die repeatedly until you get a par or better. Keep track of the number of rolls that it takes for you to get a par or better. Repeat this process 10 times. Complete the Individual Empirical Results table.
Individual Empirical Results
Wait until the entire class' numbers of rolls until first success are tallied to continue.
Use the outcomes from the class' rolls to develop an empirical cumulative distribution for the outcomes. Complete the third column in the Theoretical vs. Empirical Cumulative Distributions table with the correct proportions.
Compare the theoretical cumulative distribution (from Question 7) and the empirical cumulative distribution (from Question 9). Is the geometric model proposed a reasonable model for the classes' data? Explain.
B.2 Extension 2 Worksheet – How LO can you GO? Hypergeometric Distribution
When a GOLO die rolls off the designated field of play (for example, the table), it is out of bounds. Suppose that all 9 dice are rolled and M of the dice roll out of bounds. Let X denote the number of colored dice that roll out of bounds. This leads us to what is called the hypergeometric distribution. The setting for a hypergeometric random variable is characterized by the following:
| ◦ | a finite population of N items, | ||||
| ◦ | of which M have a certain characteristic, | ||||
| ◦ | and a sample of size n is drawn without replacement (i.e., the same item can not be resampled). | ||||
In this setting the number of items x in the sample that have the characteristic is said to have a hypergeometric distribution.
The probability of x items having a characteristic in a sample of size n drawn from a population of size N that has M items with the characteristic can be found as: where max (0, n − N = M) ≤ x ≤ min (n, M).
Questions:
Consider a roll in the game of GOLO of all 9 dice of which 4 are colored dice (the par 3s and par 5s). Suppose that 3 of the dice roll out of bounds.
What are the values of N, M, and n for this situation?
In the probability statement Pr (X = x) above we wrote “where max (0, n − N + M) ≤ x ≤ min (n, M).” Explain why x ≥ max (0, n − N + M).
In the probability statement Pr (X = x) above we wrote “where max (0, n − N + M) ≤ x ≤ min (n, M).” Explain why x ≤ min (n, M).
What is the probability that none of the colored dice are out of bounds?
What is the probability that at most 1 of the colored dice are out of bounds?
What is the probability that at least 1 of the colored dice are out of bounds?
Find the theoretical cumulative distribution for the number of colored dice that are rolled out of bounds. Complete the Theoretical Cumulative Distribution table with the correct probabilities.
Theoretical Cumulative Distribution
B.3 Extension 3 Worksheet – How LO can you GO? Negative Binomial Distribution
One of the blue GOLO dice, Par 5A, has the potential of rolling an eagle. Suppose that this blue die is successively rolled until R eagles are rolled. Let Z denote the number of times this die is rolled until the Rth eagle is rolled. Then, Z follows a negative binomial distribution.
The setting for a negative binomial random variable is characterized by the following:
| ◦ | z independent observations (usually called trials) where z is not known beforehand, | ||||
| ◦ | each observation is categorized as either a success or a failure, and | ||||
| ◦ | the probability of a success, denoted by p, is the same for each observation. | ||||
In this setting the number of trials Z until the Rth success is called a negative binomial random variable and is said to have a negative binomial distribution. The probability that it takes z rolls until the Rth success can be found as: where z = R, R + 1,R + 2.…; 0 ≤ p ≤ 1.
Questions: Suppose that you are trying to roll the blue GOLO die, Par 5A, until you get two eagles.
Comment on the characteristics of the negative binomial setting to explain why the number of rolls until two eagles are obtained can be considered a negative binomial random variable.
What is the value of the probability of success p on any trial?
What is the probability that two successive rolls result in two eagles?
What is the probability that the die must be rolled at least three times in order to get two eagles?
What is the probability that the second eagle occurs on the tenth roll?
Find the theoretical cumulative distribution for the number of rolls required to obtain two eagles. Complete the Theoretical Cumulative Distribution table with the correct probabilities.
Theoretical Cumulative Distribution
B.4 Extension 4 Worksheet – How LO can you GO? First Order Statistics
To begin the GOLO game all 9 dice are rolled, and a player selects the die (or dice) with the minimum score relative to par. Let I denote the set of labels for the 9 dice such that I = {3A, 3B, 4A, 4B, 4C, 4D, 4E, 5A and 5B}. Two of the dice (3A and 5A) have the potential of rolling an eagle. The best outcome for the remainder of the dice is birdie. Let X3A, X3B, X4A, …, X4E, X5A, X5B be the 9 independent variates where X3A and X5A have cumulative distribution function FE(x) and X3B, X4A, …, X4E and X5B have cumulative distribution function FB(x).
Questions:
Develop an expression for FE(x), the cumulative distribution function for the die with the potential of rolling an eagle.
Develop an expression for FB(x), the cumulative distribution function for the die whose best outcome is a birdie.
Develop an expression (denoted by F(1)(x)) for the cumulative distribution function of the first order statistic as a function of both FE(x) and FB(x).
Use EXCEL to compute the values for F(1)(x) when x = − 2, − 1, …, 5. Note: Place the values of x = − 2, −1, …, 5 in the first column, and place the values of F(1)(x) in the second column.
Use EXCEL to compute the values for the probability distribution of the first order statistic (denoted by p(1)(x)). Place the values of p(1)(x) in the third column.
Use EXCEL to compute the expected value of the first order statistic. Place the computed values of x* p(1)(x) in the fourth column and sum these computed values for the expected value.
In order to examine the expected value empirically, roll the 9 GOLO dice 100 times and keep track of the minimum score relative to par on each roll. In an effort to demonstrate the Law of Large Numbers, compute the running average after each roll and then use a statistical software package to make a line graph of these running averages after each roll.
Compare the final simulated running average obtained in Question 7 with the computed (theoretical) result obtained in Question 6.