
 ?Mathematical formulae have been encoded as MathML and are displayed in this HTML version using MathJax in order to improve their display. Uncheck the box to turn MathJax off. This feature requires Javascript. Click on a formula to zoom.
Abstract
In recent years, the Australian tertiary education sector embraced the gradual adaption of the dual mode system in course delivery in universities and higher degree education providers. In such systems, students have the option, as well as the flexibility, to undertake the same course in a face-to-face (F2F) environment and/or an online environment. This article presents an evaluation of the dual mode design of a first-year business statistics course delivered at the Griffith University. In this article, we discuss the various aspects of the dual mode design in the course, emphasizing the use of consistent teaching strategies for the F2F and online student cohorts. Moreover, we present a comparative analysis of learning satisfaction and academic performance of the two cohorts within the dual mode system. Using t-tests, nonparametric tests, and propensity score matching estimators we provide new insights into dual mode course design. Our results suggest no significant difference in student experiences and outcomes. Discussion and analysis presented in this article is useful as feedback for further improvement in teaching strategies in the delivery of dual mode courses.
1 Introduction
Since its popularization in 1993, the internet has transformed many facets of human life. In particular, our ability to deliver education services to students has been revolutionized. Distance education was made possible, increasing ease and convenience for education to be accessed by anyone, from anywhere (Paulsen et al. Citation1998; Browning Citation1999). Distance online education has emerged as a viable alternative to traditional face-to-face (F2F) classroom instruction, and has seen a significant worldwide increase in student enrollment over the past 20 years (Vioreanu 2018). For example, Allen and Seaman (Citation2008) reported that in 2008 online student enrollment in the United States experienced growth of approximately 13%, compared to a 1.2% increase in its overall higher education enrollments.
Over the past decade, Australian universities and other higher education providers have gradually adapted the use of the dual mode systems in their course delivery. In the dual mode system, education providers deliver their courses concurrently for on-campus F2F students and off-campus online students. Moreover, the dual mode delivery structure provides students additional flexibility to switch between the F2F mode and the online mode in undertaking their studies. The same admission requirements and assessment criteria are applied to both cohorts of students. However, the teaching methods may not be the same resulting in differences in satisfaction or academic performance.
The adoption of the dual mode system has particularly raised some concerns among instructors. Online learning within the dual mode system is argued to lead to fairly superficial communications between students and instructors. Consequently, this may impact negatively upon the learning strategies used by the online student cohort (Ke and Xie Citation2009). In light of this, pedagogical emphasis in recent years has shifted toward the design of dual mode courses which aims to provide an equitable learning experience for both the F2F and online student cohorts. We hypothesize that when applying consistent teaching methods and strategies to both cohorts, we should not observe a significant difference in the student academic performance across the two groups, after controlling for potential selection bias.
Studies comparing differences in student satisfaction and/or performance in F2F to online modes for statistics courses have been relatively limited in numbers and country coverage. Mathieson (Citation2010) presented a useful review capturing the available studies published between 1990 and 2010. Following Mathieson, we conducted a further search to find the relevant studies from 2011 onwards. Our combined search results found 14 available studies in total. A majority of these studies were conducted in the United States, with the exception of two conducted in Israel (Yablon and Kat, 2001; Katz and Yablon Citation2003), and one conducted in Thailand (Suanpang and Petocz Citation2006). No studies were found on Australian students. reports the summary of these 14 studies. Of the outlined studies, only four studies report comparison in both the learning satisfaction and the academic performance parameters (Schutte Citation1998; Yablon and Katz Citation2001; Katz and Yablon Citation2003; Summers et al. Citation2005).
Table 1 Summary of Studies in Statistics courses – Satisfaction and Performance (F2F vs. Online).
Our research adds to the aforementioned literature on student satisfaction and performance in dual mode statistics courses. We provide a comparative analysis on the learning satisfaction and academic outcomes amongst students undertaking our statistics course, F2F against online, within the dual mode delivery structure. Our analysis will add to the ambivalent literature on student outcomes, and build upon the limited literature on learning satisfaction by testing for differences in student performance and satisfaction. We also contribute to the literature through the use of propensity score matching to evaluate the differences in academic performance. This method aims to address the self-selection bias surrounding the choice of online or F2F course enrollment, which has not been considered in past empirical analyses on academic performance. Our results suggest that when consistent teaching strategies are applied to both cohorts of students, no significant differences are observed in the learning experience and academic performance across the two groups of students.
The remainder of the article is organized as follows. A detailed discussion of the dual mode system of our introductory statistics course including course content, assessment design, and delivery strategy is discussed in Section 2. Section 3 presents the results for student learning satisfaction and academic performance of the F2F and online students. Section 4 summarizes our results and discusses the pedagogical implications of our findings.
2 Course and Delivery
The course we discuss is a first-year business statistics course offered at the Griffith University for the Bachelor of Commerce and Business programs. Focusing on problem recognition and application to real-world settings, the course covers two key areas of business statistics; descriptive and inferential methods. The primary objective of this course, along with many other introductory statistics courses is the development of statistical literacy (Rumsey Citation2002). By undertaking this module within their undergraduate curriculum, students develop the tools to effectively synthesize, analyze, and interpret data to make informed decisions in practice.
2.1 Course Duration and Content
Business statistics has been taught at the Griffith University for approximately 30 years. The course is delivered to students in F2F delivery mode at the two main campuses of the university, the Nathan campus and the Gold Coast campus, in Semester 1 and Semester 2 following a 13 week structure. The dual mode adaptation was first offered over the noncompulsory Summer Semester 2014/2015 which consists of a 10 week period between November and February. The dual mode offering has the same coverage of content to what is taught in Semester 1 and Semester 2. Students who chose to undertake their studies on-campus as a F2F student conducted their studies at the smaller campus of the university, the Logan campus. The Summer Semester attracts approximately a combined enrollment of 90–120 students in total in both the F2F and online cohorts. While flexibility is offered for students to switch between the F2F and online learning environment, we note that the majority of students remained in their enrolled mode of either F2F or online. Approximately only two online students per semester occasionally come to the F2F classes, while all of the F2F students stay with their on-campus enrollment.
2.2 Course Delivery
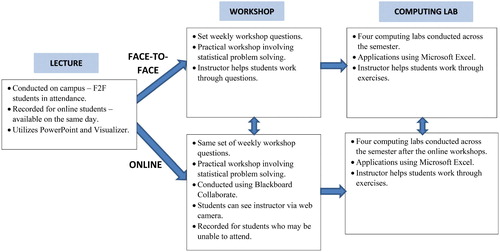
Contact with students includes weekly 2-hr lectures for the F2F students. The lectures emphasize various key statistical concepts and theories in the first hour, followed by relevant applications and worked examples.2 There are two key pedagogical reasons for the use of this lecture structure in our statistics course. First, the presentation of concepts prior to their application provides a balance between theory and application which is desirable for development of analytical, quantitative statistical skills and computer literacy (Moore Citation1997). Second, to achieve statistical literacy, the use of worked examples assists potential users of statistical information in the workplace (Gordon and Nicholas Citation2009). These weekly F2F lectures are recorded. Recordings are made available for online students within a few hours after the F2F lecture concludes. Online students who have queries regarding the lecture recordings send their questions to the instructor through email. These questions are then responded to promptly by the instructors. This approach is used to ensure that the content taught and the speed of delivery for the two cohorts of students is relatively consistent.
Complementary to the lectures, workshop sessions run each week for both the F2F and online students. The F2F workshops follow a standard one hour format where students complete exercises from the relevant textbook with assistance of the instructor. The instructor walks around the class room to help students on an individual or group basis, as well as working through the more difficult questions on the board with the class as a whole. As campus attendance is not possible for online students, we conduct a live one hour online workshop session. The live online workshops utilize the Blackboard Collaborate, a virtual classroom application to interact with the online students in a collaborative learning space. The live online workshops cover the exact same exercises as the F2F workshops. Attendance in F2F lectures and workshops (either F2F or in the live online environment) is not compulsory.3 All of these sessions however are recorded and made available for students who miss their session to access.
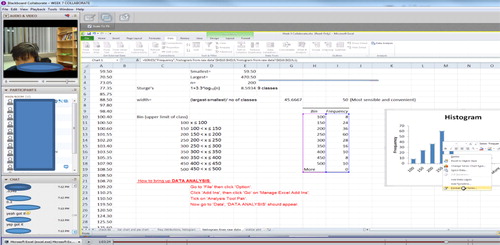
Through the use of a synchronous learning environment such as Blackboard Collaborate, the F2F classroom can be simulated and replicated to a significant extent for online students (McBrien et al. Citation2009). Blackboard Collaborate allows the instructor to share a content frame (including Microsoft Excel and PowerPoint), an interactive whiteboard where the instructor and students can write or draw, text chat to interact using words and emoticons, and audio chat to talk via a microphone. The use of the content frame and whiteboard is important to achieve consistency in teaching between the F2F and online cohorts. Furthermore, visual illustration using statistical tools or graphical methods are important to engage students in their cognitive learning space (Mayer and Gallini Citation1990). The instructor projects their image via the use of a web camera to close the geographical gap and promote student engagement through enhanced interaction (Fullwood and Doherty-Sneddon Citation2006). A snapshot of a Blackboard Collaborate session can be seen in Appendix A.
Along with the weekly F2F or online workshop sessions, there are four computer lab sessions where students learn to use Microsoft Excel to perform basic statistical analysis. Evidence within education research tells us that active “hands on” tasks such as computer labs improves the learning process through the engagement of student’s attention and memory (Basturk, Citation2005). Specifically, the computer labs encourage students to examine and visualize data to promote conceptual understanding rather than rely on mechanical or automated calculations (Moore Citation1997). The computer labs are conducted for both on-campus and online students using Microsoft Excel. A flow chart of the dual mode delivery design of our business statistics course is provided in .
Fig. 1 Dual mode course structure.
2.3 Assessment Structure
To promote consistency and fairness between the two cohorts, the F2F and online students complete the same assessment tasks. There are three components to the assessment; online quizzes (20%), computing assignment (20%), and final examination (60%). The design of the assessment structure aims to provide feedback on students’ learning throughout the semester, as well as providing a diverse range of assessment formats. This reflects the need for alternative approaches to student assessment to provide a broad evaluation regarding the ability and capacity of students’ critical thinking, communication, and reasoning skills (Gal and Garfield Citation1997).
The online quizzes provide students with the ability to use feedback and improve their learning throughout the semester, as well as a tool for the instructor to monitor students’ perceptions on the progressive learning activities (Garfield Citation1994). The second assessment item is a computing assignment. In this assessment, students are graded on their ability to use Microsoft Excel to synthesize, analyze, and interpret real data. Specifically, students should exhibit problem recognition and problem solving to summarize insight into the data in a meaningful manner. The use of a computing assignment encourages students to use a deeper approach to learning through active engagement with the course content (Thomas and Bain Citation1982; Scouller Citation1998). Last, to evaluate successful achievement of the learning outcomes, the final assessment is a closed book, supervised examination worth 60% of the final grade. On-campus attendance is required for both F2F and online students. Students are given 3 hr to complete the examination. Students are evaluated on problem recognition, selection of appropriate statistical methods and interpretation of results.
3 Analysis and Results
In this section, we present the results of the comparative analysis of learning satisfaction and academic performance of our F2F and online students. We hypothesize that the delivery strategy used in the course would provide an equitable learning experience for both the F2F and online students. Furthermore, the combination of the consistent teaching methods and the application of the same assessment structure should also translate to no significant difference in academic performance across the two cohorts after controlling for selection bias.
3.1 Data
The data utilized for the analysis comes from two sources. First, to analyze the difference in learning satisfaction we use data obtained from the student evaluation of course (SEC) survey and the student evaluation of teaching (SET) survey from Summer Semester 2014/2015 and Summer Semester 2015/2016. The same experienced instructor delivered the course across both semesters to both cohorts of students.4 The SEC and SET surveys are completed by students toward the end of the teaching period, prior to the final assessment. The surveys are anonymous, and their timing is structured such that the impact of perceived performance is minimized. All enrolled students were invited to complete the surveys. The response rates across all courses in the university are typically less than 50% (see Nulty Citation2007 for a discussion of this issue).5
Second, for our analysis of academic performance, we collected student results for all assessment items along with age, gender, year level of study, and degree program information for students enrolled in the dual mode course. We drop any observations for which the student did not complete at least one assessment item, or their demographic information was unavailable.6 Specifically, it is important to determine if there are significant differences in the composition of students enrolled in the F2F and online versions of the course. Upon investigation we found that approximately 65% of the students enrolled F2F are female compared to 40% for the online cohort. The average age for F2F students is 25 years old whereas the average age for online students is 24.5 years old. In both cohorts, more than 50% of students are enrolled in a commerce or business degree. Apart from gender, the overall composition of students in the F2F and online courses is sufficiently similar and will provide a suitable basis for comparison between the cohorts. In addition, the use of the propensity score matching (PSM) technique outlined in Section 3.3 will allow for an unbiased comparison between the F2F and online cohorts, taking into account their available demographic information.
3.2 Learning Satisfaction
We begin by analyzing the difference in the student learning satisfaction. Students were asked a series of questions in the SEC and SET surveys. These questions are outlined in and for the SEC and SET, respectively. Students gave a rating between 1 and 5, where 1 is strongly disagree and 5 is strongly agree. We pooled the data for both years and conduct t-tests comparing differences in means, assuming unequal variances. To test the robustness of the t-tests results, we also conduct a Wilcoxon rank sum nonparametric test. The Wilcoxon rank sum test is useful to address situations where normality requirements necessary to perform t-tests are not satisfied. The rank sum test is also appropriate as data obtained for this analysis are essentially ordinal in nature. and report the findings of the comparative analysis in terms of student satisfaction of the course and the teaching, respectively.
Table 2 Student evaluation of course (SEC).
Table 3 Student evaluation of teaching (SET).
With the exception of question 7 in , both the t-test and the Wilcoxon rank sum test show no significant difference amongst F2F and online students in their course satisfaction across the various aspects of the course.7 The difference we observe in question 7 suggests satisfaction that is substantially higher in magnitude amongst the F2F students with regard to the blend of the F2F and online teaching to enhance learning. We attribute this to the ability for F2F students to access recordings of the online workshops through Blackboard Collaborate, allowing for additional instructor lead revision of content at their convenience. Such resources would not be available if the students were to undertake the course in a pure F2F on-campus environment. Additionally, suggests both F2F and online students were equally satisfied with the instructor in all aspects of the teaching.
Overall, and highlight the result of no significant difference in the means for both the t-test and Wilcoxon rank sum test. Moreover, we conduct a robustness check to further draw inference regarding the equivalence of the distributions. Using a two one-sided test (TOST) procedure we test whether the means of the two cohorts are equivalent when allowing for a small margin of acceptable difference (see, e.g., Wellek Citation2010). We utilize a two-group unpaired mean-comparison test with unequal variances for the F2F and online student cohorts. The results of the TOST using a Wilcoxon rank sum TOST are reported in (Appendix C).
Equivalence testing requires both the upper and lower tail of the test to be rejected to infer equivalence between the two groups. Our results show equivalence across the two cohorts in the outcomes for five of the nine questions in the SEC. Question 7 supports the results found in , suggesting a relevant difference between the cohorts. The remaining questions have indeterminate results, suggesting we cannot either state equivalence between the cohorts, or implying that they are different. shows similar results, having indeterminate results in some of the SET questions, but attaining equivalence in other questions.
3.3 Academic Performance
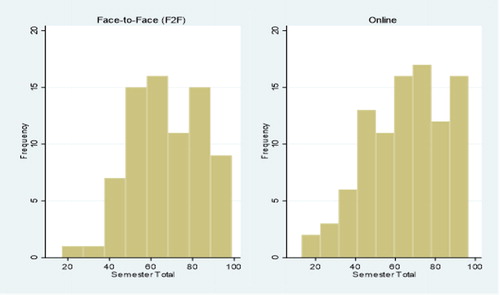
Our analysis begins by testing for differences in academic performance. reports the t-test of mean differences, assuming unequal variances for each assessment item individually and the total score of the students. Histogram of the semester total marks for F2F and online students is available in Appendix B. The results show that F2F students achieve marginally higher average results than online students. However, the difference in the average results for each assessment item is not significant at the 5% level. As a robustness check, we also conduct an equivalence test using a two one-sided test (TOST) t-test procedure (see for example Lakens, Citation2017). We utilize a two-group unpaired mean-comparison test with unequal variances for the F2F and online student cohorts. The results of the TOST are reported in (Appendix C). Based on our hypothesis of a difference between F2F and online students, we would expect that both the upper and lower tail of the test is rejected to determine equivalence. The results show we reject the null hypothesis of a difference in outcomes for all four measures, suggesting that the two cohorts are equivalent across the academic performance indicators.
Table 4 Tests for academic performance.
Although we found no significant effect when testing the differences in means, the choice to undertake studies online may be driven by the students’ underlying demographic characteristics. This may contribute some degree of bias to the results reported in as those students enrolling in online courses may be fundamentally different from those selecting F2F courses. The application of propensity score matching (PSM) will allow us to adjust for selection bias caused by students self-selecting into online studies, further validating the results. To ensure the results we obtained were not coincidental, we estimate the average treatment effect on the treated (ATT), where we assume that those undergoing online studies are the “treated” group. By estimating the ATT we can compare the results of those who participated in the online course versus those students enrolled in the traditional F2F mode. The ATT reports the difference in academic performance for an online student by creating a counterfactual assuming they were to have enrolled as a F2F student. This effectively draws out the impact of studying online for those students who opt to enroll online.
reports the results for ordinary least squares (OLS) and ATT for each assessment item. We specify three models; the pooled data and two separate year specifications. The table reports the coefficient for studying online for the various assessment items. The results for ATT suggest the online student cohort were neither better off nor worse off than if they were enrolled F2F. Overall, confirms that we find no significant difference between the academic performances of students. We find no difference across any of the assessment items in the course when taking into account the available demographic factors that may drive a student’s enrollment choice. We attribute this to the course design outlined in Section 2 which focuses on the replication of the F2F classroom in the virtual space.
Table 5 Estimations of Academic Performance, OLS vs PSM.
4 Conclusions
The adaption of dual mode systems enables education providers to deliver their courses concurrently for on-campus F2F students and off-campus online students. Pedagogical emphasis has shifted toward designing dual mode courses with consistent teaching strategies for both student cohorts. We evaluated the design of our recent delivery of dual mode introductory statistics course. Our delivery, incorporating an optimal utilization of the Blackboard Collaborate platform, was found effective in providing both our F2F and online students with a learning experience where there was no significant difference.
We hypothesized that the relatively equitable learning experience and the use of the same assessment items would translate into no significant difference in the academic performance across the two student cohorts. First, we incorporated the use of the PSM estimators to address the issue of selection bias in enrollment choice when evaluating the hypothesis. Second, our results showed that there were no significant differences in the academic performance amongst the two groups.
Overall we found no significant difference in student experiences and outcomes, achieved through consistent course delivery and teaching strategies. This provides new insights to the body of literature and contributes to the pedagogical development of dual mode courses. This year the Griffith Business School introduced a further refinement of its dual mode courses. This included the use of high quality mini studio recordings to further achieve equitable learning experience for our F2F and online students. A further research evaluating this innovation would be useful.
ORCID
Tommy Soesmanto http://orcid.org/0000-0001-5760-0304
Notes
Notes
1 Lu and Lemonde (2012) found that online teaching is as effective as a traditional F2F approach in producing comparable student test performance, but only if the student is academically higher performing.
2 Content covered in weeks 1–3 include graphical and descriptive statistics. Weeks 4 and 5 cover discrete and continuous probability distributions. Weeks 6–9 cover inferential statistics including confidence intervals, hypothesis testing, correlation and regression. The program is concluded in week 10 with the application of index numbers.
3 Approximately 70% of the F2F students come to their lecture and workshop sessions. Approximately 30% of the online students come to the live online workshop sessions. Approximately 60% of the online students watch the recordings of the lectures and live online workshops.
4 Summer semester 2016/2017 was excluded from the analysis due to a change in instructor. To ensure consistency in the analysis, it is appropriate that one instructor runs both the F2F and online modes across the full duration of the study.
5 The number of observations for the SECs and SETs voluntary learning satisfaction surveys will therefore be less than that of the academic performance.
6 Demographic information was not available for four observations from the total of 171 students analyzed.
7 F2F students are also found to have a better course experience with regard to question 5. This conclusion, however, only applies in the t-test, not in the Wilcoxon rank sum test.
References
- Allen, I. E., and Seaman, J. (2008), Staying the Course: Online Education in the United States, 2008, Nedham, MA: Sloan Consortium.
- Basturk, R. (2005), “The Effectiveness of Computer-Assisted Instruction in Teaching Introductory Statistics,” Educational Technology & Society, 8, 170–178.
- Browning, J. (1999), “Analysis of Concepts and Skills Acquisition Differences Between Web-delivered and Classroom-delivered Undergraduate Instructional Technology Courses,” North Carolina State University, ProQuest Dissertations Publishing.
- Campbell, H., and Gustafson, P. (2018), “Conditional Equivalence testing: An Alternative Remedy for Publication Bias,” PloS One, 13.
- Dutton, J., and Dutton, M. (2005), “Characteristics and Performance of Students in an Online Section of Business Statistics,” Journal of Statistics Education, 13. Available at https://amstat.tandfonline.com/doi/abs/10.1080/10691898.2005.11910564#.XN4WdFIzbRZ
- Evans, S. R., Wang, R., Yeh, T., Anderson, J., Haija, R., McBratney-Owen, P., Peeples, L., Sinha, S., Xanthakis, V., Rajicic, N., and Zhang, J. (2007), “Evaluation of Distance Learning in an Introduction to Biostatistics Class: A Case Study,” Statistics Education Research Journal, 6, 59–77.
- Fullwood, C., and Doherty-Sneddon, G. (2006), “Effect of Gazing at the Camera During a Video Link on Recall,” Applied Ergonomics, 37, 167–175. DOI:10.1016/j.apergo.2005.05.003.
- Gal, I., and Garfield, J. B. (1997), The Assessment Challenge in Statistics Education (Vol. 12), Amsterdam: IOS Press and International Statistical Institute. DOI:10.1111/j.1751-5823.1999.tb00377.x.
- Garfield, J. B. (1994), “Beyond Testing and Grading: Using Assessment to Improve Student Learning,” Journal of Statistics Education, 2, 1–11.
- Gordon, S., and Nicholas, J. (2009), “Using Examples to Promote Statistical Literacy,” in 2009 UniServe Science Proceedings, pp. 58–64.
- Gunnarsson, C. L. (2001), “Student Attitude and Achievement in an Online Graduate Statistics Course,” University of Cincinnati, ProQuest Digital Dissertations.
- Hurlburt, R. T. (2001), “Lectlets” Deliver Content at a Distance: Introductory Statistics as a Case Study,” Teaching of Psychology, 28, 15–20. DOI:10.1207/S15328023TOP2801_04.
- Jones, E. R. (1999), “A Comparison of an all Web-based Class to a Traditional Class,” the Society for Information Technology & Teacher Education International Conference, San Antonio, TX.
- Katz, Y. J., and Yablon, Y. B. (2003), “Locus of Control, Self-esteem, Motivation and Satisfaction, Teaching and Learning through an Internet-based and Traditional “Introduction to Statistics” Course,” in Proceedings of European Distance Education Network, Rhodes: EDEN., 183–197.
- Ke, F., and Xie, K. (2009), “Toward Deep Learning for Adult Students in Online Courses,” Internet and Higher Education, 12, 136–145. DOI:10.1016/j.iheduc.2009.08.001.
- Lakens, D. (2017), “Equivalence Tests: A Practical Primer for t tests, Correlations, and Meta-analyses,” Social Psychological and Personality Science, 8, 355–362. DOI:10.1177/1948550617697177.
- Lu, F., and Lemonde, M. (2012), “A Comparison of Online versus Face-to-face Teaching Delivery in Statistics Instruction for Undergraduate Health Science Students,” Advances in Health Science Education, 18, 963–973. DOI:10.1007/s10459-012-9435-3.
- Mara, C. A., and Cribbie, R. A. (2012), “Paired-Samples Tests of Equivalence,” Communications in Statistics-Simulation and Computation, 41, 1928–1943. DOI:10.1080/03610918.2011.626545.
- Mathieson, K. (2010), “Comparing Outcomes Between Online and Face-to-face Statistics Courses: A Systematic Review,” contributed refereed paper in C. Reading (Ed.), Data and Context in Statistics education: Towards an Evidence-based Society, in 8th International Conference on Teaching Statistics, Ljubljana, Slovenia.
- Mayer, R. E., and Gallini, J. K. (1990), “When is an Illustration worth Ten Thousand Words?” Journal of Educational Psychology, 82, 715. DOI:10.1037/0022-0663.82.4.715.
- McBrien, J. L., Cheng, R., and Jones, P. (2009), “Virtual Spaces: Employing a Synchronous Online Classroom to Facilitate Student Engagement in Online Learning,” The International Review of Research in Open and Distributed Learning, 10. Available at https://doi.org/10.19173/irrodl.v10i3.605
- McGready, J. (2006), “Basic Biostats: Online Learning versus Onsite Learning,” paper presented at the Joint Statistical Meetings, Seattle, WA.
- McLaren, C. H. (2004), “A Comparison of Student Persistence and Performance in Online and Classroom Business Statistics Experiences,” Decision Sciences Journal of Innovative Education, 2, Spring 2004, 1–10. DOI:10.1111/j.0011-7315.2004.00015.x.
- Moore, D. S. (1997), “New Pedagogy and New Content: The Case of Statistics,” International Statistical Review, 65, 123–137. DOI:10.1111/j.1751-5823.1997.tb00390.x.
- Nulty, D. (2007), “The Adequacy of Response Rates to Online and Paper Surveys: What Can be Done?” Assessment and Evaluation in Higher Education, 33, 1–13.
- Paulsen, K., Higgins, K., Miller, S., Strawser, S., and Boone, R. (1998), “Delivering Instruction via Interactive Television and Videotape: Student Achievement and Satisfaction,” Journal of Special Education Technology, 13, 59–77. DOI:10.1177/016264349801300401.
- Rumsey, D. J. (2002), “Statistical Literacy as a Goal for Introductory Statistics Courses,” Journal of Statistics Education, 10, 6–13.
- Schutte, J. G. (1998), “Virtual Teaching in Higher Education: The New Intellectual Superhighway or just Another Traffic Jam?” unpublished manuscript, Department of Sociology, California State University, Northridge.
- Scouller, K. (1998), “The Influence of Assessment Method on Students’ Learning Approaches: Multiple Choice Question Examination versus Assignment Essay,” Higher Education, 35, 453–472.
- Suanpang, P., and Petocz, P. (2006), “E-learning in Thailand: An Analysis and Case Study,” International Journal of E-Learning, 5, 415–438.
- Summers, J. J., Waigandt, A., and Whittaker, T. A. (2005), “A Comparison of Student Achievement and Satisfaction in an Online versus a Traditional Face-to-face Statistics Class,” Innovative Higher Education, 29, 233–250. DOI:10.1007/s10755-005-1938-x.
- Thomas, P. R., and Bain, J. D. (1982), “Consistency in Learning Strategies,” Higher Education, 11, 249–259. DOI:10.1007/BF00155616.
- Vioreanu, D. [cited August 14, (2018)], “Distance Learning Course Options Get More Popular Every Year,” Distance Learning Portal, available at https://www.distancelearningportal.com/articles/393/distance-learning-course-options-get-more-popular-every-year.html.
- Wang, A. Y., and Newlin, M. H. (2000), “Characteristics of Students who enroll and succeed in Psychology Web-based Classes,” Journal of Educational Psychology, 92, 137–143. DOI:10.1037/0022-0663.92.1.137.
- Wellek, S. (2010), Testing Statistical Hypotheses of Equivalence and Noninferiority (2nd ed.), New York: Chapman and Hall/CRC.
- Yablon, Y. B., and Katz, Y. J. (2001), “Statistics through the Medium of the Internet: What Students Think and Achieve,” Academic Exchange Quarterly, 5, 17–22.
Appendix A
Fig. A1 An example of online workshops using Blackboard Collaborate.
Appendix B
Fig. B1 Histogram of semester total marks (F2F vs online).
Appendix C
Table C1 Two one sided test equivalence using the Wilcoxon rank sum method for the student evaluation of course (SEC).
Table C2 Two one sided test equivalence using the Wilcoxon rank sum method for the student evaluation of teaching (SET).
Table C3 Two one sided t-test of equivalence for academic performance.