
 ?Mathematical formulae have been encoded as MathML and are displayed in this HTML version using MathJax in order to improve their display. Uncheck the box to turn MathJax off. This feature requires Javascript. Click on a formula to zoom.
Abstract
The purpose of this study was to study the impact of conformity to statistical reasoning learning environment (SRLE) principles on students’ statistical reasoning in advanced placement statistics courses. A quasi-experimental design was used to compare teachers’ levels of conformity to SRLE principles through a matching process used to mitigate the effects of nonrandom assignment. This matching process resulted in five pairs of similar teachers and schools who differed in self-reported beliefs in the effectiveness and application of SRLE principles. Increases in students’ statistical reasoning were found at varying levels in both high and low conformity classrooms. Improvements among teachers with low conformity to SRLE principles were less varied and consistent with national averages for improvement by college students. Improvements in classes with high conformity to SRLE principles were more varied. Students of two teachers with high levels of conformity to SRLE principles showed large levels of improvement in statistical reasoning in comparison to national results. While the comparison between classrooms conformity to SRLE principles revealed no statistically significant differences in students’ statistical reasoning ability, deeper analysis suggests that beliefs and practices aligned with SRLE principles have potential to increase students’ statistical reasoning at rates above national averages.
1 Introduction
Garfield (Citation2002) stated that statistical thinking and reasoning should be the desired outcomes for a course; however, “no one has yet demonstrated that a particular set of teaching techniques or methods will lead to the desired outcomes” (p. 10). Since Garfield’s discussion (2002), the limited number of studies that have attempted to measure outcomes in statistics education based on teaching methods have had mixed outcomes according to Loveland (Citation2014).
Based on this fact and the need to understand how students reasoning ability in statistics is developed holistically, peer reviewed research articles that dealt with teaching practice and outcomes related to reasoning were reviewed. In addition, teaching principles and standards were reviewed to determine what composes effective teaching in statistics. The following two subsections highlight some of the recent work in these two areas as they relate to statistics education.
1.1 Research on Improving Statistical Reasoning
Slauson (Citation2008) investigated the difference between student learning of variation from a standard lecture-based format and a format emphasizing experimentation in two different sections of an introductory statistics course at the tertiary level. To measure outcomes of the experiment, Slauson (Citation2008) used a pre and post multiple-choice assessment that focused on statistical reasoning. Results were also gathered through student interview questions related to variation. In analyzing results from the reasoning assessment, Slauson (Citation2008) found improvement in students’ statistical reasoning about standard deviation in the hands-on experiment group but not in the lecture-based group. There was no statistically significant improvement found in students’ reasoning about sampling distributions (Slauson Citation2008). The effect size, however, was minimal with approximately only one more question being answered correctly (Slauson Citation2008). For this reason, there were no statistically significant differences found between differences in pretest and posttest for the hands-on experiment learning and lecture-based classes.
Loveland (Citation2014) subdivided one section of an introductory statistics course at the university level into two sections taught by the same teacher. One section was taught with entirely lecture-based teaching methods and the other with largely active learning methods that included group work, hands on activities to gather data, and teacher facilitation with minimal amount of lecture. Loveland (Citation2014) investigated whether students’ developed more conceptually, procedurally, or both using active learning environments. After completing the courses, Loveland (Citation2014) found no difference between students’ ability to comprehend statistics or complete statistical procedures in the traditional lecture based and active learning based course. Loveland (Citation2014) used stepwise selection to determine the most significant effects in her study. This procedure found that previous GPA, pretest points, and attendance were the most contributive predictors of student achievement whether classes were lecture based or activity based being insignificant.
Given this phenomenon, Baglin (Citation2013) and Loveland (2014) both looked at promoting reasoning and thinking holistically, but in one class being taught by the same instructor in two different ways. Based on this gap in the research literature, this study began by looking for answers to the broad question, “What instructional practices promote statistical reasoning most effectively?” Thus, this study exists to help explore the impact of effective teaching practices to the development of statistical reasoning. Though teaching methods promote reasoning, other factors such as technology, curriculum, and assessment have the ability to promote statistical reasoning as well. For this reason, attention to teaching, technology, curriculum, and assessment are also potentially important components to consider in answering this broad question.
1.2 Effective Teaching Practices
In order for students to learn statistics at deeper levels, they must learn statistics in ways that develop conceptual understanding of important statistical ideas at all levels of education (Mokros and Russell Citation1995; Feldman et al. Citation2000; Pesek and Kirshner 2000/2002). National Council of Teachers of Mathematics (NCTM) (2014) stated that effective teaching and learning is composed of eight major practices related to learning mathematics and statistics: Establish mathematics goals to focus learning, implement tasks that promote reasoning and problem solving, use and connection mathematical representations, facilitate meaningful mathematical discourse, pose purposeful questions, build procedural fluency from conceptual understanding, support productive struggle in learning mathematics, and elicit and use evidence of student thinking (NCTM 2014).
Teaching that promotes statistical reasoning also incorporates the use of curriculum, technology, and assessment that is aligned with learning goals to promote in-depth learning (Garfield and Ben-Zvi Citation2008, Citation2009; NCTM 2000, 2014). Curricula should provide progressions that allow students to build upon and develop their own knowledge through high-level tasks (NCTM 2014). Teachers should use technology to build students’ conceptual understanding of statistics and not just as a means for computing statistics or presenting presentations (Chance and Rossman Citation2006). Teachers should use assessments as an instructional tool. This provides a way for students to gain understanding while at the same time allows the teacher to gage student understanding (NCTM 1995; Chance Citation1997; Petit, Zawojewski, and Lobato Citation2010). Teachers who align their curriculum to in-depth learning goals, use technology to build conceptual understanding, and use assessment as a learning tool are more likely to promote statistical reasoning and thinking.
1.3 Statistical Reasoning Learning Environments
Statistical reasoning is and should be a clear goal of statistical instruction. This type of learning requires much more effort to develop and assess. The use of effective teaching practices that incorporate technology, curriculum, and assessment as learning tools can increase students’ statistical reasoning and thinking. Garfield and Ben-Zvi (Citation2008, Citation2009) have described this integration of teaching, technology, curriculum, and assessment that in the statistics education literature as the Statistical Reasoning Learning Environment (SRLE).
Garfield and Ben-Zvi’s (Citation2008, Citation2009) description of the SRLE is a socio-constructivist approach to instruction. The SRLE falls in close alignment with NCTM teaching principles (2000) and teaching practices (2014) that foster student engagement and classroom discourse between students and the teacher, NCTM professional teaching standards to promote discourse (1991), and other educational research on promoting discourse (Shaughnessy, Chance, and Kranendonk Citation2009; Middleton and Jansen Citation2011; Smith and Stein Citation2011). The SRLE also includes components of assessment that include students in the assessment process and use assessment to advance student reasoning and thinking. The SRLE has six principles of instructional design that are aligned with Cobb and McClain (as cited by Garfield and Ben-Zvi (Citation2009)).
Focus on developing central statistical ideas rather than on presenting set of tools and procedures.
Promote classroom discourse that includes statistical arguments and sustained exchanges that focus on significant statistical ideas.
Use assessment to learn what students know and to monitor the development of their statistical learning as well as to evaluate instructional plans and progress.
Integrate the use of appropriate technological tools that allow students to test their conjectures, explore and analyze data, and develop their statistical reasoning.
Use real and motivating datasets to engage students in making and testing conjectures.
Use classroom activities to support the development of students’ reasoning.
Garfield and Ben-Zvi’s (Citation2008, Citation2009) six elements provided a framework in which to monitor effective teaching practices in statistics. Previous study designs did little to attempt to integrate each of these elements into their methods for monitoring teacher effect on students’ development of statistical reasoning. Given the previous research on socio-constructivist learning environments and their effects, a study looking at the six principles of the SRLE concurrently is needed. In addition, a careful design that includes each of the SRLE components may also change the findings in which effects were previously not found. The literature review thus imposes key research questions in which to explore.
1.4 Research Question
With limited empirical evidence to what extent the SRLE in its entirety does in fact improve students’ statistical reasoning (Baglin Citation2013; Loveland Citation2014), a number of questions still exist. The following research however explored the extent to which students’ ability to reason and think about statistics differ between classes that do and do not conform to a SRLE. In addition to this research question, a carefully designed study that measures teachers’ beliefs and practices congruent with the SRLE, controls for teacher and student differences is needed. Thus, a carefully designed study is paramount to truly answering this question in a way that can be generalized to a larger population.
2 Methodology
2.1 Design
Creswell (Citation2013) as well as Bernard and Ryan (Citation2010) stated that the goals of research should influence the approaches a researcher should take. The goal of this study was to monitor the impact of principles from the SRLE on the development of students’ statistical reasoning. For this reason, a quasi-experimental design using comparative groups was used. This study used a quasi-experimental design because it had no control over the allocation of treatment to participants and did not use a randomized sampling procedure (Reichardt and Mark Citation2004).
To adjust for likely dependent relationships that may occur in a quasi-experimental design, matching was used to reduce confounding factors and bias within the study that potentially occurs through lack of random sampling and assignment (Reichardt and Mark Citation2004; Stuart and Rubin Citation2008). Teachers were matched on their teaching experience, prior course work in statistics, professional development, and their school’s percent of students receiving free and reduced lunch and differences of conformity to SRLE principles. Teachers who were in transition between beliefs and practices or had dissimilarity between beliefs and practices were omitted from the analysis to help ensure SRLE were enacted. Likewise, teachers who did not match on demographics while having contrasting beliefs and practices relative to the SRLE were discarded from the analysis.
2.2 Instrumentation
This study used two different measurement tools, the Statistics Teaching Inventory (STI) and the Comprehensive Assessment of Outcomes (CAOS). The STI measured teachers’ self-reported agreement with beliefs and practices related to the SRLE through an online survey. This survey was also used to identify teacher characteristics for matching purposes. The CAOS assessed students’ reasoning and thinking skills through a multiple-choice test that was administered by paper.
2.2.1 Statistics Teaching Inventory
To assess teachers’ level of agreement in belief and practice with the SRLE, the researcher asked teachers to complete a modified version of the STI survey (Zieffler et al. Citation2012). Zieffler et al. (Citation2012) showed both qualitative and quantitative evidence suggesting both the validity and reliability of the original instrument to measure principles aligned with the SRLE. This modified version of the STI completed by the original authors removed some obvious issues that were found after publication of their results. Based on reliability evidence, Likert item scales were decreased in one area of part one and increased in another area. The moving of these scales and not changing wording ensured validity and increased reliability. When measuring assessment, part three of the survey, the original survey monitored practices with simple agree or disagree remarks. Teachers in the updated version were required to respond on the percentage of the students’ grade that was dedicated to the original questions. This allowed the researcher to better understand the teachers’ emphasis in the course and further discriminate between teachers’ belief and practices related to assessment. The last portion of the improved version of the survey, part four of the original survey, was adjusted to make the Likert scale sequential by moving the undecided decision to the middle. This is seen as a common practice of increasing validity and reliability by assessment writers.
Based on the slight modifications to the original survey that was acquired from Joan Garfield, one of the original authors, the new version was expected to be an even better instrument than the initial version of the STI proposed by Zieffler et al. (Citation2012). The researcher, for purposes of this study, also included additional demographic questions particular for quasi-experimentation matching procedures in the STI. The modified version of the STI used in this study was administered through the online system (Qualtrics Citation2013) and is located in the Appendix.
2.2.2 Comprehensive Assessment of Student Outcomes in Statistics
The CAOS was used to assess students’ reasoning and thinking skills. The CAOS is a test designed by DelMas et al. (Citation2007) through a National Science Foundation grant entitled Assessment Resource Tools for Improving Statistical Thinking (ARTIST). Questions on the CAOS required students to think through and reason with statistics rather than compute formulas, recall definitions, or use formulas (DelMas et al. Citation2007).
This study used the CAOS as a pretest and posttest to assess students’ statistical reasoning ability. The teachers of the course administered the pretest after approximately a quarter of the course was completed. Teachers of the course administered the posttest after the course was completed. Disaggregated student data with broad statistical categorization of percent of correct responses was provided to instructors to encourage focus on specific topics within the course after the pretest and for advanced placement (AP) testing after the posttest. These same data were provided to teachers at the end of course for program development. Solutions to the CAOS were not provided to teachers in the study before or after the study.
2.3 Procedure
The overall procedure for this study required the collection of both teacher and student data from a project supporting the development and success of AP statistics courses. The researcher collected teacher data from the STI at the beginning of the school year and used the data to classify teachers’ beliefs and practices relative to SRLE principles. The researcher also used demographic information included on the STI to match pairs of teachers who had high conformity to SRLE principles with teachers who had low conformity to SRLE principles. Teachers were matched if they had the same amount of teaching experience, similar coursework in theoretical and applied statistics, similar professional development, and similar school socio-economic status. Questions used to monitor these attributes may be found in the Appendix. in Section 3.2 shows in more detail potential teacher matches and matches used in this quasi-experimental procedure. Teachers who were matched then administered the CAOS as a pretest and posttest in their course to measure the amount of improvement in statistical reasoning. Students completed pretests after approximately a quarter of the course and posttests at the end of the course.
Table 1 Possible matches grouped by years of experience.
2.4 Population
Participants were drawn from the A + College Ready project being conducted in the southeast region of the United States; see http://www.apluscollegeready.org. This project focused on the development of AP science, English, and mathematics courses. The A + project aimed to increase the numbers of students taking AP courses and making qualifying exam scores of 3, 4, and 5 on the end of course examinations. AP statistics teachers who were a part of the project were asked to be a part of this study, then, after matching procedures, their students were asked to participate.
2.5 Data Analysis
To answer the research questions, a one-way analysis of covariance (ANCOVA) design was used to determine if differences between instructional practice and beliefs groupings of classrooms posttests differed while controlling for students’ pretest scores as covariates. Cook and Campbell (Citation1979) stated that this design for quasi-experimentation is a more powerful procedure for detecting differences than traditional pre and posttest difference designs. The purpose of using the pretest scores as a covariate in ANCOVA with a pre and posttest design is to reduce the error variance and eliminate systematic bias that may occur in nonrandomized designs. The ANCOVA thus adjust the posttest means for differences among groups on the pretest, because such differences are likely to occur among groups. Given the variation between and among groupings in the quasi-experiment, Type III sum of squares was used in SPSS to control for differences in sample sizes of students in analyses.
To complete an ANCOVA design, Mertler and Vannatta (Citation2010) list several assumptions that must be verified. The first assumption is of random sampling and reliable covariates. Observations within this study were quasi-experimental, thus lacked true randomization; however, the matching procedure attempted to mitigate this difficulty present in most educational research. In addition, a previously developed and validated assessment instrument was used as a covariate. The second assumption listed by Mertler and Vannatta (Citation2010), stated that to perform an ANCOVA, the dependent variable should be approximately normal.
Mertler and Vannatta (Citation2010) also recommended several tests for homogeneity of variances between groups on the posttest. Homogeneity of variances in this study ensures that the variation between each groups’ posttest scores were approximately equal. A Levene’s test was used in this study to ensure the assumption between groups was not violated. The covariate of pretest scores given at similar times in the course was expected to be linearly related to the dependent variable of posttest scores making it a reliable linear predictor. This assumption was still verified through scatterplots and calculations of correlation coefficients before each testing procedure.
A critical assumption, as described by Mertler and Vannatta (Citation2010), is the assumption of homogeneous regression slopes during the analysis. Inequality in regression slopes would imply that the relationship of students’ pretest scores and posttest scores were different in different classrooms. Homogeneity of slopes is simply stating that students in one teacher’s classrooms have a similar increase in scoring rates from the pretest to posttest within each other teachers’ class. This assumption was tested by conducting an F test for interactions. If no interactions existed, a full factorial model was specified and used for analysis.
The first ANCOVA procedure determined if significant differences were found between student posttest results among teachers that were categorized as high conformity to SRLE principles while controlling for students’ pretest scores. The second ANCOVA procedure determined if significant differences existed between student posttest scores among teachers who had less conformity to SRLE principles while controlling for students’ pretest scores. The third ANCOVA procedure determined if there was a significant difference between posttest scores of teachers with high conformity and low conformity to the SRLE while controlling for pretest scores.
3 Results
The results in this section detail the selection of participants in this study based on the STI and the previously described matching procedures using demographic information in Sections 3.1 and 3.2. Section 3.3 highlights the response rates of the CAOS by students in each class after matches had been performed. The final subsection analyzes posttest CAOS scores after adjustment for pretest CAOS scores between matched teachers of high and low levels of conformity to SRLE principles (Section 3.4). This section also details results found through exploratory analysis.
3.1 Responses to the Statistics Teaching Inventory
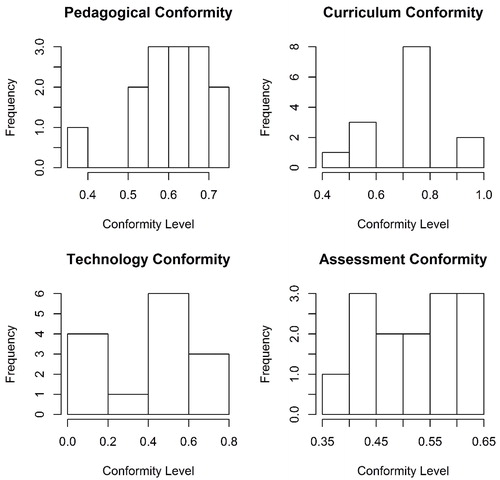
Twenty teachers of statistics provided responses to the STI from an e-mail list of 52 teachers during a two-week collection period (38.4% response rate). Five of these responses were incomplete and excluded from further analysis. Responses from the STI survey were transformed to values between 0 and 1 with higher values representing higher conformity to SRLE principles. summarizes the average conformity levels for each possible participant in the STI categories of pedagogy, curriculum, technology, and assessment in histograms. These four parts were averaged to create a self-assessment average that anticipated how well teachers believed their classes actually conformed to SRLE principle. Eleven questions from the beliefs portion of the STI (Part V) were averaged to create a belief scale in the effectiveness of SRLE principles.
Fig. 1 Histograms of self-reported teaching practices for possible participants by subscale.
A scatterplot (see ) was constructed for the averages of survey participants’ self-assessment results versus beliefs to help identify teachers with similar beliefs and practice. Because this research project had the goal of evaluating the effect of SRLE principles on student statistical reasoning, participants who were inconsistent in their beliefs and practices were removed from possible matching. Thus, the participant scoring a belief level of 0.83 and a practice level of 0.34 was excluded from possible matching and analysis, leaving 14 possible participants for the full study. The Pearson’s correlation coefficient for possible participants was 0.81 between the scores for beliefs and practices implying that most teachers practice aligned with their belief in what was effective.
Fig. 2 Scatterplot of possible participants’ beliefs and practices subscales from the STI.
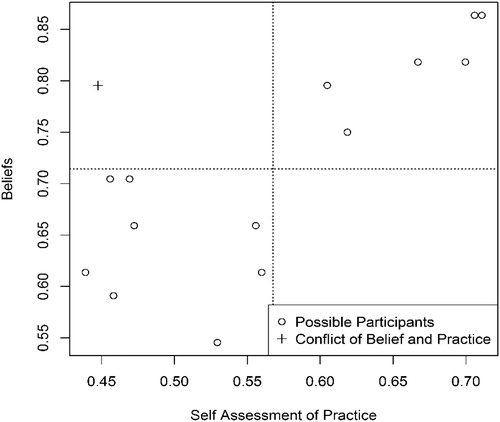
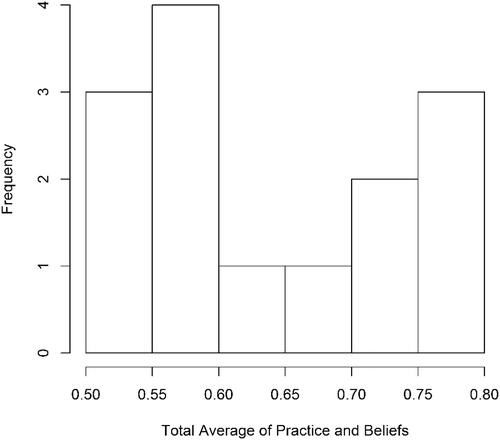
Teachers were categorized as high conformity when their responses were higher than the typical average response in belief and practice, the upper right quadrant of . Teachers were categorized as low conformity to the SRLE principles when their responses were lower than the average in beliefs and practices, the lower left quadrant of . Of 14 possible teachers for matching, eight were categorized as low conformity and six were categorized with higher conformity levels. To produce an overall level of conformity with SRLE, participants’ beliefs in SRLE principles were averaged with perceived use of SRLE principles in the classroom. Averaging these two values was decided by the research team to produce a single value that would likely represent the participants level of use of the SRLE (see ).
Fig. 3 Histogram of average across all SRLE constructs contained in survey.
3.2 Identification of Matched Pairs of Participants
After identifying possible participants for the study and their conformity grouping through the STI, teachers were ordered based on their conformity level and numbered for purposes of anonymity. Teachers were then grouped by zero, one, two, and greater than two years of experience teaching an introductory statistics course (Appendix). Based on the groupings it was determined how many potential matches existed between lower conformity and higher conformity classrooms. The best match was determined in each grouping by first observing coursework in statistics, then professional development in statistics education. Given a matching existed, school demographics were compared for each matching.
This may be observed in by each teacher being allocated to a years of experience teaching statistics category. Based on the grouping, there existed a maximum of 6 potential matches; one with zero years of experience, one with one-year experience, two with two years of experience, and two with greater than two years experience. Within , the research then matched opposite ends of conformity level to similar amounts of coursework and professional development in statistics. This then reduced the potential number of matches by one in the greater than two years experience category because there was only one participant with an opposite belief and practice related to the SRLE. Lastly, the percent of free and reduced lunch was used as a final comparative match. Results used for matching are in .
This process resulted in the identification of five sets of teachers with the same reported teaching experience in teaching introductory statistics, similar coursework in statistics, and similar school demographics. summarizes the pairing of teachers in this experiment. Note, however, the mismatch of Teachers 13 and 4 in the number of students receiving free and reduced lunch, a strong indicator of student socio-economic status. Though this pairing differed at the third level, these teachers were paired because the factor would be more detrimental to the success of the SRLE and SES was not expected to be major factor in effecting students reasoning ability in statistics.
Table 2 Comparison of matched teachers at all levels.
3.3 Student CAOS Responses
After matching teachers and the collection of opt-out letters from parents, teachers were directed to administer the CAOS as a pretest. These completed assessments were then mailed back to the researcher for analysis. Similarly, teachers administered the CAOS as a posttest at the end of the course and returned by mail. Student absences on the assessment dates reduced the number of students participating in both the pre and posttest design. Incorrect coding of anonymous identifiers by participants also reduced the total number of participants who had pre and posttest scores that could be matched. Based on this protocol, exact response rates from students could not be calculated. An underestimate of response rates for students in a teacher’s entire statistics classroom were calculated by using the number of matched pre and posttests to the total available from each teachers’ classes in .
Table 3 Student response rates.
Observations with missing data were excluded from analysis, thus only observations that had matching pretest and posttest results were used to answer research questions. identifies the total number of students taking part in each teachers’ pre and posttest and the number of matched samples used in the statistical analysis. Prescreening of the data did not identify any univariate outliers. Class sizes and the number of students each teacher instructed varied considerably. Class sizes for teachers with less conformity to SRLE principles were generally larger than high conformity classrooms as presented in . Similarly, the low conformity teachers tended to have more opportunities to teach the content on a given day as seen in .
Table 4 Teacher sample sizes of pretests, posttests, and matched tests.
3.4 Comparison of Statistical Reasoning Improvement Between High and Low Conformity Classrooms
The research question in this study analyzed the extent to which students’ statistical reasoning and thinking ability differed between teachers that show low and high levels of conformity to SRLE principles. An ANCOVA was used to determine if differences existed between the groupings of high and low conforming classrooms posttest scores after adjusting for pretest scores.
3.4.1 Analysis
After assumptions for completing the ANCOVA were verified, the ANCOVA procedure was completed in SPSS using Type III sum of squares to determine if differences existed in students’ statistical reasoning between high and low conformity classrooms. The ANCOVA testing procedure found that after adjustment for the significant covariate of pretests, posttest scores did not significantly vary between high and low conformity teacher groupings, F(1, 260) = 0.953, p = 0.330, η2 = 0.024 (see ). Thus, reasoning ability was not statistically different between grouping of teachers into high and low conformity sets after adjusting for pretest scores. A partial eta-squared of 0.024 was deemed a low effect size (Ferguson Citation2009).
Table 5 ANCOVA test for differences between conformity levels after controlling for pretests.
The unadjusted posttest score averages for high conformity classrooms was 20.39 and for low conformity classrooms was 20.7. The adjusted posttest score average for high conformity classrooms was 20.3 and for low conformity classrooms was 20.8. The decrease in adjusted means for high conformity classrooms may potentially be related to higher pretest scores in the grouping. Though effects of the SRLE were mixed from initial analysis of pretest results, higher pretest scores caused a reduction in adjusted student posttest means for high conformity teachers. Similarly, the increase in adjusted means for posttest scores in low conformity classrooms indicated lower than average pretest scores.
Thus, statistically significant results were not found between students’ reasoning ability after adjustment for students’ prior reasoning ability as measured by the CAOS. Though statistical differences were not found between the grouping of teachers’ students into high and low conformity groupings, the answer to research question three was not clear. This was largely due to the unequal allocation of CAOS results by each teacher. Potential weighting by total students’ participating in each teachers’ classrooms may have skewed differences that existed between matches. To understand further the effects of conformity to SRLE principles on students’ statistical reasoning, exploratory analysis was conducted to understand the variation between teachers, specifically matched teachers.
3.4.2 Exploratory Analysis
Given the differences in the number of participating students from each teacher deemed as having high conformity and low conformity to SRLE principles, individual differences between matched teachers within the study were explored. Before assuming that there was a difference between individual teachers however, an ANCOVA was performed to determine if significant differences existed between different teachers’ posttest scores while controlling for pretest scores. Before performing the ANCOVA for differences between each teachers’ classes within the study, testing conditions were checked.
Equality of variances was checked using a Levene’s test which resulted in F(9, 253) = 1.46 and a p-value of 0.163 giving no evidence to reject equality of variances between teachers. Previously checked assumptions from the ANCOVA on conformity level were sufficient to proceed with the ANCOVA procedure testing for differences between teachers in the experiment after adjusting for students’ pretest scores (see ).
Table 6 ANCOVA test for differences between teachers after controlling for pretests.
After adjusting for the significant covariate of students’ pretest scores, there was a statistically significant difference between teachers’ students statistical reasoning on the posttest, F(9, 252) = 5.436, ,
2 = 0.163. This significant difference meant that differences existed in students’ posttest scores between at least one pair of teachers in the study. A η2 of 0.163 indicated that teachers had a moderate effect for differences in students’ posttest scores. Based on confounding factors between different matches, only students’ posttest adjusted means were compared between matched teachers (see ). This exploratory analysis confirmed three sets of matched classrooms in the experiment that had differences in posttest scores that had a less than 10% probability happening by chance. Ten percent was chosen for further analysis because of the exploratory nature of the analysis and the clear division of p-values between matched participants in the study. Of these, one lower conforming teacher’s classes outperformed a higher conforming teacher’s classes (Match 1) and two higher conforming teachers’ classes outperformed their respective lower conforming teacher’s class when accounting for students’ pretest scores (Match 2 and 3). further illustrates these differences visually between all 5 matches in this study. was also created to further understand these differences in adjusted means, by comparing increases from pretest to unadjusted posttest score means between matched teachers.
Table 7 Adjusted class mean comparisons between matched teachers.
Fig. 4 Adjusted class mean visual comparison with national average.
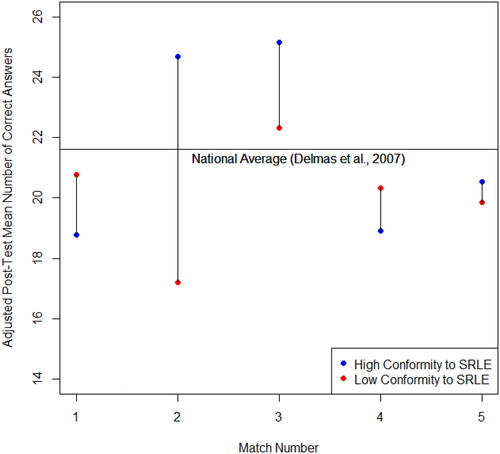
Table 8 Comparison of percent of increase between matched teachers.
Using adjusted means, students of Teachers 10 and 13 had substantial higher statistical reasoning ability on the posttest in comparison to their matched teachers and all others within the study. The average percent correct in these two teachers’ classes was over 60%. Similarly, Teachers 10 and 13 also increased on pretest to posttest scores by 19 and 21%, respectively. Both of these teachers were from the higher conformity grouping. This implies that the largest gains on posttest scores were from two teachers within the higher conformity groupings after controlling for pretest scores. The only other teacher to have improvements higher than the national average of 9.1% was Teacher 4, who had an improvement in its score of 10.6%. In addition, this teacher’s class had pretest results higher than the national average posttest.
The lowest performing high conformity teacher (Teacher 11) represented over half of the total high conformity group. Thus, potential also existed for unequal allocation between matched samples to overweight conformity levels. The matched Teachers 1 and 9 represented approximately 39.3% of the low conformity group and approximately 19.5% of the high conformity group, respectively. Because of unequal allocations of students in the high and low conformity groupings by different teachers, potential weighting of means existed in the ANCOVA testing procedure. This can be exhibited by comparing the mean of teachers’ classes in and matched CAOS results used for analysis in . These results produce mixed interpretations for the increase of statistical reasoning based on weighting of students’ posttest scores. We will now take a closer look at the three pairs of matched teachers with statistically significant pairwise differences (see ).
Match 1 consisted of Teacher 5 with 70 (33.5% of low conformity group) total student participants and Teacher 11 which had 46 (52.9% of high conformity group) total student participants. Match 1 consisted of teachers with the most experience teaching statistics in the study, six and seven years. These teachers also had similar coursework in statistics and professional development. Both teachers within this match consisted of schools who reported less than 30% free and reduced lunch.
Though Teacher 11 had the most experience teaching statistics, student performance in the class was the lowest within the high conformity grouping considering both adjusted and non-adjusted means. Teacher 5 was the second highest performing low conformity teacher given either the adjusted or the non-adjusted means. Teacher 5 increased by 7% from pretest to posttest while Teacher 11 increased by 2.5%. The difference between the two teachers’ classes was approximately two questions on the posttest given the adjusted and non-adjusted means. The probability of a difference this large or larger to occur by chance was calculated to be approximately 1.7%. Thus, differences found between these two teachers’ students were not due to chance alone. Based on the raw percent of increase being low in the high conformity teachers’ classes compared to national averages and this study’s average, this statistical difference may more likely be due to a low performance of students in the high conformity teachers’ classes rather than high performing students in the low conformity teachers’ classroom.
Match 2 consisted of two teachers with one year of experience. Teacher 3, the teacher found to have low conformity to SRLE principles, consisted of 11 (6.2% of low conformity group) students and Teacher 10 consisted of five students (5.7% of high conformity group). Teachers of the classrooms both reported similar teaching coursework in statistics while Teacher 10’s teacher reported approximately four more hours of professional development. Both schools reported between 58% and 60% free and reduced lunch.
The low conformity Teacher 3 had the lowest student performance within the study and classroom 10 was the highest performing high conformity teacher. Teacher 3’s students increased by only 4.1% from pretest to posttest results while Teacher 10’s students increased by 19%. After accounting for pretest scores, the high conformity teachers’ students correctly answered approximately 7.5 more questions, or 19% of the posttest. The probability of a difference this large or larger to occur by chance was calculated to be approximately 0.3%. Thus, differences found between these two teachers’ students were probably not due to chance alone. Though the low conformity teacher was the lowest performing teacher within the low conformity group, Teacher 10 had student improvement rates and posttest scores much higher than the national average. This difference was likely due to high performance in student reasoning in the high conformity teacher’s class rather than low performance by students in low conformity teacher’s class.
Match 3 consisted of Teacher 4 and 13. Teacher 4 had 23 (12.9% of total low conformity group) total students participate and Teacher 13 had 12 (13.8% of high conformity group) total students. Both teachers within this matching reported two years of experience teaching statistics with between 8 and 12 courses in statistics. These teachers also reported very high amounts of professional development in statistics education, 7 and 9 hr. Teacher 13 had higher amounts of coursework and reported professional development in both situations. Teacher 4 reported 0% free and reduced lunch while Teacher 13 reported 50% free and reduced lunch.
Teacher 13, a high conformity teacher, after adjusting for pretest scores outperformed the lower conformity Teacher 4 by approximately 3 questions or 7.5% higher on the posttest. Teacher 13 increased by 21% from pretest to posttest while Teacher 4 increased by 10.6%. Given the difference in potential student demographics and opportunity to learn, this matching is eye opening. Students from a lower socio-economic school with low pretest scores increased to nearly the same level of performance on posttest scores as their higher socio-economic status counterparts. The probability of a difference in increase this large or larger to occur by chance was calculated to be approximately 8.8%. Thus, differences found between these two teachers’ students were probably not due to chance alone.
Based on individual matched comparisons, significant differences existed in student posttest scores between three matched high and low conformity teachers. The difference observed in favor of lower conformity teachers (Match 1) was likely due to a low performing high conformity teacher rather than the high performance of the high conformity teacher. This is based on a student increase of only 7% in the low conformity teacher’s class. Differences in favor of higher conformity teachers were more likely due to high performance of students in the high conformity teachers’ classes rather than the low performance of students in the low conformity teachers’ classes. This is because Matches 2 and 3 had improvement rates nearly double and triple their matched low conformity counterparts. These differences shed light on implications for researchers, teachers, and teacher educators.
Based on the high performance of students’ posttest scores and improvement rates in these teachers’ classes, the difference observed between these matchings were likely due to high improvement rates of the high conformity classroom. Matching 3 also illustrated the potential for SRLE principles to cross barriers of school demographics that were measured in this study by free and reduced lunch. Students’ pretest scores were approximately 13% lower in the high conformity classroom, while raw posttest scores were very similar.
In summary, no statistical difference in reasoning ability was found collectively between groupings of low conformity and high conformity classrooms. These results were potentially biased however by weighting of the pool of students in each grouping by the number of students each teacher influenced. Further exploratory analysis revealed statistically different pairwise comparisons between matched teachers. Individual comparisons revealed that these differences were related more to the presence of high variation among teachers with high conformity to SRLE principles. Two high conformity teachers had substantial increases in students’ statistical reasoning as compared to their similar low conformity teachers and one high conformity teacher had substantially lower student increases in reasoning than its similar low conformity teacher’s students.
4 Limitations, Conclusions, and Implications
In this section, the limitations and conclusions of the study are presented. This is followed by the implications of the study for teachers and teacher educators. Lastly, directions for future research studies are suggested.
4.1 Limitations
This study is quasi-experimental, which has several inherent limitations. Possibly the largest limitation of this type of design is its lack of randomization. The methodology proposed attempted to reduce lack of randomization by matching teachers based on their previous statistical teaching experience, content knowledge of statistics at the teacher level, and on school socio-economic status. Matching of teachers was exact at the first level and varied slightly at the second and third levels. Matching 4 varied largely at the third level around socio-economic status but was included because of the teachers’ high levels of statistical content knowledge. Though these matches attempted to produce a quasi-randomization, confounding factors could easily be present. Even though research is unclear on the effect of class size (Bettinger et al. 2014), a noteworthy confounding factor present in the study was actual class sizes found in . High conformity teachers’ classrooms were smaller on average than low conformity classrooms across matched and non-matched classrooms.
Because of the lack of assignment to particular conformity groups, there were also unequal treatment allocations by each teacher within both high and low conformity groupings. One teacher had five total participants in the study while another in the group with the same conformity had 46. This large difference within conformity levels could affect conclusions made in the study. To adjust for this phenomenon, Type III sum of squares was used to reduce the effects of weighted means. Analysis was also performed between conformity levels and between teachers with Type III sum of squares to reduce this potential for error and maximize potential to observe differences.
Since the study included young students or vulnerable populations, Institutional Review Board approval of the study was delayed. Based on a later start of the study than anticipated, pretests were administered approximately after 25% of the course was completed. With this in mind, effect size in all sampled courses should be larger than measured in this research. This limitation should be considered when comparing actual pretests to posttests comparison gains, but not necessarily posttest scores to national averages. Pretests were compared between and across matched groups to reduce the effects of this limitation. Though student pretests were similar between most matched teachers, the matched teachers with large difference between school socio-economic statuses also had large differences in pretest results. The large difference in average increases in match three could have potentially been related to maturation bias in teacher 13’s class thus emphasizing the need for close matching in the quasi-experiment. In addition, pretests being administered at earlier stages in the course could help increase effect size observed in similar future studies.
Though the STI (Zieffler et al. Citation2012) was assumed an improvement from its previously completed counterpart, the instrument itself was not fully validated before the study. Thus, teachers identified as being high or low conformity could have been potentially misidentified. The technology component of the STI failed to collect information from teachers based on their identification of calculator use. This may have potentially misrepresented the use of technology within the course. The use of the STI, a purely quantitative instrument based on teachers’ perceived use and beliefs in effectiveness of SRLE principles, could have potentially produced biased results.
Based on the population in which teachers were sampled, participants in this study were largely new teachers of statistics. Remillard (Citation2005) emphasized the impact that teacher experiences, content knowledge, and pedagogical content knowledge play on enacting an intended reform based curriculum. Thus newer teachers and their variation in experiences, content knowledge, and pedagogical content knowledge could have substantially influenced the relationship of the intended and enacted curriculum. Stein, Remillard, and Smith (Citation2007) discussed the differences between the intended and enacted curriculum in education and specifically with two new elementary teachers. The intended curriculum was represented in this study by the beliefs and practice scale in the STI while the enacted curriculum was unmeasured. The discrepancy between the intended and enacted curriculum could have potentially produced higher or lower conformity rates for participants within the study potentially skewing results in unpredictable ways.
4.2 Conclusions
Although the data did not yield statistically significantly results collectively between levels of conformity with the SRLE model, there were significant differences between matched teachers. Unadjusted and adjusted means were slightly higher for lower conformity teachers’ classrooms than high conformity teachers’ classrooms. The holistic comparison of high conformity and low conformity groups, however, should be used with caution. Teachers with larger classes in the experiment weighted the effects of the teacher in high and low conformity grouping comparisons and the testing procedure.
Based on the difference in the number of students each teacher influenced, further exploratory analysis was conducted to understand differences between the high and low conformity matchings. Statistical differences among students’ posttest scores in the study did exist between three matched teachers in the study while controlling for students’ pretest scores. Exploratory analysis compared three sets of matched teachers in the quasi-experiment who had significantly different posttest scores after adjusting for pretest results. Details of these differences revealed two high conformity classrooms that demonstrated substantially high amounts of improvement in statistical reasoning and one high conformity group that showed low amounts of improvement in statistical reasoning.
In conclusion, this study has found evidence to support the use of SRLE principles to improve students’ statistical reasoning given the only two classes to substantially increase students’ statistical reasoning were from the high conformity group, teachers 10 and 13. Though these two classes were the only two classes to substantially improve in statistical reasoning, there were other high conformity groups who did not increase at such high rates. The discrepancy in improvement levels of classrooms categorized as high conformity to SRLE principles provides reason for further investigation. Perhaps certain factors of the SRLE contribute more to the increase in students’ statistical reasoning than others or a strong combination of all factors within the STI is equally important? Based on results of this study, the use of the SRLE in its entirety does more to improve students’ statistical reasoning than negatively affect it.
4.3 Implications
The results from this study can inform both teachers, curriculum writers, and teacher educators who engage in statistics or mathematics education and also suggest possible directions for future research. The following subsections provide a few recommendations.
4.3.1 Teachers, Curriculum Writers, and Teacher Educators
As teachers, curriculum writers, and teacher educators consider the results of the study, they might consider the potential for increases in reasoning with use of SRLE principles, which are related to the mathematical teaching practices described in Principles to Action (PtA) (NCTM 2014). In particular, Match 2 and 3 in this experiment revealed potential to narrow achievement gaps present in schools throughout the nation. Furthermore, two classrooms with high amounts of professional development and coursework in statistics had very high posttest scores. These results support the importance of teacher professional development in both pedagogical and content knowledge in statistics.
4.3.1.1 Equity
Matching 3 in this quasi-experiment differed in socio-economic status of students but both ended at high values of posttest scores in relationship to other classrooms in the study. The high conformity Teacher 10’s school also reported free and reduced lunch amounts larger than most participating teachers’ schools. Teacher 10 and 13 also had national averages for improvement and posttest scores well above national averages for college students. Students in these two teachers’ classrooms were able to perform and improve in statistical reasoning well above the norm and their low conformity counterparts.
These situations exemplify what NCTM (2014) describes as “equity and access.” When students have access to engaging mathematics curriculum, effective teaching and learning, and the support and resources needed through organizations like A + College Ready to maximize their learning potential, they can perform at high levels of statistical reasoning. The two high conformity classrooms with large amounts of improvement and high posttest scores also support the fact that SRLE principles (Garfield and Ben-Zvi Citation2008, Citation2009) and teacher practices in PtA can overcome differences in prior knowledge that may exist between students. Though Teacher 4’s class had substantially larger pretest scores than others in the study with reportedly no free and reduced lunch, Teacher 10 and 13’s classes improved to similar end of course reasoning ability
Based on the levels of improvement and end of course reasoning ability by students in Teachers 10 and 13 class within this study, teachers and teacher educators of statistics should help provide access to statistical courses that promote reasoning and sense making. This can be encouraged through the emphasis of statistical reasoning during development of teacher candidates in the post-secondary setting. All students in statistical classes should be asked to reason and make sense of mathematics regardless of students’ prior knowledge. The development of high levels of reasoning and sense making in statistics is achievable in all classes that make this a priority.
4.3.1.2 Effective Teaching Practices
Substantial student gains and end of course reasoning ability in Teacher 10 and 13’s classes also support the relationship between effective teaching practices in mathematics and statistics education. Students’ ability to reason about statistics in classrooms with high conformity to SRLE principles exemplify the use of instructional practice and learning environments of students. In addition, these improvements demonstrate the relationship between effective teaching and learning in mathematics and statistics.
The SRLE’s first principle requiring the focus of central statistical ideas rather than on presenting set of tools and procedures closely aligns with the PtA’s goal of the establishment of goals for learning and the use of mathematical teaching practices. The establishment of clear learning goals for specific outcomes is stressed within PtA. Teachers should set clear learning targets for their students. If teachers believe that reasoning and sense making is important to the development of students, learning should focus around this and not be expected to happen by coincidence. Similarly, teacher educators should stress this during teacher preparation. The Statistics Education of Teachers (SETS) document recommended that prospective teachers learn statistics in ways that enable them to develop a deep conceptual understanding of the statistics they will teach through appropriate modeling (Franklin et al. Citation2015). Setting student goals that stretch beyond mere statistical competency and recitation of knowledge, that focus on reasoning and sense making in statistics should be a focus of student learning.
The SRLE’s (Garfield and Ben-Zvi Citation2008, Citation2009) principles of promoting classroom discourse through statistical arguments and sustained exchanges on significant statistical ideas is key in PtA’s teaching practice standards as well. In particular, PtA stressed the use of meaningful mathematical discourse. PtA stated that students should have discourse among students that build shared understanding of mathematical ideas by analyzing and comparing student approaches and arguments (NCTM 2014). Teachers should focus on developing a learning environment that promotes the reasoning and critiquing of others’ statistical ideas. Similarly, teacher educators should provide opportunities for teacher candidates to experience this in their own classrooms. This can be illustrated through in-class demonstrations or teaching experiences and practice in field settings. However, it is important for the SRLE principles and PtA practices be developed and connected in practice through clinical experiences in the field.
The use of technology as a tool to build student understanding in mathematics and statistics classes can help build students reasoning (Chance et al. Citation2007; NCTM 2014). The SRLE requires students’ teachers to integrate the use of appropriate technological tools that allow students to test their conjectures, explore and analyze data, and develop their statistical reasoning. Teachers of statistical classrooms should use technology to build students’ understanding rather than just use it as a pedagogical tool. Teachers can do this by designing lessons around technology designed for specific learning targets. Activities that begin with smaller experiments can be developed and implemented using technology to gain deeper conceptual understanding then extended to asymptotic structures. Teacher educators can illustrate this in their own programs by providing opportunities to mix statistical content and technology in their coursework and methods courses. Focus should be placed however on the use of the technology to develop specific statistical content rather than programs to perform statistics for students without reasoning.
The use of effective curriculum that builds on student prior knowledge as well as promotes conceptual knowledge can be used to build statistical reasoning (NCTM 2000). The SRLE requires teachers to use real and motivating datasets to engage students in making and testing conjectures. PtA supports curriculum that develops important mathematics along coherent learning progressions (NCTM 2014). These progressions should be used to develop connections among areas of mathematical and statistical study and the real world (NCTM 2014). The SRLE also promotes the use classroom activities to support the development of students’ reasoning (Garfield and Ben-Zvi Citation2008, Citation2009). Similarly, PtA encourages the implementation of tasks that promote reasoning and problem solving (NCTM 2014). Teachers should use tasks that engage students in solving and discussing tasks (NCTM 2014). These tasks should promote mathematical reasoning and problem solving in mathematics and statistics and allow for multiple entry points and varied solution strategies (NCTM 2014). Teacher educators can reinforce these ideas by using curriculums in their methods courses that reinforce the creation and critiquing of student knowledge in their lessons.
Using evidence of student thinking through formative and summative assessments to build student understanding and guide instruction promote students’ ability to statistically reason (NCTM 2014). The SRLE required teachers to use assessment to learn what students know and to monitor the development of their statistical learning as well as to evaluate instructional plans and progress (Garfield and Ben-Zvi Citation2008, Citation2009). PtA’s last teaching practice promotes the elicitation and use of evidence to promote student thinking and learning (NCTM 2014). Teachers should use evidence of student thinking to assess progress toward students’ development of reasoning and sense making. Teachers can do this and teacher educators can model this by using authentic and performance based assessments as a tool of, for, and as learning.
4.3.1.3 Teacher Knowledge
Similarly, two of the three teachers (Teachers 4 and 13) who had experienced the most coursework in statistics also had students score substantially higher than the national average. Though more improvement was found in the higher conformity Teacher 13, teacher content knowledge may be a contributing factor to students’ statistical reasoning ability (Jacobson and Lehrer 2000/2002). For this reason, it is imperative for future teachers of statistics to have experiences with statistical content. Given mathematical content standards and trends of these standards, mathematics teacher educators should provide experiences for their teacher candidates to be successful. The SETS document (Franklin et al. Citation2015) highlights some of the experiences that may potentially be worthwhile for teacher candidates.
The SETS document recommended that because many currently practicing teachers have not had an opportunity to learn statistics during their pre-service preparation programs, robust professional development opportunities need to be developed to advance in-service teachers’ understanding of statistics (Franklin et al. Citation2015). Similarly, SETS recommended all courses and professional development experiences for statistics teachers allow teacher candidates to develop the habits of mind of a statistical thinker and reasoner (Franklin et al. Citation2015). Institutions need to provide opportunities for the development of currently practicing and future teachers’ statistical knowledge at in-depth levels of reasoning and thinking. This development should stretch across disciplines and focus on the improvement of statistics teaching at all levels.
4.3.2 Future Research
Based on previously mentioned limitations, current research, and findings within this study, an extension of this study would be profitable in gaining additional insights into the impact of the SRLE on students’ statistical reasoning. Factors that should be considered in an extension should include the effects of teachers taking part in the STI survey itself. It is possible that teachers taking part in the survey before the course could have exhibited reflection that influenced actual practice. This could be addressed by readministration of the STI after the course. The reasoning assessment itself could be replaced with instruments that specifically monitor statistical reasoning habits such as analyzing a problem, implementing a strategy, monitoring one’s progress, seeking and using connections, and reflecting on one’s solution (Shaughnessy, Chance, and Kranendonk Citation2009). A newer assessment tool using constructed responses and multiple choice items such as the Levels of Conceptual Understanding in Statistics (Jacobbe Citation2015) could be used to help monitor the development of students’ reasoning and conceptual understanding of statistics, especially at the K-12 levels.
Based on the experience of conducting this research experiment, it would be advisable to especially control for the difference between the intended and enacted curriculum (Stein, Remillard, and Smith Citation2007). This could be addressed by a design that included observations of participants’ instructional practice and/or a student survey on perceived instructional practice after the course. Using observation or a student survey may potentially reduce conflicts between teachers intended and enacted curriculum. Currently no known student survey exists that measures SRLE principles; thus, a useful first step would be the creation and validation of such a survey. Work by Taylor, Fraser, and White (Citation1994) could be used as an excellent starting point for such a survey. Such a survey could easily be administered before or after the administration of the CAOS.
Two teachers’ classes within this study had substantial gains compared to others within the study and to the national improvement rates for college students. Both of these classes’ teachers were categorized as high conformity to SRLE principles. Potential exists to examine differences between high conformity classrooms with intentions of understanding the variation observed within high conformity classrooms. Specific questions may address the influence of NCTM’s (2014) suggested mathematics teaching practices and principles from the SRLE (Garfield and Ben-Zvi Citation2008). The lowest and highest increases in statistical reasoning were found within the high conformity classrooms making the understanding of this variance important for effective use of SRLE principles (Garfield and Ben-Zvi Citation2008). Perhaps certain SRLE principles or mathematical teaching practices have differing impact levels on students’ ability to reason. This could suggest priorities in professional development and teacher education. In addition, class size may have had more impact in high conformity classrooms than low conformity classrooms based on the need for student interaction and teacher facilitation. Future research looking at the impact of SRLE principles on statistical reasoning might also explicitly address class size.
Comparison of teachers’ classes with different levels of socio-economic status led to interesting results. The one low conformity teacher whose students scored as well as the two high conformity classrooms had extremely high pretest scores and reported 0% free and reduced lunch. Students within this teacher’s classrooms reported taking and completing high levels of math such as AP calculus AB during their junior year in high school. This fact highlights the role that potential earlier coursework can play on students’ ability to reason statistically. Unfortunately, research related to equity in statistics education and the effects of SRLE principles on inequity are very limited. NCTM (2000, 2014) has emphasized the role of equity and access to effective instruction in mathematics classes. Future research looking to understand the effects of SRLE principles for under-represented, at-risk, and/or lower level students could expand and contribute to literature in statistics education.
In conclusion, even though results were not statistically significant when comparing low and high conformity classrooms when grouped as a whole, post hoc comparisons of the classrooms did provide evidence that supported the effectiveness of SRLE principles focusing on research based teaching, learning, assessment, and technology for promoting students’ statistical reasoning. Findings from this study suggest the importance of continuing to study the development of students’ statistical reasoning. In addition, SRLE principles have shown potential to advance students’ statistical reasoning.
References
- Baglin, J. (2013), “Evaluating Learning Theory-Based Methods for Improving the Learning Outcomes of Introductory Statistics Courses,” doctoral dissertation, RMIT University.
- Bernard, H., and Ryan, G. (eds.) (2010), Analyzing Qualitative Data: Systematic Approaches, Thousand Oaks, CA: Sage.
- Bettinger, E., Doss, C., Loeb, S., Rogers, A., and Taylor, E. (2017), “The Effects of Class Size in Online College Courses: Experimental Evidence,” Economics of Education Review, 58, 68–85.
- Chance, B. L. (1997), “Experiences with Authentic Assessment Techniques in an Introductory Statistics Course,” Journal of Statistics Education, 5(3), available at http://www.amstat.org/publications/jse/.
- Chance, B., Ben-Zvi, D., Garfield, J., and Medina, E. (2007), “The Role of Technology in Improving Student Learning of Statistics,” Technology Innovations in Statistics Education, 1, 1–26, available at https://escholarship.org/uc/item/8sd2t4rr.
- Chance, B., and Rossman, A. (2006), “Using Simulation to Teach and Learn Statistics,” in Proceedings of the Seventh International Conference on Teaching Statistics, eds. A. Rossman and B. Chance, Voorburg, The Netherlands: International Statistical Institute, pp. 1–6.
- Cook, T., and Campbell, D. (1979), Quasi-Experimentation: Design & Analysis Issues for Field Settings, Boston: Houghton Mifflin.
- Creswell, J. W. (2013), Research Design: Qualitative, Quantitative, and Mixed Methods Approaches, Thousand Oaks, CA: Sage.
- DelMas, G., Garfield, J., Ooms, A., and Chance, B. (2007), “Assessing Students’ Conceptual Understanding After a First Course in Statistics,” Statistics Education Research Journal, 6, 28–58, available at http://iase-web.org/
- Feldman, A., Konold, C., Coulter, B., and Conroy, B. (2000), Network Science, a Decade Later: The Internet and Classroom Learning, Mahwah, NH: Erlbaum.
- Ferguson, C. J. (2009), “An Effect Size Primer: A Guide for Clinicians and Researchers,” Professional Psychology: Research and Practice, 40, 532–538. DOI:10.1037/a0015808.
- Franklin, C., Bargagliotti, A., Case, C., Kader, G., Scheaffer, R., and Spangler, D. (2015), “Statistics Education of Teachers,” The American Statistical Association website, available at www.amstat.org/education/SET/SET.pdf.
- Garfield, J. (2002), “The Challenge of Developing Statistical Reasoning,” Journal of Statistics Education, 10, available at http://www.amstat.org/publications/jse/. DOI:10.1080/10691898.2002.11910676.
- Garfield, J., and Ben-Zvi, D. (2008), “Preparing School Teachers to Develop Students’ Statistical Reasoning,” in Proceedings of the Joint ICMI/IASE Study on Statistics Education in School Mathematics: Challenges for Teaching and Teacher Education, eds. C. Batanero, G. Burrill, C. Reading, and A. Rossman, Monterrey, Mexico: ITESM.
- Garfield, J., and Ben-Zvi, D. (2009), “Helping Students Develop Statistical Reasoning: Implementing a Statistical Reasoning Learning Environment,” Teaching Statistics, 31, 72–77.
- Jacobbe, T. (2015), “NSF Funds Research in Statistics Education: LOCUS,” Amstat News, 453, 35–36.
- Jacobson, C., and Lehrer, R. (2002), “Teacher Appropriation and Student Learning of Geometry Through Design, in Lessons Learned From Research, eds. J. Sowder and B. Schappelle, Reston, VA: National Council of Teachers of Mathematics, pp. 85–91. (Reprinted from Journal for Research in Mathematics Education, 31, 71–88, by C. Jacobson and R. Lehrer, 2000).
- Loveland, J. L. (2014), “Traditional Lecture Versus an Activity Approach for Teaching Statistics: A Comparison of Outcomes,” doctoral dissertation, Utah State University.
- Mertler, C., and Vannatta, R. (2010), Advanced and Multivariate Statistical Methods: Practical Application and Interpretation, Glendale, CA: Pyrczak Publishing.
- Middleton, J., and Jansen, A. (2011), Motivation Matters and Interest Counts: Fostering Engagement in Mathematics, Reston, VA: National Council of Teachers of Mathematics.
- Mokros, J., and Russell, S. (1995), “Children’s Concepts of Average and Representativeness,” Journal for Research in Mathematics Education, 26, 20–39. DOI:10.2307/749226.
- National Council of Teachers of Mathematics (1991), Professional Standards for Teaching Mathematics, Reston, VA: National Council of Teachers of Mathematics.
- National Council of Teachers of Mathematics (1995), Assessment Standards for School Mathematics, Reston, VA: Author.
- National Council of Teachers of Mathematics (2000), Principles and Standards for School Mathematics, Reston, VA: National Council of Teachers of Mathematics.
- National Council of Teachers of Mathematics (2014), Principles to Action: Ensuring Mathematics Success for All, Reston, VA: National Council of Teachers of Mathematics.
- Pesek, D., and Kirshner, D. (2002), “Interference of Instrumental Instruction in Subsequent Relational Learning,” in Lessons Learned From Research, eds. J. Sowder and B. Schappelle, Reston, VA: National Council of Teachers of Mathematics, pp. 101–107. (Reprinted from Journal for Research in Mathematics Education, 31, 524–540, by D. Pesek and D. Kirshner, 2000).
- Petit, M., Zawojewski, J., and Lobato, J. (2010), “Formative Assessment in Secondary School Mathematics Classrooms,” in Teaching and Learning Mathematics: Translating Research for Secondary School Teachers, ed. J. Lobato, Reston, VA: NCTM, pp. 67–75.
- Qualtrics (2013), The Ridiculously Powerful Insight Platform, Provo, UT: Qualtrics, available at www.qualtrics.com.
- Reichardt, C., and Mark, M. (2004), “Quasi-Experimentation,” in Handbook of Practical Program Evaluation (Vol. 19), eds. J. Wholey, H. Hatry, and K. Newcomer, San Francisco: Jossey-Bass Inc., pp. 126–149.
- Remillard, J. T. (2005), “Examining Key Concepts in Research on Teachers’ Use of Mathematics Curricula,” Review of Educational Research, 75, 211–246. DOI:10.3102/00346543075002211.
- Shaughnessy, J. M., Chance, B., and Kranendonk, H. (2009), Focus in High School Mathematics: Fostering Reasoning and Sense Making in Statistics and Probability, Reston, VA: National Council of Teachers of Mathematics.
- Slauson, L. (2008), “Students’ Conceptual Understanding of Understanding of Variability,” doctoral dissertation, The Ohio State University.
- Smith, M., and Stein, M. (2011), 5 Practices for Orchestrating Productive Mathematical Discussions, Reston, VA: NCTM.
- Stein, M., Remillard, J., and Smith, M. (2007), “How Curriculum Influences Student Learning,” in Second Handbook of Research on Mathematics Teaching and Learning, ed. F. Lester Jr., Charlotte: Information Age Publishing, pp. 319–369.
- Stuart, E., and Rubin, D. (2008), “Best Practices in Quasi-experimental Designs,” in Best Practices in Quantitative Methods, ed. J. Osborne, Los Angeles: SAGE Publications, pp. 155–176.
- Taylor, P., Fraser, B., and White, L. (1994), “CLES: An Instrument for Monitoring the Development of Constructivist Learning Environments,” in Annual Meeting of the American Educational Research Association, New Orleans, LA.
- Zieffler, A., Park, J., Garfield, J., DelMas, R., and Bjornsdottir, A. (2012), “The Statistics Teaching Inventory: A Survey on Statistics Teachers’ Classroom Practices and Beliefs,” Journal of Statistics Education, 20, available at http://www.amstat.org/publications/jse/v20n1/zieffler.pdf. DOI:10.1080/10691898.2012.11889632.
Appendix
Statistics Teaching Inventory
The following survey will take approximately 15 min of your time. Please answer each question carefully and candidly and respond to all the questions in reference to an introductory statistics course. Refer to the AP statistics course that you currently teach or have recently taught.
Directions: For questions with a radio button: Select only one answer. For questions with a checkbox: Select all that apply. For some questions, you will be asked for a percentage. Use the slider to mark the percentage for these questions. If you are unsure of an exact percent, please enter an approximation. Use the arrows at the bottom right to move to the next set of questions.
This survey was first created and modified by Andrew Zieffler, Jiyoon Park, Joan Garfield, Robert delMas, and Audbjorg Bjornsdottir through a grant from the National Science Foundation (STEPS Project, NSF DUE-0808862).
Part I
Consider the total amount of time that you meet face-to-face with your students. Approximately what percentage of this time is spent on each of the following? (Note: The percentages below should add up to 100%)
━━━━━━━ 1. Students meeting together as a whole class (not in small groups) for lecture, discussion, or demonstration:
━━━━━━━ 2. Students working in groups:
━━━━━━━ 3. Students working individually on an activity:
━━━━━━━ 4. Students taking an assessment:
5. Consider a student who was fully engaged in your course. To what extent do you think that student would agree or disagree with the following statements about this course? m
Part II
The following items will ask you about your curricular emphasis. Consider the entirety of your course as you complete this section. To what extent are the following addressed in your course?
To what extent do you emphasize each of the following approaches to statistical inference in your course?
10. Of all the datasets students see in this course, what portion of them are real data?
m None
m A few
m About half
m Most of them
m All of them
Part III
1. Other than hand calculators, do students use technology tools during the course?
m Yes
m No
If Yes Is Selected, Then Skip To 3. In what settings do students work. If No Is Selected, Then Skip To 2. What are your reasons for not using.
2. What are your reasons for not using technology other than hand calculators in your course? (Select all that apply.)
q there is no computer technology available
q there are departmental constraints on technology use
q students are already provided with statistical output
q students use hand calculators to compute statistics using formulas
q other ━━━━━━━━━━━━━━
If 2. What are your reasons for. Is Greater Than or Equal to 0, Then Skip To End of Block
3. In what settings do students work with each of these technology tools? (Select all that apply.)
Questions 4 and 5 ask you to consider how students use technology. In answering these questions, consider the total amount of time students use technology. (These responses do not need to add up to 100%.)
━━━━━━━ 4. What percentage of time that students spend using technology is designed to spent analyzing data?
━━━━━━━ 5. What percentage of time that students spend using technology is designed to be spent understanding statistical concepts?
Part IV
Consider your total set of assessments that count for a grade in your class. Approximately what percentage of the students’ grade is dedicated to evaluating each of the following? (These percentages do not need to add up to 100%.)
━━━━━━━ 1. Students’ ability to use formulas to produce numerical summaries of a dataset:
━━━━━━━ 2. Students’ ability to perform step-by-step calculations to compute answers to problems:
━━━━━━━ 3. Students’ ability to critically examine statistics in the media:
━━━━━━━ 4. Students’ ability to interpret results of a statistical analysis:
━━━━━━━ 5. Students’ ability to reason correctly about important statistical concepts:
━━━━━━━ 6. Students’ ability to successfully complete a statistical investigation (e.g., a course project):
━━━━━━━ 7. Other (please describe):
Part V
Please rate the extent to which you agree or disagree with each of the following statements as they reflect your beliefs (but not necessarily your actual teaching) regarding the teaching, learning, and assessment of introductory statistics:
Part VI
1. How many students are enrolled in one typical section of this course?
2. Please indicate the mathematical prerequisite for this course:
m Calculus
m Pre-Calculus
m Algebra II
m None
m Other ━━━━━━━━━━━━━━
3. Identify any constraints that keep you from making changes that you would like to implement to improve your course. (Select all that apply):
q Personal time constraints
q Departmental or institutional constraints
q The teaching assistants you work with
q Technology constraints (e.g., lack of computer lab, cost of software)
q Characteristics of students (ability, interest, etc.)
q Limitations in terms of what can be done within the classroom management system
q Your own comfort level with the classroom management system
q Other ━━━━━━━━━━━━━━
Part VII
1. How many years have you been teaching an introductory statistics course?
2. In your graduate coursework, how many courses did you take in theoretical statistics (e.g., mathematical statistics, probability)?
m None
m 1
m 2
m 3
m 4
m 5 or more
3. In your graduate coursework, how many courses did you take in applied statistics (i.e., involved the analysis of data)?
m None
m 1
m 2
m 3
m 4
m 5 or more
4. Please rate the amount of experience you have had in analyzing data outside of your coursework in statistics (e.g., in your own research, consulting, etc.).
m No experience
m Very little experience
m Some experience
m A lot of experience
For items 5–8, please indicate the number of professional development opportunities in which you have participated during the last 2 years to improve your teaching of statistics.
9. How many years have you been a part of the A + College Ready program?
10. Please provide any additional comments in the space below.
11. The purpose of this research is to monitor student reasoning in your statistics class. Teachers whose students participate in this research will be required to administer a pre-assessment and post-assessment that measures students’ statistical reasoning ability. In addition, teachers will be required to distribute opt-out letters to students at the beginning of the course to ensure student and parent willingness to participate. The researcher will contact the teachers’ district leader responsible for research for approval before the teacher sends home consent letters to parents. Would you be willing to participate further in this research if your district leader approves?
m Yes
m No
If No Is Selected, Then Skip To End of Survey. If Yes Is Selected, Then Skip To While all responses will remain c.
While all responses will remain confidential, your contact information is needed for further participation in this research.