
 ?Mathematical formulae have been encoded as MathML and are displayed in this HTML version using MathJax in order to improve their display. Uncheck the box to turn MathJax off. This feature requires Javascript. Click on a formula to zoom.
Abstract
Teaching quantitative methods at the undergraduate level is a difficult yet rewarding endeavor due to the challenges instructors face in presenting the material. One way to bolster student learning is through the use of statistical software packages. Google Sheets is a cloud-based spreadsheet program capable of many basic statistical procedures, which has yet to be evaluated for use in quantitative methods courses. This article contains pros and cons to using Google Sheets in the classroom and provides an evaluation of student attitudes toward using Google Sheets in an introductory quantitative methods class. The results suggest favorable student attitudes toward Google Sheets and which attitudes toward Google Sheets show a positive relationship with quantitative self-efficacy. Thus, based on the positive student attitudes and the unique features of Google Sheets, it is a viable program to use in introductory methods classes. However, due to limited functionality, Google Sheets may not be useful for more advanced courses. Future research may want to evaluate the use of third-party Google Sheets applications, which can increase functionality, and the use of Google Sheets in online classes.
1 Introduction
1.1 Difficulties Teaching Quantitative Methods
Many undergraduate programs, especially in the social sciences, require a statistics course. Whereas this may be exciting and rewarding for instructors who are interested in statistics, it seems many undergraduate students have no desire to take these courses, or even fear taking them (Dunn Citation2000; Onwuegbuzie and Wilson Citation2003; Harlow Citation2013). Despite any misgivings from students, learning statistics is a vital part of any education. Statistical literacy is necessary to make sense of research, and research can help guide business decisions, policy choices, and intervention design (Garfield Citation2002; Zieffler et al. Citation2008). However, statistics education is becoming more difficult because of the number of statistical methods developed in recent decades (Aiken et al. Citation1990). These methods are often multivariate and more difficult to understand than univariate or bivariate methods. Still, because they are becoming more common in research (Harlow et al. Citation2013), students need solid foundational training in order to understand these more advanced methods when they read studies in content courses. Furthermore, multiple approaches to statistics are becoming more common in the social sciences with paradigms of modeling (Rodgers Citation2010) and the “new” statistics (Cummings Citation2011) taught alongside or instead of null hypothesis significance testing (Harlow, Mulaik, and Steiger Citation2016). These advances in the field of quantitative methods are exciting, but teaching these new methods can be challenging. Some concerns may include student reluctance and/or anxiety with learning quantitative methods, having to teach several approaches alongside each other, or choosing not to touch on some approaches in favor of others. Thus, introductory quantitative methods instructors face a difficult challenge to properly prepare their students for future courses, research, and employment. In a rigorous field that is quickly evolving, evaluating new approaches to provide foundational training and developing positive attitudes toward a complex topic are essential to promoting statistics education.
1.2 Importance of Quantitative Self-Efficacy
Bandura’s (Citation1986) self-efficacy theory provides a basis for the link between quantitative self-efficacy and performance in the classroom. Broadly defined, self-efficacy “is the belief one has about being able to execute a specific task successfully to obtain a desired outcome” (Bandura Citation1986, p. 5). Later, Bandura (Citation1997) redefined self-efficacy to include those beliefs regarding an individual’s capacity to produce a performance that will lead to anticipated outcomes. Thus, regulatory self-efficacy is used to describe one’s abilities to overcome obstacles or challenges to successful performance. In the context of a statistics course, quantitative self-efficacy has been shown to be positively associated with course performance (Harlow et al. Citation2002). Moreover, quantitative self-efficacy has been shown to improve throughout the semester concomitant with small group learning (Springer et al. Citation1999). Additionally, Chemers, Hu, and Garcia (Citation2001) revealed that academic self-efficacy was strongly related to classroom performance and overall class satisfaction in first-year college students. Finally, a review by Pajares (Citation1996) concluded that findings across academic domains support Bandura’s (Citation1986) contention that efficacy beliefs mediate the effect of skills or other self-beliefs on subsequent classroom performance by influencing effort, persistence, and perseverance.
Whereas the studies above support a link between quantitative self-efficacy and course performance, few studies have examined self-efficacy for using statistical packages such as Google Sheets and how this efficacy is related to course performance. Given that many instructors are using statistical packages to help teach quantitative methods courses (see Section 1.3 below for more on this subject), it may well be that quantitative self-efficacy is also related to attitudes toward a statistical package. In other words, positive attitudes toward a statistical package may be associated with increased quantitative self-efficacy. If learning to use the statistical package is an essential part of the course (e.g., to receive homework grades and/or do projects), then course performance could depend on the student’s ability to effectively learn and use the program. Thus, the quantitative self-efficacy and statistical package attitude relationship and how it relates to course performance is an area worth exploring that has not been heavily researched in the current literature.
1.3 Student Learning with Computer Packages
One way to aid student learning of quantitative methods is through the use of computer packages (e.g., SPSS, SAS, R, MS Excel, and others) designed specifically to conduct statistics. In fact, the 2016 guidelines for assessment and instruction in statistics education (GAISE) also recommend using technology in the classroom, further supporting the use of a statistical package as part of course instruction (American Statistical Association Citation2016). The use of these packages in the classroom allows students to spend more time conceptualizing and interpreting statistics instead of manual computation. Previous research shows that using statistical packages can result in an increased course performance compared to mainly lecture-based courses (Basturk Citation2005; Sosa et al. Citation2011). In fact, the approach of teaching statistics with a statistical package has become so utilized that some quantitative methods textbooks offer the interpretation of output from statistical packages within the chapters (see Cummings Citation2011 for examples using MS Excel; Harlow Citation2014 for examples using SAS, SPSS, and EQS; Gravetter and Wallnau Citation2017 for examples using SPSS). To determine which statistical package instructors may want to use, previous studies have evaluated the use of some common statistical packages. Warner and Meehan (Citation2001) suggested using MS Excel because it teaches spreadsheet skills, it is simple to use, it allows for electronic submission of assignments, and it is relatively low-cost. MS Excel also has an Analysis ToolPak feature that can conduct many basic statistical tests. In their evaluation, Warner and Meehan (Citation2001) asked for student opinions of using Excel in the classroom and found mainly favorable responses. Taking a different approach to package evaluation, Prvan, Reid, and Petocz (Citation2002) developed laboratory assignments using Minitab, SPSS, and MS Exceland found that students viewed the assignments favorably, but no data on student attitudes toward any individual package were gathered beyond noting that students found the programs easy to use. Prvan et al. recommended using Minitab, but noted that was mainly due to their personal preferences and any of the packages would work well in the classroom (Prvan, Reid, and Petocz, Citation2002). While classroom evaluations on Minitab, SPSS, and MS Excel show favorable outcomes for student learning, no such evaluation has been conducted on Google Sheets. Given the advantages of Google Sheets (further explained in Section 2.1), Google Sheets could be another viable solution to the difficulties of teaching quantitative methods that is also highly accessible for students and faculty alike.
2 Google Sheets
Google Sheets is a cloud-based spreadsheet program hosted by Google and has many of the same functions as MS Excel. It is available to any user who signs up for a Google account. Users can easily upload or input data, and then write code to analyze the data. Any data entered into Google Sheets are stored on a cloud server (i.e., Google Drive), allowing for accessibility any time an individual logs into their Google account regardless of location or computer.
2.1 Advantages of Google Sheets
Google Sheets has several advantages over more specialized statistical packages (e.g., SPSS, SAS, and R). First, learning a spreadsheet application such as Google Sheets makes students more competitive on the job market due to the high value placed on spreadsheet skills (Davis Citation1997; Kavanagh and Drennan Citation2008; Rackliffe and Ragland Citation2016; Schneider et al. Citation2017). By working with spreadsheets, students gain a valuable skill set that can be used both inside and outside of the classroom. Second, because Google Sheets uses cloud-based storage, once a data set has been loaded into Google Sheets, it can be accessed anywhere the student logs into their account. This eliminates the hassle of making sure a data set is available to the student, wherever they are, especially if the statistical package is only available in limited computer labs on campus. Depending on how large the data set is, some students may even be able to use Google Sheets on tablets or smart phones, which also increases accessibility. Third, from an economic perspective, Google Sheets is completely free. Anyone with a Google account (whether personal or from the university) can use Google Sheets with no charge, which is ideal for students who typically do not have much disposable income or for any institution which does not provide access to advanced statistical packages across campus. In fact, a student does not need to own a computer but just have access to one on-campus to use Google Sheets thereby eliminating economic barriers for low socioeconomic status students. Fourth, students may share their spreadsheets with other students and instructors/teaching assistants. This share function allows two or more persons to use the same file at once, and can allow for real-time correction of any mistakes made when writing code. The revision history feature could also allow group mates and/or instructors to see who contributed to which part of a document, which could allow instructors to see if students are writing the code themselves or having someone else write it for them. Google Sheets also has chat functionality and comment windows allowing for individuals to give and receive notes to anyone with access to the document. These functions can be extremely useful in situations like group projects or grading. Fifth, Google Sheets has an easily accessible help function. All one needs to do is start typing a function and a window opens within the spreadsheet cell. If the window is clicked on, a dialog box appears showing the proper notation for that function and a link for further help if needed. Sixth, it is possible to develop third-party plug-ins or add-ons to Google Sheets to improve functionality, similar to developing R packages.
2.2 Statistical Functions Available in Google Sheets
Although Google Sheets has many statistical functions available, it is not as robust as more specialized statistical packages, including the MS Excel’s Analysis ToolPak (Warner and Meehan Citation2001). However, Google Sheets does have support for many basic statistical tests typically taught in introductory quantitative methods courses. For example, several widely used textbooks (e.g., Moore et al. Citation2016; Agresti et al. Citation2017; Gravetter and Wallnau Citation2017) cover the following topics: mean, median, mode, skewness, standard deviation, variance, z-scores, z-tests, t-tests (single, independent, paired), analysis of variance (one-way, repeated, two-way), correlation, regression, and chi-square. Google Sheets has partial or full support for these topics except the single-sample t-test and chi-square.
Functions in Google Sheets are entered in an empty cell within the same spreadsheet containing data, although it is possible to run functions in a new spreadsheet within the same file. All functions use a standard notation which starts with an “=,” followed by the function, and then the data range in parentheses. This functionality is similar to MS Excel, which might be useful as students learn to use multiple spreadsheet packages. As an example, the command = AVERAGE(A1:A10), finds the average of all data within cells A1 to A10. An IF modifier can be added to most basic functions to specify which values should be analyzed as part of the function. This can be useful when doing frequency counts. For example, if column A is coded such that 1 = Treatment Group and 2 = Control Group, then = COUNTIF(A1:A100, 2) tells Google Sheets to count all cells between A1 and A100 that contain a 2. The output of this function would be the number of participants in the control group.
As a course moves from descriptive statistics to inferential statistics, Google Sheets provides support here as well. The = TTEST function can be used to analyze paired sample t-tests, independent sample t-tests with equal variances, or independent sample t-tests with unequal variances. An example of the code is = TTEST(A1:A10, B1:B10, 2, 2). This tells Google Sheets to analyze the data in cells A1–A10 and B1–B10, which need to contain the data for the two different groups. The first 2 in the code tells Google Sheets to conduct a two-tailed test (a 1 in this position conducts a one-tailed test). The second 2, or last part of the code, specifies what type of t-test to conduct. A 1 selects a paired sample, 2 an independent sample with equal variances, and 3 an independent sample with unequal variances. For a list of Google Sheets codes of common statistical procedures, please refer to .
Table 1 Example code for some Google Sheets functions.
2.3 Disadvantages of Using Google Sheets
As shown in the notes within , the lack of some features in Google Sheets can be an issue as topics become more advanced. First, for z-tests, t-tests, and F-tests, Google Sheets can only calculate the p-value using the statistical functions. It is possible to calculate the actual z-scores, t-scores, and F-ratios, but this requires writing the code step by step and keeping careful track of what values are in which cell during computation. Second, when it comes to correlations and regression, the statistics are provided but not the p-values. Additionally, for regression, the F-test is not provided, so unless the F-value is calculated or given to students by the instructor, it is difficult to know if the regression model is significant or not without writing additional code. For example, if using the formula F = (R2/q)/(1-R2)/(), where q = the number of predictors, it is possible to obtain the F-value if the R2 is known. This F-value could be checked with q and N-q-1 degrees of freedom for significance using an online calculator.
Another disadvantage of Google Sheets comes from the lack of effect size and confidence interval support. Both effect sizes and confidence intervals are an important part of an introductory statistics curriculum, especially within the social sciences (Appelbaum et al. Citation2018), so instructors using Google Sheets will need to either code these values step by step as well or provide students with prewritten code to calculate those values. Other disadvantages include a required internet connection and limited graphing functionality. Potential users should also be aware that the language in the help files can sometimes be confusing and/or misleading. For example, if a user wants to conduct a one-tailed t-test, the = TTEST function help file states it will only return a p-value of a higher value of the t-statistic. In other words, the default setting for the = TTEST function is testing if the mean is greater than the value of interest. Thus, the user must know which tail he or she wishes to test and appropriately adjust the result (i.e., 1 – p-value) if the desired test is a lower value of the t-statistic. It is also not possible to directly comment within the code, but written instructions could be provided in a cell next to a cell containing the actual code to assist students. Finally, there are usually several values of interest when conducting statistical tests (e.g., for a t-test, one needs the t-value, degrees of freedom, and p-value at minimum). As shown in , Google Sheets only gives one value at a time and does not have full support for all values using the different commands. Thus, instructors who do not want to use the step-by-step coding described above may find using Google Sheets to be tedious.
3 Pilot Evaluation of Using Google Sheets in the Classroom
The authors used and evaluated Google Sheets in an introductory quantitative methods course required for social science students. Students enrolling into this course need an introductory math course as a prerequisite and to be sophomores in standing. Students in this course were taught primarily with Google Sheets during lab sessions, but there was some exposure to SPSS and hand calculations during labs and lectures. During lab sessions, students had the option of either using a lab computer or their personal devices (laptop or tablet) to conduct analyses. Pilot data were collected during the middle and end of the Fall 2015 semester, and confirmatory replication data were collected at the beginning, middle and end of the Fall and Spring 2016 semesters. As part of this evaluation, data on quantitative self-efficacy and other quantitative attitudes (e.g., anxiety) not analyzed as a part of this study were gathered since positive quantitative attitudes have been linked with performance in quantitative courses (Harlow et al. Citation2002). There were two main research questions within this evaluation of the pilot and confirmatory data. The first question was to gain insight into student perspectives of Google Sheets, and focused on whether or not students viewed Google Sheets as a helpful tool for learning statistics. The second question investigated whether attitudes toward Google Sheets was related to quantitative self-efficacy.
3.1 Pilot Data Participants
The pilot study was conducted with a convenience sample of 45 students during the Fall 2015 semester at a large, rural university in the northeastern United States. Participants ranged in age from 18 to 35 (M = 20.53, SD = 2.89). A majority of the sample identified as female (64.4%) and white (64.4%); 59 students were enrolled in the class, making the participation rate 76.3%.
3.2 Pilot Study Materials
3.2.1 Quantitative Self-Efficacy
Quantitative self-efficacy (Harlow et al. Citation2002) was assessed using a five-item scale, ranging from 1 = Strongly Disagree to 5 = Strongly Agree. A sample item is “Understand the concepts of statistics.” This scale is scored by averaging the items, where higher scores indicate a higher self-efficacy. A coefficient omega of 0.44, 95% CI, [0.17, 0.65] was found in this sample at the mid-semester time point, and of 0.68, 95% CI, [0.49, 0.79] at the end semester time point suggesting weak to acceptable internal consistency. A correlation across mid- and end-semester timepoints was r = 0.78, p < 0.001 showing reasonable test–retest reliability. The full measure may be found in the Appendix.
3.2.2 Attitudes Toward Google Sheets
Attitudes toward Google Sheets was examined using a five-item scale, ranging from 1 = Never True to 5 = Always True. A sample item is, “Google Sheets has not helped me make more sense out of the material.” All negatively worded items were reverse-scored before averaging the responses. Scores ranged from 1 to 5, with higher scores indicating more favorable attitudes toward Google Sheets. This scale was adapted from items within the peer mentor, consult corners, know and not know, critiques, and review scales used by Harlow et al. (Citation2002) and has not been validated since the changes were made for use with Google Sheets. A coefficient omega of 0.87, 95% CI, [0.77, 0.93] was found for mid-semester responses and 0.62, 95% CI, [0.39, 0.76] for end-semester responses, indicating good to just-acceptable internal consistency. A correlation between the two time points was r = 0.67, demonstrating acceptable test–retest reliability.
3.2.3 Demographics
A demographic questionnaire asked participants their age, gender identity, racial/ethnic identity, and current major.
3.3 Pilot Study Procedure
A section of an introductory quantitative methods course was the setting for this study. The course was taught by a team of three graduate students who were supervised by a faculty member throughout the semester. One graduate student was the course instructor, who was responsible for lecturing twice a week. The other two graduate students were each responsible for half of the class and would hold a weekly lab to teach their students how to use Google Sheets and reinforce concepts from lecture. The faculty member regularly met with the graduate student team to provide guidance and feedback on questions. The course students were required to complete eight homework assignments and one project using Google Sheets during the semester. The homework assignments tasked students with writing the Google Sheets code and analyzing the findings. Students were asked to provide their Google Sheets code and the correct answer in the assignments. Students were placed into small groups for the project so they had peers to consult with in case they had any difficulties with the analyses, however each student needed to turn in their own project. Each project required students to analyze two variables of a large public-access database, choose the correct statistical test for the analysis, write the Google Sheets code, and interpret their findings. All of the methods listed in except for the = FDIST command were taught during the lab sessions.
Two assessments were conducted as a part of this pilot evaluation. The first was during the middle of the Fall 2015 semester after using Google Sheets for several homework assignments. Students who chose to participate were given a link to complete several surveys online. The first page of the link directed students to an informed consent, where they were asked to read and provide their student ID number if they chose to participate. Students choosing to participate were then asked to fill out surveys assessing their quantitative self-efficacy, attitudes toward Google Sheets, and other quantitative attitudes unrelated to the current study (e.g., anxiety). The final page asked students for several demographic variables, and upon completion students were awarded an extra credit point for their participation. The second assessment was done during the end of the Fall 2015 semester, after students completed all eight lab sessions, with the corresponding homework assignments, using Google Sheets. The extra credit points were added to the total number of points earned by the student over the semester (295 possible points), so were worth 1/295 or 0.34% of their final grade, each.
3.4 Pilot Results
3.4.1 Pilot Data Preliminary Analysis
Prior to the main analyses, all missing data (21.32%) were imputed using the expectation maximization method as it is robust against issues of sample size, amount of missing data, and data distribution (Gold and Bentler Citation2000). After the missing data were imputed, all necessary items were reverse scored and scales were scored. Internal consistency was calculated for scales and normality checks for skewness and kurtosis were done with no issues found. Data analysis was conducted using Google Sheets when possible, and checked using the SPSS version 24.0.
3.4.2 Attitudes Toward Google Sheets Pilot Results
After scoring the attitudes toward Google Sheets measures, the pilot results indicated that at both time points students showed overall favorable attitudes. The average score (where higher scores indicate more favorable attitudes) for the mid-semester time point was 3.85 (SD = 0.80) and for the end-semester time point was 3.97 (SD = 0.62). Since this scale was scored on a scale from 1 to 5, both average scores, greater than the midpoint of 3, suggest favorable attitudes. Please see for results of individual scale items.
Table 2 Individual scale results for attitudes toward Google Sheets (pilot data).
3.4.3 Linear Regression Pilot Results
The next step in the analyses was to build a simple linear regression model testing if quantitative self-efficacy significantly related to attitudes toward Google Sheets. The linear regression analysis was done twice, once for the mid-semester data and then for the end-semester data.
The model for the mid-semester data was significant, F(1, 44) = 20.89, p < 0.001, R2 = 0.33, 95% CI, [0.12, 0.54] revealing a large effect size. Quantitative self-efficacy t(44) = 4.57, p < 0.001, , 95% CI, [0.35, 0.90] was a significant predictor of attitudes toward Google Sheets with a large effect. The model for the end-semester data was not significant, F(1, 44) = 2.22, p = 0.14.
4 Confirmatory Evaluation of Using Google Sheets in the Classroom
4.1 Confirmatory Sample Participants
Additional data were gathered at three time points over the Spring and Fall 2016 semesters. These two samples were merged (N = 117) and used for confirmatory replication of the pilot data findings. The merged sample was predominantly female (85.5%) and white (72.6%); 152 students were enrolled during the Spring and Fall 2016 semesters, making the participation rate 77%.
4.2 Confirmatory Sample Materials and Procedure
The same measures were used as for the Fall 2015 pilot study. The procedure changed slightly because three waves of data were gathered, and a third lab section was offered with a third graduate TA teaching the additional lab in Fall 2016 (the other two TAs stayed the same). The first time point was during the beginning of the semester, after students completed their first lab using Google Sheets. The second and third time points followed the same procedure as the pilot data process of gathering data during the middle and final week of the semester. No other substantial edits were made to the homework assignments or group projects. As in the pilot sample, the extra credit points were added to the total number of points earned by the student over the semester (295 possible points), so were worth 1/295 or 0.34% of their final grade each.
5 Results
5.1 Validating Findings with Confirmatory Sample
The same analyses from the pilot data were reconducted using the confirmatory sample, with the addition of a beginning semester linear regression analysis between quantitative self-efficacy and attitudes toward Google Sheets. All missing data (28.67%) for the confirmatory sample were imputed using maximum likelihood estimation prior to analyses. No issues of nonnormality were found when conducting initial data analysis across the three time points.
5.2 Attitudes Toward Google Sheets Confirmatory Results
Overall favorable attitudes toward Google Sheets were found in the confirmatory sample as well. The average attitude score at the beginning time point was 3.72 (SD = 0.51), at the middle time point was 3.73 (SD = 0.60) and end time point 3.92 (SD = 0.66). As with the pilot data, all of these average scores were greater than the midpoint of 3.5, indicating overall favorable attitudes. Please see for individual item averages for each time point.
Table 3 Individual scale results for attitudes toward Google Sheets (confirmatory sample).
5.3 Linear Regression Confirmatory Results
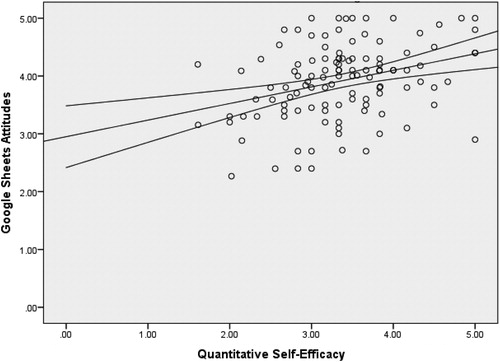
The same linear regression model of quantitative self-efficacy predicting attitudes toward Google Sheets was built at the three separate time points in the confirmatory sample. For the beginning of the semester, the model was significant, F(1, 116) = 12.89, , R2 = 0.10, 95% CI, [0.00, 0.20]. Quantitative self-efficacy t(116) = 3.59, p < 0.001, β = 0.32, 95% CI, [0.10, 0.34] was a significant predictor of attitudes toward Google. At the mid-semester time point, the model was also significant, F(1, 116) = 13.55, p < 0.001, R2 = 0.11, 95% CI, [0.01, 0.21]. Quantitative self-efficacy t(116) = 3.68, p < 0.001, β = 0.33, 95% CI, [0.12, 0.41] was again a positive predictor of attitudes toward Google Sheets. The end-semester findings were consistent with the previous two results, F(1, 116) = 13.61, p < 0.001, R2 = 0.11, 95% CI, [0.01, 0.21], with quantitative self-efficacy significantly predicting attitudes toward Google Sheets t(116) = 3.69, p < 0.001,
= 0.33, 95% CI, [0.13, 0.44]. Please see for depictions of scatterplots showing the beginning, middle, and end semester timepoints, respectively.
Fig. 1 Scatterplot of Google Sheets attitudes and quantitative self-efficacy (beginning time point).
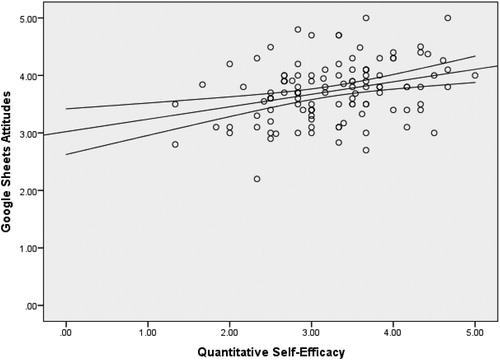
Fig. 2 Scatterplot of Google Sheets attitudes and quantitative self-efficacy (middle time point).
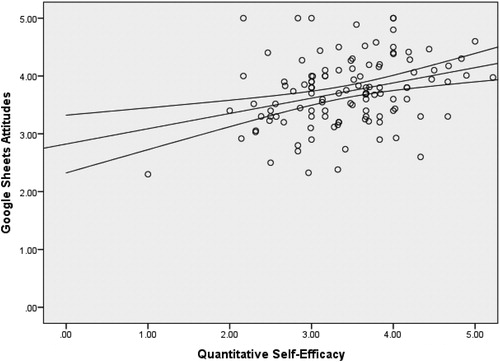
Fig. 3 Scatterplot of Google Sheets attitudes and quantitative self-efficacy (end time point).
5.4 Exploratory Longitudinal Analysis
After exploring the cross-sectional results at each time point, an exploratory three-wave crossed-lagged panel was constructed to examine possible longitudinal effects. These analyses were considered exploratory as the sample size (N = 117) does not meet conventional guidelines for longitudinal research; especially using cross-lagged panels (Newsom Citation2015). Due to the cross-sectional associations found at each time point, the model was built specifying covariances between attitudes toward Google Sheets and quantitative self-efficacy at each time point.
Model fit interpretation used the guidelines suggested by Hu and Bentler (Citation1999) as well as Steiger and Lind (Citation1980) where a Comparative Fit Index (CFI) equal or greater than 0.90/.95 indicated good/great fit, root mean square error of approximation (RMSEA) less than or equal to 0.10/0.08/0.05 indicated acceptable/good/great fit, standardized root mean square residual (SRMR) less than or equal to 0.08, and a nonsignificant chi-squared test. The model showed somewhat acceptable fit, CFI = 0.93, SRMR = 0.05, RMSEA = 0.23, 90% CI, [0.16, 0.31], (4) = 28.77,
. There were significant positive associations between attitudes toward Google Sheets at the beginning and middle time points (β = 0.53, z = 6.41, p < 0.001), and middle and end time points (β = 0.77, z = 12.51,
). There were also significant positive associations between quantitative self-efficacy at the beginning and middle time points (β = 0.70, z = 9.95, p < 0.001) and middle and end time points (β = 0.66, z = 9.44, p < 0.001). However, no significant cross-lagged paths emerged, suggesting it may not be possible to infer change in one construct is influencing change in the other across time points.
6 Discussion
Results support the two main hypotheses of the current study. First, students had favorable attitudes to Google Sheets, indicating this platform was well received and suggesting Google Sheets may be a viable option for teaching introductory quantitative methods. Second, quantitative self-efficacy significantly related to positive attitudes toward Google Sheets. Additionally, because consistent findings were found in the confirmatory sample across three time points, this suggests robust effects for having favorable Google Sheets attitudes, as well as quantitative self-efficacy being related to attitude toward Google Sheets. Results from the present study, while examining specific attitudes toward using Google Sheets, are consistent with research by Harlow, Burkholder, and Morrow (Citation2002), Pajaras (1996), as well as Ramirez, Schau, and Emmioglu (Citation2012) suggesting a positive association between self-efficacy and positive quantitative attitudes in general.
Current findings could be extended in the future to verify a positive relationship found between quantitative self-efficacy and course performance in college students in other studies (Chemers, Hu, and Garcia Citation2001; Harlow et al. Citation2002; Harlow Citation2013). The favorable attitudes toward Google Sheets also provide further support for using computer technology to engage students in learning (Baker et al. Citation2010; McKnight et al. Citation2016), particularly in quantitative methods courses (Basturk Citation2005; Sosa et al. Citation2011). While the results of this study cannot address some of the bigger debates in the statistics field (i.e., NHST vs. Modeling, teaching multivariate statistics), the results do support the use of Google Sheets as one possible approach to providing the foundational training for students who continue forward into more advanced areas of statistics.
6.1 Considerations for Using Google Sheets
While the results of this study show Google Sheets are a viable option for teaching quantitative methods, instructors should consider both the positives and negatives of using Google Sheets before deciding to incorporate it into their course. Current results show that students appreciate the convenience Google Sheets provides, which is one of the main positive aspects of Google Sheets. Other benefits include the cloud-based storage and lack of cost incurred by the student or institution. Additionally, real-time feedback is possible using the shared files and chat functions. However, these conveniences do come at the cost of some functionality. First, Google Sheets cannot give confidence intervals, effect sizes, or z-scores/t-scores/F-ratios by the use of a built-in function. It is still possible to calculate z-scores, t-scores, and F-ratio values, but instructors would either have to teach this code step by step or provide the code to students. This could be useful for instructors who wish to minimize manual hand calculations in class because students would have to compute each step of the formula instead of writing a single command. By emphasizing what is happening in each step, instructors could reinforce all concepts normally shown during manual hand calculations, but through the use of the Google Sheets remove the anxiety that comes from manual computation (Lukowski et al. Citation2016). Instructors who do not wish to minimize hand calculations, on the other hand, could view this as a disadvantage. Second, Google Sheets functionality does not extend to all statistical tests common in introductory quantitative methods courses, such as single-sample t-tests and chi-squared tests. This could be difficult for instructors to overcome without providing supplementary materials, but it is possible when using existing functions and writing the code step by step. Finally, Google Sheets would be very difficult to use for any multivariate methods due to the lack of advanced functions, so advanced statistics courses may want to choose a different option.
6.2 Limitations
The present study has several limitations. Whereas the data were longitudinal in nature, the sizes for both the pilot (N = 45) and confirmatory (N = 117) samples were too small to do any reliable longitudinal data analysis. Thus, the cross-sectional approach used to analyze the data do not allow for any inference of causality or direction of effects. Additionally, several variables could not be controlled for in the analyses, such as which teaching assistant taught the participants and any previous experiences with quantitative methods. Finally, both samples were not very large or diverse, and were predominantly white and female. Future studies may want to assess this evaluation on larger and more diverse samples.
6.3 Future Directions
This study provides a good first step for evaluating the use of Google Sheets and more research could be done to further validate the use of this program to teach quantitative methods. First, instructors could consider using Google Sheets for in-class application while also teaching more advanced packages such as SPSS or SAS, to see if the dual approach could help students learn in multiple modalities. One approach might be to use Google Sheets during lecture so students can see the code being written real-time by the instructor, essentially replacing any manual computation components by code writing instead. Faculty could also consider sharing the dataset with all students so they can view the code being written right on their screen as well. Meanwhile in lab settings, students could learn a specialized statistical package. Future research may also consider evaluating if learning Google Sheets makes the transition to learning a more advanced statistical package a better experience for the student. Second, because Google Sheets supports the development of third-party applications, some of these applications could be developed to address some of the functionality issues of Google Sheets. One such application already exists, called the XLMiner Analysis ToolPak. This application has a similar function as the Analysis ToolPak in MS Excel, which does give z-scores, t-test scores, and F-ratios. This ToolPak also expands beyond those capabilities into other more advanced statistics, and addresses some of the current concerns with Google Sheets. Third, Google Sheets may be uniquely suited to teaching online courses due to the cloud-based processing and ability to share data sets. Future research should follow-up with these ideas, as well as replicating this study, to further validate the use of Google Sheets in quantitative methods courses.
Appendix Measures of Quantitative Self-Efficacy
Please rate your confidence in the following statements or tasks using the scale below:
1 = Not at all confident
2 = A little bit confident
3 = Undecided
4 = Somewhat confident
5 = Very confident
Balance my checkbook without a mistake.
Read a table, such as what is in the back of math books, to determine an answer.
Read and interpret graphs and charts.
Compute the probability of drawing a jack of diamonds from a full deck of cards.
Do well in math and statistics courses.
Understand the concepts of statistics.
Acknowledgments
Pilot data from only the Fall 2015 semester was presented in a poster at the Northeast Conference for Teachers of Psychology (NECTOP) in October 2016. An earlier version of this manuscript was originally drafted as a written comprehensive exam question for the first author (Z. Kunicki), but all other others made substantial and significant contributions when editing the manuscript worthy of co-authorship. We wish to also thank the anonymous reviewers and associate editor for their feedback which greatly improved the manuscript throughout the peer review process.
Additional information
Funding
Related Research Data
References
- Agresti, A., Franklin, C. A., and Klingenberg, B. (2017), Statistics: The Art and Science of Learning from Data (4th ed.), New York: Pearson.
- Aiken, L. S., West, S. G., Sechrest, L., Reno, R. R., Roediger, H. L., Scarr, S., Kazdin, A. E., and Sherman, S. J. (1990), “Graduate Training in Statistics, Methodology, and Measurement in Psychology: A Survey of PhD Programs in North America,” American Psychologist, 45, 721–734. DOI: 10.1037/0003-066X.45.6.721.
- American Statistical Association (2016), “Guidelines for Assessment and Instruction in Statistics Education (GAISE) College Report 2016.” Available at: https://www.dol.gov/asp/evaluation/resources/ASASTYLE_GUIDE.PDF
- Appelbaum, M., Cooper, H., Kline, R. B., Mayo-Wilson, E., Nezu, A. M., and Rao, S. M. (2018), “Journal Article Reporting Standards for Quantitative Research in Psychology: The APA Publications and Communications Board Task Force Report,” American Psychologist, 73, 3–25. DOI: 10.1037/amp0000191.
- Baker, R. S. J. D., D’Mello, S. K., Rodrigo, M. T., and Graesser, A. C. (2010), “Better to be Frustrated than Bored: The Incidence, Persistence, and Impact of Learners’ Cognitive–Affective States During Interactions with Three Different Computer-Based Learning Environments,” International Journal of Human-Computer Studies, 68, 223–241. DOI: 10.1016/j.ijhcs.2009.12.003.
- Bandura, A. (1986), Social Foundations of Thought and Action, Englewood Cliffs, NJ: Prentice-Hall.
- Bandura, A. (1997), Self-Efficacy: The Exercise of Control, San Francisco, CA: Freeman.
- Basturk, R. (2005), “The Effectiveness of Computer-Assisted Instruction in Teaching Introductory Statistics,” Educational Technology & Society, 8, 170–178.
- Chemers, M. M., Hu, L. T., and Garcia, B. F. (2001), “Academic Self-Efficacy and First Year College Student Performance and Adjustment,” Journal of Educational Psychology, 93, 55–64. DOI: 10.1037//0022-0663.93.1.55.
- Cummings, G. (2011), Understanding the “New” Statistics, New York: Routledge.
- Davis, P. (1997), “What Computer Skills do Employers Expect from Recent Graduates?” THE Journal, 24, 74–78.
- Dunn, D. S. (2000), “Letter Exchanges on Statistics and Research Methods: Writing, Responding, and Learning,” Teaching of Psychology, 27, 128–130. DOI: 10.1207/s15328023top2301_8.
- Garfield, J. (2002), “The Challenge of Developing Statistical Reasoning,” Journal of Statistics Education, 10, 1–12. DOI: 10.1080/10691898.2002.11910676.
- Gold, M. S., and Bentler, P. M. (2000), “Treatments of Missing Data: A Monte Carlo Comparison of RBHDI, Iterative Stochastic Regression Imputation, and Expectation-Maximization,” Structural Equation Modeling: A Multidisciplinary Journal, 7, 319–355. DOI: 10.1207/S15328007SEM0703_1.
- Gravetter, F. J., and Wallnau, L. B. (2017), Essentials of Statistics for the Behavioral Sciences (10th ed.), Belmont, CA: Wadsworth Cengage Learning.
- Harlow, L. L., Burkholder, G., and Morrow, J. (2002), “Evaluating Attitudes, Skill and Performance in a Learning Enhanced Quantitative Methods Course: A Structural Modeling Approach,” Structural Equation Modeling: A Multidisciplinary Journal, 9, 413–430. DOI: 10.1207/S15328007SEM0903_6.
- Harlow, L. L. (2013), “Teaching Quantitative Psychology,” in Oxford Handbook of Quantitative Methods, ed. T. Little, Cary, NC: Oxford University Press, pp. 105–117.
- Harlow, L. L., Korendijk, E., Hamaker, E. L., Hox, J., and Duerr, S. R. (2013), “A Meta-View of Multivariate Statistical Inference Methods in European Psychology Journals,” Multivariate Behavioral Research, 48, 749–774. DOI: 10.1080/00273171.2013.822784.
- Harlow, L. L. (2014), The Essence of Multivariate Thinking: Basic Themes and Methods (2nd ed.), New York: Routledge.
- Harlow, L. L., Mulaik, S. and Steiger, J. (Eds.) (2016), What If There Were No Significance Tests? (Classic ed.), New York: Routledge.
- Hu, L., and Bentler, P. M. (1999), “Cutoff Criteria for Fit Indexes in Covariance Structure Analysis: Conventional Criteria Versus New Alternatives,” Structural Equation Modeling: A Multidisciplinary Journal, 6, 1–55. DOI: 10.1080/10705519909540118.
- Kavanagh, M. H., and Drennan, L. (2008), “What Skills and Attributes Does an Accounting Graduate Need? Evidence from Student Perceptions and Employer Expectations,” Accounting & Finance, 48, 279–300. DOI: 10.1111/j.1467-629X.2007.00245.x.
- Lukowski, S. L., DiTrapani, J., Jeon, M., Wang, Z., Schenker, V. J., Doran, M. M., Hart, S. A., Mazzocco, M. M., Willcutt, E. G., Thompson, L. A., and Petrill, S. A. (2016), “Multidimensionality in the measurement of math-specific anxiety and its relationship with mathematical performance,” Learning and Individual Differences, 70, 228–235. DOI: 10.1016/j.lindif.2016.07.007.
- McKnight, K., O’Malley, K., Ruzic, R., Horsley, M. K., Franey, J. J., and Bassett, K. (2016), “Teaching in a Digital Age: How Educators Use Technology to Improve Student Learning,” Journal of Research on Technology in Education, 48, 194–211. DOI: 10.1080/15391523.2016.1175856.
- Moore, D. S., McCabe, G. P., and Craig, B. A. (2016), Introduction to the Practice of Statistics (2nd ed.), New York: W.H. Freeman.
- Newsom, J. T. (2015), Longitudinal Structural Equation Modeling: A Comprehensive Introduction, New York: Routledge.
- Pajares, F. (1996), “Self-Efficacy Beliefs in Academic Settings,” Review of Educational Research, 66, 543–578. DOI: 10.3102/00346543066004543.
- Prvan, T., Reid, A., and Petocz, P. (2002), “Statistical Laboratories using Minitab, SPSS and Excel: A Practical Comparison,” Teaching Statistics, 24, 68–75. DOI: 10.1111/1467-9639.00089.
- Onwuegbuzie, A. J., and Wilson, V. A. (2003), “Statistics Anxiety: Nature, Etiology, Antecedents, Effects, and Treatments – A Comprehensive Review of the Literature,” Teaching in Higher Education, 8, 195–209. DOI: 10.1080/1356251032000052447.
- Rackliffe, U. R., and Ragland, L. (2016), “Excel in the Accounting Curriculum: Perceptions from Accounting Professors,” Accounting Education, 25, 139–166. DOI: 10.1080/09639284.2015.1126791.
- Ramirez, C., Schau, C., and Emmioglu, E. (2012), “The Importance of Attitudes in Statistics Education,” Statistics Education Research Journal, 11, 57–71.
- Rodgers, J. L. (2010), “The Epistemology of Mathematical and Statistical Modeling: A Quiet Methodological Revolution,” American Psychologist, 65, 1–12. DOI: 10.1037/a0018326.
- Schneider, K. N., Becker, L. L., and Berg, G. G. (2017), “Beyond the Mechanics of Spreadsheets: Using Design Instruction to Address Spreadsheet Errors,” Accounting Education, 26, 127–143. DOI: 10.1080/09639284.2016.1274912.
- Sosa, G. W., Berger, D. E., Saw, A. T., and Mary, J. C. (2011), “Effectiveness of Computer-Assisted Instruction in Statistics: A Meta-Analysis,” Review of Educational Research, 81, 97–128. DOI: 10.3102/0034654310378174.
- Springer, L., Stanne, M. E., and Donovan, S. S. (1999), “Effects of Small-Group Learning on Undergraduates in Science, Mathematics, Engineering, and Technology: A Meta-Analysis,” Review of Educational Research, 69, 21–51. DOI: 10.3102/00346543069001021.
- Steiger, J. H., and Lind, J. C. (1980), “Statistically Based Tests for the Number of Factors,” Paper Presented at the Annual Spring Meeting of the Psychometric Society, May, Iowa City, IA.
- Warner, C. B., and Meehan, A. M. (2001), “Microsoft ExcelTM as a Tool for Teaching Basic Statistics,” Teaching of Psychology, 28, 295–298. DOI: 10.1207/S15328023TOP2804_11.
- Zieffler, A., Garfield, J., Alt, S., Dupuis, D., Holleque, K., and Chang, B. (2008), “What Does Research Suggest About the Teaching and Learning of Introductory Statistics at the College Level? A Review of the Literature,” Journal of Statistics Education, 16, 1–25. DOI: 10.1080/10691898.2008.11889566.