
 ?Mathematical formulae have been encoded as MathML and are displayed in this HTML version using MathJax in order to improve their display. Uncheck the box to turn MathJax off. This feature requires Javascript. Click on a formula to zoom.
Abstract
Over the past 30 years, the way in which the first course in statistics has been taught has moved away from a mathematics mode to take account of the distinctiveness of statistics. This article considers exercises for the typical introductory course and gives some evidence that many of these look like somewhat expanded versions of mathematics course exercises, and are thus less than optimal given the goals of statistics education. The article contends that exercises for statistics courses can be and should be designed with many interrelated questions built around a context to emphasize the connections between the tools used and the context. This type of exercise is termed a guided inquiry exercise (GIE) and it is argued that such exercises are not a new idea, are employed in some teaching materials, and are able to be created by instructors. Some of the implications and challenges for teaching and learning using GIEs are discussed. Teachers of statistics are encouraged to create their own, and advice is given to that end.
1 Introduction
Over ten years ago, De Veaux and Velleman (Citation2008, p. 54) wrote that statistics teaching had become harder in the last 30 years, because “we began to switch from teaching statistics as a mathematics course to teaching the art and craft of statistics as its own discipline.” From simply demanding that students manipulate formulas and calculate, we have begun to ask that students grapple with the links between research questions, study design, conditions for analysis, and interpretation of results in context. Other things have changed as well: we now use more actual rather than concocted data, and we have shifted from pencil and paper calculations to using calculators and computers.
This article considers exercises that students do, and contends that exercises found in textbooks are still too similar to exercises in mathematics courses. What we typically find is a context explained followed by a few questions on statistical ideas, concepts, or calculations for that context. Thus many, perhaps even most, statistics exercises resemble expanded mathematics text exercises. The argument here is that for statistics courses many exercises should consist of relatively longer sequences of interconnected tasks (questions to answer, calculations or pictures to make) focused on a context to stress the interrelatedness inherent in applying statistical ideas to data analysis.
The argument is developed by first clarifying some terminology in Section 2. In Section 3, evidence is presented to support the assertion (stated above) that, with some exceptions, textbook exercises resemble expanded mathematics text exercises. Section 4 expands the argument, showing some background and implications of using longer connected exercises. Then, in Sections 5 and 6, attention turns to the instructor (or perhaps teams of instructors) designing a teaching program. These sections look at some of the features of longer interconnected exercises that need to be considered in constructing and using them, followed with some suggestions on making such “long” exercises. Section 7 concludes by rephrasing the argument. Appendix A gives an example of the sort of exercise being advocated, and Appendix B some details of the data presented.
In this article, the center of attention is primarily on the introductory college level statistics course. The arguments also apply to higher-level courses, but materials written for courses beyond the introductory level appear to use relatively fewer contexts and follow through on these more consistently, thus more closely exhibiting the argument of this article than in the introductory course.
Exercises that are embedded in a context, and with interconnected parts, will be longer than the typical text exercise; there will be more questions or tasks per exercise. However, the length is a by-product of the structure, so that it is the structure that is being commended, and not the sheer length of exercises.
Another formulation of the basic argument can be seen in a “parable” included in the latest GAISE report (2016, p. 13). The story contrasts traditional ways of teaching statistics with current goals for statistics teaching.
In week 1 of the carpentry (statistics) course, we learned to use various kinds of planes (summary statistics). In week 2, we learned to use different kinds of saws (graphs). Then, we learned about using hammers (confidence intervals). Later, we learned about the characteristics of different types of wood (tests). By the end of the course, we had covered many aspects of carpentry (statistics). But I wanted to learn how to build a table (collect and analyze data to answer a question) and I never learned how to do that.
Exercises in texts often resemble the learning activities for planes, saws, hammers, and seldom give the experience of building a table.
2 Exercises, Contexts, Tasks: Definitions
However, what exactly is an exercise? What constitutes a context? What kinds of things should be considered tasks?
Here, an exercise is any collection of tasks intended to give students practice in using concepts or to clarify ideas. Since we will be dealing with exercises in statistics teaching, many exercises will have a context. Typically a context refers to a research question and some data to speak to the research question, though a context can be considered apart from associated data. Moreover, a context may well span many exercises even at different points in a course. Of course, there can be exercises lacking a context, and a single exercise may incorporate more than one context. Most often data provided in exercises are limited in scope and size, and specific to the context. However, students may sometimes be provided with a “rich” dataset that can be used to answer many different questions.
The most basic demand of the student we will call a task. Tasks can be and often are questions to answer, and these intended answers can range from very short “fill in the blanks,” choosing from a list (“multiple choice”), “true or false” (possibly with an added: “give a reason, if false”), to a written answer of a single sentence, a paragraph, or several paragraphs length. Tasks can include calculations using paper and pencil or a calculator as well as software instructions or coding, creating a graphic, by hand or using technology.
3 A Rough Survey of Textbook Exercises
As evidence addressing the assertion that many exercises resemble those found in mathematics texts, data were collected on exercises in selected chapters in 15 textbooks, most of which are intended for the introductory course in statistics. Some employ innovative approaches, some do not, and one is an open source book. For comparison purposes, included were exercises from a calculus text (Stewart Citation2008) as well as statistics text whose first edition was 1952 (Freund Citation1984); these two books are meant as “anchors” to assess the idea that exercises in statistics texts have taken their cue from mathematics texts. In addition, one of the texts is a “second course” text (Kuiper and Sklar Citation2013); this book was chosen because the exercises in it exemplify what is being argued here. Initially the texts chosen were simply part of a collection of publisher-sent texts “for examination.” As it happened, some of the texts were older editions, and so later editions were sought out for the data collection. The sample of texts in no way pretends to be representative of texts being used in statistics teaching, and of course cannot represent materials produced by individual instructors.
Collecting data on exercises enables us to count the number of tasks (or parts, or questions) used per exercise. shows the distributions of the number of tasks per exercise for the texts analyzed.
Fig. 1 Distributions of number of tasks per exercise by text.
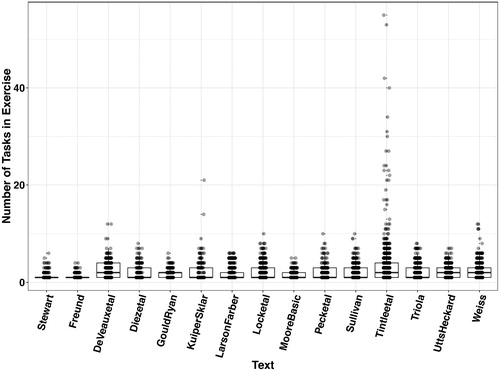
It is evident that fewer than 25% of exercises have more than four parts in most textbooks. What students must be expecting is that, for the most part, an exercise means one or two questions … maybe three or a few more, and that is it. Perhaps the most striking thing about this graph is how different the text by Tintle et al. (Citation2016) is from the others in this regard. Kuiper and Sklar’s (Citation2013) second level text follows a similar pattern.
shows the distributions of number of tasks per context rather than per exercise. Compared with the distributions shown in , there are more questions or tasks per context than per exercise, since the same context can be used for more than one exercise. Still, for many texts, 75% of the contexts have fewer than five tasks. Where there are more tasks for a context, this can happen in a number of ways. In the texts by Kuiper and Sklar (Citation2013) and by Tintle et al. (Citation2016), exercises with many tasks are often embedded in the narrative of the text, called investigations or explorations or activities. Sometimes, “longer” exercises are presented as “mini-projects.” Another way is for the same context to be used in many short exercises scattered through the chapters, where the context is revisited. Sometimes the revisiting is associated with an “odd-even” exercise pattern, a feature also typical of mathematics texts.
Fig. 2 Distributions of number of tasks per context by text.
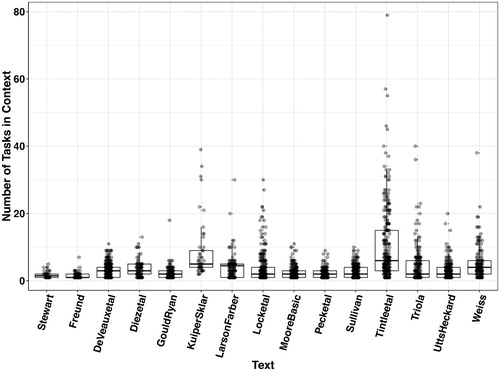
From this simple analysis, we suggest that exercises in statistics texts have generally moved away somewhat from the “mathematics text” model (as seen with Stewart and Freund) to “developing” context, but that much more movement away from that pattern is possible.
4 The Argument Expanded: Background and a Definition
Thinking about exercises and contexts along the lines of the carpentry parable in the GAISE report, it would seem to make more sense for exercises to consist of many interrelated questions or tasks within a context. Whether one is doing an investigation, or evaluating an analysis already done, many things have to be considered at once: the specification of the question, what the data are, the study design employed, the rationale for the analysis, and conditions for the analysis to be valid, as well as the analysis and the interpretation in terms of the original context. The interrelatedness of these many things can be developed and illustrated by having a sequence of questions built around a single context.
These are not really new ideas; see, for example, Chance (Citation2002), or for a brief history, Gould (Citation2010). One immediate response may be that it is simply an argument for projects. At this point, we can build on the comments of Wild and Pfannkuch (Citation1999, p. 224):
The usual panacea for teaching students to think statistically is, with apologies to Marie-Antoinette, “let them do projects.” Although this enables students to experience more of the breadth of statistical activity, experience is not enough. The cornerstone of teaching in any area is the development of a theoretical structure with which to make sense of experience, to learn from it, and to transfer insights to others.
The idea of projects is to introduce students to the investigative process, but often projects lack adequate scaffolding to support learning, which is probably what Wild and Pfannkuch mean by the development of a theoretical structure. The GAISE report (2016, p. 14) speaks in a similar fashion:
We do not advocate one particular conception of the investigative process, nor do we recommend a specific number of stages or steps in this process; we do strongly recommend that instructors emphasize the investigative nature of the field of statistics throughout their introductory course.
The argument here is that scaffolding can be built into the exercises or assignments students do. For statistics, it is natural that the narrative follow the investigative process, but it is not the only story that an exercise narrative can take. The narrative can address considerations of interpretation of analyses already done or the narrative can develop concepts.
On the other hand, the word “exercise” has connotations of repetition and also as preparation for something more important than the exercises themselves. Athletes and musicians have exercises meant to prepare them for a game or a performance, and this preparatory model informs many exercises used in mathematics learning, especially for skill building. Students may see exercises as preparation for tests, and especially if the test questions are promised to be similar to the exercise questions. Seeing exercises as repetitive and as performance preparation raises questions, however. Perhaps there is an inherent conflict between “exercising” in the preparatory sense and the more apprenticeship model of “building a table.” When and where is “exercising” appropriate, and when and where is something more connected and elaborate relevant? How do these two modes relate? Can they be combined? If so, how? To begin to address these questions, we begin with a definition.
Connected longer exercises could be given a number of names and defined in a number of ways, but one that points to the background of the idea is guided inquiry exercise, or GIE.
A GIE can be defined as an extended sequence of tasks (questions or instructions) designed to lead students over a path to understanding ideas or developing expertise, where the steps embody an element of discovery, and scope for collaboration and discussion.
For statistics education, the path is often the process of evaluating and analyzing data in the light of a research question, although GIEs may have the understanding of abstract concepts as their goal as well. So, compared to typical text exercises, GIEs will have a greater variety of questions, have a focus on a research question or context or concept, and they will tend to “tell a story.”
The ideas behind “guided inquiry” or “guided investigations” have been discussed in mathematics and science education using varied language for quite some time. As a fairly recent example, a professional enhancement program for mathematics instructors offered by the MAA in the summer of 2015 was entitled “inquiry-based learning” and was associated with the Academy of Inquiry Based Learning (see http://www.inquirybasedlearning.org/) which has its focus on mathematics. Inquiry based learning in mathematics traces its ideas to the practice of the mathematician R. L. Moore and is sometimes known as a modified Moore method, which emphasizes discovering mathematical ideas through a guided sequence of questions.
GIEs have been used in statistics education. Rossman and Chance’s Workshop Statistics (2011) is an example at the introductory level. Horton (Citation2013) describes a modified Moore-method to teach a course in mathematical statistics. The use of model-eliciting activities (MEAs; see Garfield et al. Citation2010) can be thought of as another instance of using GIEs.
As examples of GIEs, in Kuiper and Sklar, see the exercise about an experiment of the strength of paper towels (2013, p. 57) or in Tintle et al., Exercises 3.3.11–3.3.14 about students’ travel experiences or especially one of the “explorations” (2016, p. 190ff). Appendix C (“Activities, Projects, and Datasets”) of the GAISE report (2016, pp. 43–65) has some good examples.
5 Dimensions of Exercise Use
The rough survey considered exercises in textbooks. What is important is how students and teachers use exercises in the course of learning and teaching; here are some dimensions of usage to consider.
5.1 Number of Tasks per Exercise, Number of Contexts
Given the analysis presented earlier on length of exercises, some natural questions arise. Is there a maximum for the number of tasks, beyond which students tire? Having been accustomed to “short and sweet,” perhaps students will find something longer cumbersome. Or will students accommodate themselves to this format? Is there an optimal range of number of tasks per exercise? Are there devices that should be employed (debriefing, perhaps) so that the point or points of a longer exercise remain clear? Centering interconnected questions on contexts implies possibly fewer contexts for an entire course. Do students need to see hundreds of contexts to be convinced of the applicability of statistics?
5.2 Purpose of Exercises in Learning and Teaching
Mention was made of exercises having a preparatory purpose; in the minds of both teachers and students, this notion may loom large. But different exercises may have different goals, and it may be helpful to address this issue along something like Bloom’s taxonomy. Some exercises have an “alertness” purpose; that is, they serve to sound an alarm for students, and perhaps for instructors, that something may be lacking in knowledge, understanding, or skill that the student has simply overlooked. Consider statistical terminology; many words used in statistics are used in a specific sense even contrary to how terms are used elsewhere, and certainly symbols have a specific meaning. These are explained in the instructional materials provided to students. But have the materials been consulted? This would seem to be an argument for short, even context-free questions; these are also the kind of questions nicely handled by online homework systems, where feedback about common mistakes can be quickly and efficiently given to multiple choice or matching questions. However, such basic alerting questions can have a place in GIEs, in two ways. First, questions about definitions, symbols, or concepts can be contextualized; the student gets a sense of how these differently (and perhaps seemingly weirdly) defined terms are actually used. Second, questions at this basic level are the kinds of things for which GIEs provide an opportunity for spiraling. If many exercises connected with a context open with questions about observational units and variables (identification and types), these concepts are continually revisited. For the middle reaches of something like Bloom’s taxonomy, exercises have the purpose of giving practice in context in applying, analyzing and evaluating concepts. It is here that GIEs would seem to be strong.
The latest GAISE report (2016, pp. 12–15), as a part of the recommendation to teach statistical thinking, specifically cites giving students experience with multivariate thinking. It should be easy to imagine that a GIE structure, especially together with datasets with many variables, can be used to attain this goal.
5.3 Place in Teaching Materials or Course Plans
If the question about purpose is a question about why, then the question about “place” refers to when or possibly how in the sequence of events in a course GIEs are used. GIEs may be embedded in the development of the material being taught, as in some textbooks. Alternately, GIEs may be presented as “extended exercises” or “activities” or “mini-projects” to pull together the concepts and ideas after students have been introduced and worked with concepts and techniques. It is possible to use GIEs that are quite similar for both development of concepts and extended practice. Instructors developing GIEs as materials supplementary to textbook resources have similar choices.
5.4 Collaborative Work, Technology, Class Organization
Choices about when and how GIEs are used may also be connected to the form of teaching, but perhaps not with as close a link as one might first think. A “flipped” classroom would seem to be compatible with using GIEs in the development of material, with students using class time to work through material. One might think that GIEs have a natural affinity with collaborative work. However, it is possible to construct GIEs to be used with either collaborative or individual work, intensive technology use or not, a flipped class or traditional lecture/laboratory organization, or online instruction. The narrative structure of GIEs especially may be especially compatible with online work, where often students work in isolation, or are only connected with other students online. For these purposes, a GIE can be constructed with suggested branches or links at various points, useful for the online student potentially working alone. However, students working together in a classroom can also use such links. Having such links fits in with modern ways of gathering relevant information “just-in-time” to solve a problem.
5.5 Extent of Guidance Within GIEs
Within GIEs, we can think of a continuum on the amount of guidance given to the student for a sequence of questions. On the one end there is detailed guidance with very specific instructions or questions for the student. At the opposite end would be minimal guidance with discovery or inquiry being emphasized. On the maximal guidance end, that guidance need not imply simply telling the student everything to do, since the very detailed instructions can be followed by reflective questions. The maximal inquiry or discovery end of the continuum would emphasize ingenuity, enterprise and perception. At this end of the continuum, guidance is given when asked, but there will be plenty of opportunity for false trails, and the integration of results is left to the student or team of students. GIEs may have varying amount of guidance depending on their placement in the course, or on their subject matter. Even within a single GIE, it may be appropriate for some parts to be very guided (e.g., software instructions) and other parts to be quite open-ended or reflective.
5.6 Testing, Assessment, and GIEs
A common scenario is for tests for students to be similar to exercises; test questions are meant to be different enough from exercises done previously so that rote memorization will not suffice, and yet similar enough so that what is being tested (understanding, skills) is not confounded with other difficulties. One can make tests that are like GIEs, and these have advantages for testing. GIEs build many questions around a single context, rather than presenting many contexts, and hence difficulty in understanding contexts is less likely to be confounded with statistical understanding. One might think that an examination using a GIE structure would be challenging; creating questions about experimental design where the data being used are essentially observational requires ingenuity, as an example. An ideal situation would be to have a research question with various kinds of data speaking to that question. If that is not possible, it does help to have a “rich” dataset sufficiently large with a good diversity of variables, so that the context is something beyond a single “research question plus associated data” but a number of related research questions.
In the revised version of Bloom’s taxonomy, the highest level is designated “create.” A course built around GIEs and probably a number of rich datasets lend itself by extension to using these data sets for creative projects. An extended GIE on the maximal discovery end of the guidance-discovery continuum can also be used as a structured project.
6 Finding or Making a GIE
As pointed out earlier, there are texts built around GIEs. There are also texts and teaching materials that have GIEs, and these can be used as regular assignments or special assignments. An expedient alternative for an instructor (or a department) is to adopt materials that incorporate GIEs. That alternative may not be possible. This article strongly encourages teachers to create their own GIEs. What follows gives advice for such endeavors.
At times, textbook authors use the same data or context through multiple exercises; by putting these together an instructor can make a GIE that gives some sense that the exercises tell a story. Longer exercises that approach a GIE format can be used as they stand or modified. Datasets accompanying exercises, especially those with many variables are especially useful.
There is much to be said for making instructional materials “from scratch” and some would argue that the era of instructors’ relying on a packaged text is passing (see Cobb Citation2013; Utts Citation2013). Producing instructional materials “in-house” for a course has become easier in some ways; it is becoming easier to gather or generate data. Using “fresh” data and exercises developed just for the course being taught gives these exercises a potential immediacy with students. Data from a text may be new and interesting for students, but it is still data that belongs to someone else, or in a book, rather than “something we did.” A “beginning of course questionnaire” is a good example of generated data, where the resulting data on the students taking the course can be compared to data from previous semesters.
How does one go about creating GIEs? Here is some advice, based upon experience:
Use online resources. For example, some of the lesson plans for K-12 use on the Statistics Education Web (https://www.amstat.org/education/stew/) can be useful, though they will require some work on the part of the instructor to implement.
Start with a template of some kind, which may be an existing exercise (GIE or not) and data, either from a text or from some other source, and change or expand it. If one sees an exercise with some interesting data provided, but “underexploited,” that exercise can serve as a good starting point.
Design a logical sequence of questions; these can be based on the investigative process or some other narrative to answer questions about specific issues or misunderstandings that students have. Experience fielding students’ questions in tutoring situations can be very helpful, as can observing groups of students working through understanding concepts. In this sense GIEs self-propagate, in that they give their creator ideas for further ones.
Work hard on the “flow” of the exercise; the sequence of the questions should make some sense in terms of where the analysis is going, or what is natural to be considered next. Aligning the flow of questions to the investigative process is not the only option, but this kind of flow will naturally incorporate statistical reasoning. That the sequence of questions make immediate sense to the student answering them is also good, but this may not always be possible; if not, a phrase such as “why this question is being asked will become clearer as we proceed” may be appropriate.
In a long exercise the later parts may (and often) depend upon making a correct choice to an earlier question or task. It is thus often necessary to give the correct answer to an earlier question in a later question. Some instructors not accustomed to the idea of a GIE may raise objections that the “answer” is “given away.” These instructors may be thinking of a testing situation, and not a learning situation. If GIEs are combined with links to other teaching material providing the “answer,” especially after an incorrect but possibly understandable first idea on the part of a student, wrong but corrected answers can constitute a good learning opportunity.
Leaps from one question to the next should be neither too large nor too small. These concerns are related to the guidance-discovery continuum discussed earlier, and so the leaps may vary depending upon the nature of the material being presented. Parts of a GIE that are tactile or involve software usage may have very small steps; however, these small steps may be combined with reflective questions about how data were obtained, or about other variables, especially toward the end of a GIE (see Wild and Pfannkuch Citation1999, p. 242, who call these “trigger questions”). With a leap that is too great, a thoughtful student should query why the question is being asked. With a leap too small, one may face the comment: “Is that all you want?” However, at times the question may be “obvious” to some students, but not at all to others. A good example of such a question is often one of the first questions to be asked: “What are the cases/individuals/observational units? That small incremental questions will be easy for some students and difficult for others is another good argument for using group work. Most of the “small” questions that arise from students can be worked out by student groups; the difficult questions will need professional help.
Be prepared to tweak one’s efforts. If using a flipped or semi-flipped course structure, instructors or TAs can quickly sense where a question posed is ambiguous or misleading, and then one can usually rewrite the question to improve it. Indeed, one benefit of writing flawed questions and paying attention to students’ efforts is that one gets an insight into how students are thinking.
Questions can expect a numerical answer, a multiple-choice answer, or a free response answer. The first two are easily translated in to an online format, but free response, which must be asked at some point about interpretation, must be marked by a human. One kind of compromise is to precede free-response questions by similar multiple-choice questions to give students ideas of what “good” and “bad” answers are. However, at some point, there should be free-response questions; expressing oneself should be more than choice clicking! One possibility for reducing the amount of instructor marking is to use peer assessment for fairly simple free response questions. Dennis Sun and his associates argue that for homework questions that are short answer questions and not too complicated but which require human grading, peer assessment can be a useful option (see Sun et al. Citation2014; Sun Citation2015).
What are good data for GIEs? The following ideas come from experience.
GIEs can be created for data produced in many ways. The data do have to be understandable to students without specialized technical knowledge that takes time to learn. Having said that, there are obviously exceptions: GIEs can be written and used for courses where the students do have the specialized knowledge (e.g., business students) or where they can pick up the needed understanding. One advantage of GIEs is that if the understanding is a bit of a stretch, the stretch suffices for a good chunk of learning, rather than just one short exercise.
Fairly large datasets
can be useful because samples can be taken, and at times, the data can be regarded as a population. The samples can be random samples or they can be samples of interest. More and more datasets of this sort are available.
Using large datasets provide one possible answer to the problem of making multiple versions of exercises. Random samples can be drawn from a large dataset, although working out the answers and follow-up questions can be time-consuming for the question constructor.
Data generated from student activities, either from games or from data collected as part of the course fill the requirement of “real data with a context and a purpose.” There are now examples of data generated by game playing or data that get recorded on mobile phones. See McNamera and Hansen (Citation2014) or Kuiper and Sturdivant (Citation2015).
For introductory courses, data with a good mix of quantitative and categorical variables are especially useful. The amount of “messiness” left in the data can vary directly as the perceived maturity of the students in the course, and indeed, can vary at different parts of the course. Even for introductory courses, it is well to leave some rather obvious errors and impossibilities in the data at some point.
What of concocted or fabricated data? Fabricated data can be useful if it is clear that the data are not pretending to be real. Data that answer “what if” questions or data that are clearly fantasy but generated to show a point can be useful. An example: “data” on the heights of men and hobbits from the village of Bree could be used to show the inability of boxplots and measures of center to summarize bimodal distributions.
Often, data for exercises in textbooks are specific to a time and place (textbook prices are an example), and at times it is possible to supplement the data that are given with data that are nearer to one’s own students’ experience. A study of hand-held mobile phone usage while driving using observed cell phone usage (not self-reports) in Melbourne, Australia (Taylor et al. Citation2007) can prompt replication of the study on a college campus.
It would be helpful if the statistics education community had something like the JSE Data Archive (http://www.amstat.org/publications/jse/jse\_data\_archive.htm) but expanded to include exercises built around data, somewhat along the lines of the Statistics Education Web (http://www.amstat.org/education/STEW/). One author (Grimshaw Citation2015) suggests that it is important to share not only “Data Details” but also “Teaching Notes.” Like the material in the Statistics Education Web, the exercises, data and ideas have to be accessible to the users. An exercise repository could be designed to include links to already compiled collections and (most importantly) allow for revisions. Instructors using different notation conventions from the exercise writer, or different terminology, will find that an existing exercise will not be useful. Moreover, a user may wish to delete questions, or add questions to the exercise as it is written. These kinds of developments would probably come from the “open source” community using creative commons copyright protocols.
7 Conclusion
There is another way of looking at the argument of this article. Thinking of something like Bloom’s taxonomy, we can hypothesize that educational systems have a tendency to emphasize the lower reaches at the expense of critical assessment and creativity. This has long been recognized; Stein (Citation1987) traced this tendency for mathematics, and De Veaux and Velleman’s (Citation2008) comments cited at the beginning allude to that tendency. Critical thinking and creativity are difficult to teach and assess. The argument here is that a structure of interconnected tasks related to contexts is one way to effectively bring in the critical thinking and the creativity of statistical thinking.
References
- Chance, B. L. (2002), “Components of Statistical Thinking and Implications for Instruction and Assessment,” Journal of Statistics Education, 10, 1–17. DOI: 10.1080/10691898.2002.11910677.
- Cobb, G. (2013), “Comment: Technology and the Future of Statistics Education,” Technology Innovations in Statistics Education, 7. Available at https://escholarship.org/uc/uclastat\_cts\_tise/7/3.
- De Veaux, R., and Velleman, P. (2008), “Math is Music; Statistics is Literature (Or, Why Are There No Six-Year-Old Novelists?),” Amstat News, September, 54–57.
- De Veaux, R. D., Velleman, P. F., and Bock, D. E. (2014), Intro Stats (4th ed.), Boston, MA: Pearson/Addison Wesley.
- Diez, D. M., Barr, C. D., and Çetinkaya-Rundel, M. (2012), OpenIntro Statistics with Randomization and Simulation (1st ed.). Available at https://www.openintro.org/stat/textbook.php.
- Freund, J. (1984), Modern Elementary Statistics (6th ed.), Englewood Cliffs, NJ: Prentice-Hall.
- GAISE College Report ASA Revision Committee (2016), “Guidelines for Assessment and Instruction in Statistics Education College Report 2016,” Available at http://www.amstat.org/education/gaise.
- Garfield, J., delMas, R., and Zieffler, A. (2010), “Developing Tertiary-Level Students’ Statistical Thinking Through the Use of Model-Eliciting Activities,” in Data and Context in Statistics Education: Towards an Evidence Based Society. Proceedings of the Eighth International Conference on Teaching Statistics (ICOTS8, July, 2010), Ljubljiana, Slovenia, ed. C. Reading, Voorberg, The Netherlands: International Statistical Institute. Available at www.stat.auckland.ac.nz/∼iase/publications.php.
- Gould, R. (2010), “Statistics and the Modern Student,” International Statistical Review, 78, 297–315. DOI: 10.1111/j.1751-5823.2010.00117.x.
- Gould, R., and Ryan, C. (2013), Introductory Statistics: Exploring the World through Data, Boston, MA: Pearson.
- Grimshaw, S. D. (2015), “A Framework for Infusing Authentic Data Experiences Within Statistics Courses,” The American Statistician, 69, 307–314. DOI: 10.1080/00031305.2015.1081106.
- Horton, N. J. (2013), “I Hear, I Forget, I Do, I Understand: A Modified Moore-Method Mathematical Statistics Course,” The American Statistician, 67, 219–228. DOI: 10.1080/00031305.2013.849207.
- Kuiper, S., and Sklar, J. (2013), Practicing Statistics: Guided Investigations for the Second Course, Boston, MA: Pearson.
- Kuiper, S., and Sturdivant, R. X. (2015), “Using On-Line Game-Based Simulations to Strengthen Students’ Understanding of Practical Statistical Issues in Real World Data Analysis,” The American Statistician, 69, 354–361. Available at http://web.grinnell.edu/individuals/kuipers/stat2labs/Labs.html. DOI: 10.1080/00031305.2015.1075421.
- Larson, R., and Farber, B. (2015), Elementary Statistics: Picturing the World (6th ed.), Boston, MA: Pearson.
- Lock, R. H., Lock, P. F., Lock Morgan, K., Lock, E. F., and Lock, D. F. (2013), Statistics: Unlocking the Power of Data, Hoboken, NJ: Wiley.
- McNamera, A., and Hansen, M. (2014), “Teaching Data to Teenagers,” in Sustainability in Statistics Education. Proceedings of the Ninth International Conference on Teaching Statistics (ICOTS9, July 2014), Flagstaff, Arizona, USA, eds. K. Makar, B. de Sousa, and R. Gould, Voorburg, The Netherlands: International Statistical Institute.
- Moore, D., Notz, W., and Fligner, M. (2015), The Basic Practice of Statistics (7th ed.), New York: W. H. Freeman and Company.
- Peck, R., Olsen, C., and Devore, J. (2016), Introduction to Statistics and Data Analysis (5th ed.), Boston, MA: Cengage Learning.
- Rossman, A. J., and Chance, B. L. (2011), Workshop Statistics: Discovery With Data (4th ed.), Hoboken, NJ: Wiley.
- Stewart, J. (2008), Calculus, Early Transcendentals (6th ed.), Belmont, CA: Thomson Brooks/Cole.
- Stein, S. K. (1987), “Gresham’s Law: Algorithm Drives Out Thought,” Humanistic Mathematics Network Journal, 7, 1–4. DOI: 10.5642/hmnj.198701.01.04.
- Sullivan, M. (2013), Statistics: Informed Decisions Using Data (4th ed.), Boston, MA: Pearson.
- Sun, D. (2015), “Peer Assessment in the Statistics Classroom,” in Joint Statistical Meetings, August 2015. Available at http://www.amstat.org/meetings/JSM/2015/onlineprogram/ActivityDetails.cfm?SessionID=211681.
- Sun, D., Harris, N., Walter, G., and Baiocchi, M. (2014), “Peer Assessment Enhances Student Learning,” arXiv no. 1410.3853.
- Taylor, D. M., Macbean, C. E., Das, A., and Rosli, R. M. (2007), “Handheld Mobile Telephone Use Among Melbourne Drivers,” Medical Journal of Australia, 187, 432–434. DOI: 10.5694/j.1326-5377.2007.tb01352.x.
- Tintle, N., Chance, B., Cobb, G., Rossman, A., Roy, S., Swanson, T., and VanderStoep, J. (2016), Introduction to Statistical Investigations, Hoboken, NJ: Wiley. Available at http://math.hope.edu.isi.
- Tintle, N., VanderStoep, J., Holmes, V.-L., Quisenberry, B., and Swanson, T. (2011), “Development and Assessment of a Preliminary Randomization-Based Introductory Statistics Curriculum,” Journal of Statistics Education, 19. Available at DOI: 10.1080/10691898.2011.11889599.
- Triola, M. (2014), Elementary Statistics (12th ed.), Boston, MA: Pearson.
- Utts, J. (2013), “Comment: The Future of the Textbook,” Technology Innovations in Statistics Education, 7. Available at http://escholarship.org/uc/item/95x7k28h.
- Utts, J., and Heckard, R. (2015), Mind on Statistics (5th ed.), Stamford, CT: Cengage Learning.
- Weiss, N. (2016), Introductory Statistics (10th ed.), Boston, MA: Pearson.
- Wild, C., and Pfannkuch, M. (1999), “Statistical Thinking in Empirical Enquiry,” International Statistical Review, 67, 223–265. DOI: 10.1111/j.1751-5823.1999.tb00442.x.
Appendix A
GIE Example
One can begin with a research question that one thinks might be of interest to students, and then find data that speak to the question. In this case, however, the genesis was the NHANES dataset available to R users (https://cran.r-project.org/web/packages/NHANES/NHANES.pdf), a “rich” dataset with a large number of categorical and quantitative variables. The analysis presented in the example can be thought of as an instance of the kind of thing students might encounter as consumers of statistical analysis. With the data available, however, there is scope for critical thinking about the analysis as well as for further exploration.
A.1 Marital Status and Depression
Married life can be hard, but then, single life can be too. So do we expect married people, or single people to evidence more signs of depression? And if single, is depression more common with divorced, or separated or widowed or the never married? Or do feelings of depression have very little to do with one’s marital status?
These exercises use the NHANESAdult dataset. Recall that the data can be regarded as a simple random sample of “the non-institutionalized civilian resident population of the United States,” and that the data are from participants in 2009–2010, and 2011–2012 NHANES surveys for those aged 19 or older.
Participants were asked to state the number of days in the previous 30 days they “felt down, depressed, or hopeless.” The response categories were: “None” (= no days), “Several,” “Majority,” and “Almost All.” However, in the dataset, the last two categories appear to have been merged into “Most” (= most days of the past 30 days).
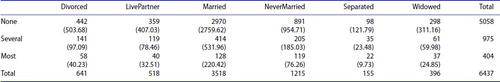
Reading graphical and numerical displays. Figure A.1 shows a visualization of the responses to this question about “Days Depressed” and the Marital Status of the participants, and Figure A.2 shows a contingency table. In both of these displays, those who did not respond to the question have been excluded.
Are the NHANES data from a randomized experiment or from an observational study? Give a reason for your answer.
For understanding Figure A.1: Write a short note as to why the horizontal spaces for the various marital status categories are different. (Why is the “Married” space so wide, and the “Separated” space so narrow? You may find it helpful to refer to Figure A.2.)
State in your own words what appears to be the research question of interest shown by the analyses in Figures A.1 and A.2.
Put into words whether or not the graph and the tables give evidence that most of the NHANES participants reported no days of depression in the last 30 days? Give numerical supporting evidence, either from Figure A.1 or from Figure A.2. (You may have to calculate.)
For which marital status category do people seem to be most free of “depressed days”? For which marital status category do people seem to be least free of “depressed days”? Explain in a sentence or two, supporting your answer with calculations from the numbers in Figure A.2.
In the calculations done in parts d and e, which of the two variables are you regarding as the explanatory variable, and which the response variable? Give a reason for your answer.
Fig. A.1 Marital status and self-reported depression days.
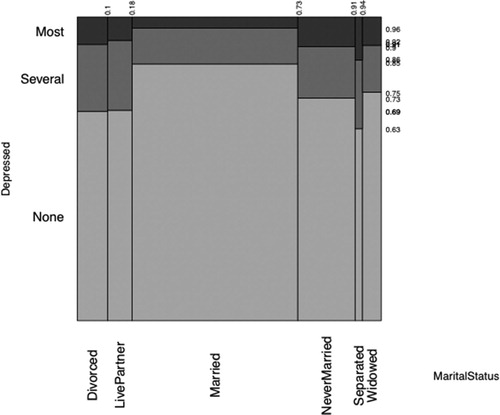
Fig. A.2 Self-reported days depressed by marital status.

Fig. A.3 Self-reported days depressed by marital status (expected counts in parentheses).
Inference using the data. From Exercise 1, you should have come to the conclusion that a majority of the participants reported no days of depression and that married participants had the highest proportion of “none” responses. People in the other marital status categories generally had higher proportions reporting “several” or “most” days depressed. But what is the strength of this evidence? Are the differences that we see in the tables large enough that we are confident that they are real differences in the population, and not just in our random sample? Formal inference is needed to answer these questions.
Identify each of the variables in this analysis as either categorical or quantitative, and state the number of categories for each of the variables.
The inferential technique we shall use for this analysis is a chi-square test for independence. Explain why it would be inappropriate to use a one-proportion z-test or a two-proportion z-test, but why it is appropriate to use a chi-square test.
Write the appropriate null and alternative hypotheses (in words) using the language of association between the explanatory and response variables.
One way of calculating the test statistic for the chi-square test of independence is
Oi refers to the observed count of observational units in the ith cell of the contingency table and Ei refers to the expected count. Using Figure A.3, and the formula for Ei confirm the values for the “None-LivePartner” cell and the “None-Married” cell.
Explain how the expected counts are related to the null hypothesis of the chi-squared test for Independence. (This question may be a tough question to put into words; you may wish to come back to it after answering part f.)
The observed count for the “None-Married” is bigger than the expected count, while the observed count for the “None-LivePartner” cell is less than the expected count. Explain what this means for Days Depressed for the two Marital Status categories. (Your answer could well start with something like: “Married respondents were more likely …”)
Explain briefly how you know that the conditions for using the chi-square test are met.
Use [the technology the course is using] to carry out the chi-square test. Get the p-value to determine whether the test is statistically significant? State what the outcome means in terms of the association between Self-Reported Days Depressed and Marital Status.
Use [the technology the course is using] to get the contribution each cell makes to the chi-square test statistic total. Do these numbers agree with what you see from the visualization in Figure A.1? Explain.
Reflecting on what we have learned from these exercises.
Is there evidence that married people are less depressed than divorced, people living with a partner, people never married, separate or widowed? Does this evidence withstand the challenge that our chi-square test puts to it? What other challenges besides the chi-square test would you put to the evidence? Discuss. (These are good questions for discussion with a group.)
What other variables would you like to analyze in a similar way? That is, think of what would happen if you did the same analysis but with subsets of the data. What variables would you consider? If your technology is easy to use, you may want to use it to “run more tests.”
One of the variables you may have come up with in your answer to part b is age. The age distributions of the people in the categories of Marital Status are unlikely to be the same. Use technology to get visualizations and numerical summaries of the age distributions. Which marital statuses have the most comparable age distributions?
In some of our calculations, we have been treating Marital Status as the explanatory variable, and Days Depressed as the Response variable. Can we conclude that being married therefore causes, or leads reporting fewer days of depression? Explain.
Discuss whether the calculations in the chi-square test for independence treats one variable as the explanatory variable, and the other as the response variable or not.
Appendix B
Methods in the Survey of Texts
The basic unit of analysis for the data collection on exercises was the task (or question) asked of the student. Each task is embedded in an exercise, which is given a unique number, and also within a context, which is also given a unique number where a context was used. For the calculus text, the chapter chosen was the chapter on applications of integration, thought to be one of the closest to what would be found in a statistics text. In the second level text, Kuiper and Sklar (Citation2013) two chapters were chosen at random. In the remaining texts, the chapters on basic inferential techniques were chosen.
For data collection at the level of task, many variables were measured that are not analyzed in this article.
For data collection at the level of exercise:
Each task was recorded as a subpart (or at times, a subsubpart) of a unique exercise, as that was defined in the text. This enables the “length” of exercises to be assessed, but it also involved a certain amount of judgment in collecting the data. For example, some authors specify a multistep sequence of steps or questions to be done, so that what appears at first to be one “question” actually involves many.
Texts sometimes divide exercises into categories, indicating that an exercise is “preliminary” or “basic,” or that it is an “activity,” or that it covers optional material, or that it is a review exercise. These distinctions were recorded though not used in this article.
For the data collection for contexts, the context was identified for every task, with each context a unique number so as to track the same context use in the text. A code was also reserved for exercises without a context. For each context, many variables were measured not analyzed in this article.
Fifteen texts were analyzed: De Veaux et al. (Citation2014), Diez et al. (Citation2012), Freund (Citation1984), Gould and Ryan (Citation2013), Kuiper and Sklar (Citation2013), Larson and Farber (Citation2015), Lock et al. (Citation2013), Moore et al. (Citation2015), Peck et al. (Citation2016), Stewart (Citation2008), Sullivan (Citation2013), Tintle et al. (Citation2016), Triola (Citation2014), Utts and Heckard (Citation2015), and Weiss (2016). The “size” of the dataset includes over 14,000 tasks (or “questions”) and over 6000 exercises and 2000 contexts.