
 ?Mathematical formulae have been encoded as MathML and are displayed in this HTML version using MathJax in order to improve their display. Uncheck the box to turn MathJax off. This feature requires Javascript. Click on a formula to zoom.
Abstract
Instructors of postsecondary classes in statistics rely heavily on visuals in their teaching, both within the classroom and in resources like textbooks, handouts, and software, but this information is often inaccessible to students who are blind or visually impaired (BVI). The unique challenges involved in adapting both pedagogy and course materials to accommodate a BVI student may provoke anxiety among instructors teaching a BVI student for the first time, and instructors may end up feeling unprepared or “reinventing the wheel.” We discuss a wide variety of accommodations inside and outside of the classroom grounded in the empirical literature on cognition and learning and informed by our own experience teaching a blind student in an introductory statistics course.
1 Introduction
Classroom instruction in statistics generally involves a heavy reliance on visually presented information. This can involve the instructor talking and gesturing while writing or drawing on a white board (the so-called “chalk and talk”) but often also includes displaying slides or handouts with graphs, diagrams, equations, or data. More recently, this is likely to include animations, interactive applets, and other dynamic visualization tools to demonstrate concepts such as sampling distributions and bootstrapping. Indeed, visualization has become a standard tool for learning many important statistical concepts such as multivariate thinking (Wong and Bergeron Citation1994; Nolan and Perrett Citation2016; Wang, Rush, and Horton Citation2017). Creating and interpreting graphical displays is listed as one of the nine central goals for introductory statistics in the Guidelines for Assessment and Instruction in Statistics Education (GAISE) College Report (2016). Without appropriate accommodations to access this information and build fundamental statistical skills, blind or visually impaired (BVI) students may be left behind and not receive the same educational opportunities as their peers in those classes (Jones et al. Citation2006; Bell and Silverman Citation2019). Due in part to such access barriers, BVI students tend to lag behind their peers in math at the elementary and secondary level and have traditionally been underrepresented in science and math fields at the postsecondary level (Kapperman Citation1974; Blackorby et al. Citation2003; Hasper et al. Citation2015). Research asking BVI students about their experience report that many teachers “failed to provide instructions in classes in a way that included students with [visual impairments]. Often this was the case because teachers did not adapt classroom instructions, or neglected to provide them with accessible resources” (Whitburn Citation2014, p. 149). Teachers may recognize the importance of providing accommodations but not know how to do so (Hawley, Cardoso, and McMahon Citation2013).
In this article, we will discuss many of the challenges of teaching statistics to BVI students and explore a variety of proposed accommodations grounded in the empirical literature and informed by research in educational and cognitive psychology. We specifically highlight issues of teaching statistics to BVI students at the postsecondary level, including our own experience teaching a blind student in an introductory-level statistics course at a public university. The number of students taking statistics in college has increased greatly in recent years (GAISE 2016), which means the number of BVI students in statistics classrooms will likely continue to rise. We begin with a discussion of some differences in learning, development, and cognition between BVI and sighted students which in turn highlight the need for thoughtful accommodation inside the classroom. However, accommodation inside the classroom may not be sufficient to provide BVI students with the same opportunities as sighted students, so we then discuss a variety of important accommodations to consider outside of the classroom, including tactile learning aids and digital tools; many of these accommodations may be beneficial for the comprehension of sighted students as well (Moon et al. Citation2012).
Instructors may feel unprepared for or personally distressed by the challenges faced by BVI students in their classrooms (Slee Citation2011; Godfrey and Loots Citation2015). We hope that this article will be valuable for instructors who find themselves teaching BVI students, who want empirically based guidance and ideas, and who want to avoid reinventing the wheel. While some of these suggestions may require significant time investment by the instructor (or a teaching assistant or peer tutor), many are easy, quick accommodations that can make a large impact for the student’s learning. When instructors appropriately adapt their pedagogy and resources to BVI student needs, BVI students are able to learn autonomously, something these students report as being important to them (Whitburn Citation2014). As Godfrey and Loots (Citation2015) point out, BVI students should come out of their courses with the same educational outcomes as all other students, even when the means to achieve those outcomes may differ.
2 Accommodation in the Classroom
2.1 Instructor Behavior
Instructors teaching mathematical topics tend to gesture and gesticulate within space while they verbalize explanations, in a way that a BVI student may not be able to follow (Quek and McNeill Citation2006). Both sighted and blind people gesture while speaking and meaningful gestures while explaining the solution to a math problem have been shown to improve working memory performance for the speaker (reducing cognitive load) in addition to providing useful information to sighted listeners (Goldin-Meadow et al. Citation2001; Cook, Yip, and Goldin-Meadow Citation2012). Unfortunately, BVI students cannot access that gestural information.
There are some things instructors of BVI students can do to partially alleviate these problems. For one, instructors can verbally describe graphs and diagrams that are shown on their slides or drawn on the whiteboard (blind students report in interviews that this is helpful; Whitburn Citation2014). Instead of using deictic references (“as you can see HERE,” “what does THIS line tell us?”), be explicit about what is shown and how it is interpreted; as a side-effect you may help sighted students better interpret graphs and diagrams (Godfrey and Loots Citation2015). One statistics instructor teaching a blind student described keeping hands in pocket while teaching until gesturing became less habitual (Erhardt and Shuman Citation2015). Beware over-reliance on verbal descriptions that presuppose holistic visual processing, for example, “rise over run” for the slope of a graph in relation to the axes (Dick and Kubiak Citation1997). When describing concepts through the use of everyday objects, choose objects that a BVI student is able to access readily; for example, items that students are likely to have explored previously (e.g., hardware, toys, utensils) will be more meaningful than large or remote objects (e.g., airplanes, elephants, clouds) (Sticken and Kapperman Citation1998). As one student interviewed by Whitburn (Citation2014) said of instructors: “Sometimes they have to think outside the box on how they’re going to teach me. ‘Cause they can’t just draw a diagram and go ‘here’ and point and whatever” (p. 153).
Furthermore, verbalizing equations can produce problematic ambiguities. For example, verbalizing the sample standard deviation as “the square root of the sum of squares over n minus one” might be misinterpreted as (SS)/(
) or even ((
SS)/
rather than
(SS/(
)). Likewise, for calculating a simple least-squares regression equation, verbalizing the numerator of the equation for the slope as “n times the sum of x times y minus the sum of x times the sum of y” may easily be mistakenly interpreted as (
or any number of other incorrect variations. Godfrey and Loots (Citation2015) give the example of an instructor ambiguously saying “x minus mu over sigma” instead of the less ambiguous “x minus mu all over sigma”. Dick and Kubiak (Citation1997) give another example: for the expression (
, saying “x plus 3 squared” may be mistakenly interpreted by the BVI student as
(i.e., x + 9); it would be preferable to verbalize the equation as “the quantity x plus 3 [pause] squared.” In other words, equations should be read aloud with a mathematical interpretation, not literally character by character; once again, this may have the additional benefit of also helping sighted students improve in interpreting equations. For tips on wording mathematical problems in a way that avoids ambiguity, the Handbook of Spoken Mathematics may be a useful guide (Chang, White, and Abrahamson Citation1983; Kapperman, Heinze, and Sticken Citation1997; also see Fitzpatrick Citation2006).
However, for long and complicated equations (as found in even an introductory statistics course), this may become challenging or nearly impossible without significantly taxing the working memory of a BVI student. Sighted students can take in a long, complicated equation holistically in a way that a BVI student receiving the information linearly and sequentially may find challenging. Likewise, examples and practice problems presenting large sets of numbers (even if the entire problem is verbalized clearly) may make comprehension more challenging for a BVI student compared to a sighted student who does not have to keep the entire list of numbers in working memory but can refer back to the data visually with ease. It may be helpful to provide some examples for each concept that use a small set of numbers that can thus be kept in working memory more easily. Especially for assessments, instructors may want to design problems with the smallest datasets necessary to assess the concept; hand calculations involving unnecessarily long sets of numbers may increase the chance of error more for BVI students than sighted students. (As discussed below, this working memory problem with larger datasets is minimized when working with statistical software where, with the right software and accommodations, BVI students can be on more even footing with their peers.)
2.2 Offloading Working Memory
Of course, numbers and calculations need not be stored “in the head” (in working memory) all at once, especially for a complicated problem. Sighted students can easily write down information given in a word problem, equations or formulas to be filled in, and intermediate calculations; writing information down offloads storage onto the environment for quick and easy reference, which in turn may free up working memory resources for solving complicated problems (Eskritt, Lee, and Donald Citation2001; Risko and Gilbert Citation2016).
BVI students may need alternative solutions to accomplish the same offloading that sighted students do using writing. Commonly, a BVI student may use a computer text editor to store and refer to numbers from a word problem, equations, intermediate calculations, and other items; this allows for nearly unlimited storage and can be searched electronically in an efficient manner. In some cases, the interface to such a computer may use Braille (e.g., Braille notetaker keyboard for input and/or refreshable Braille display for output). In other cases, the student may use a standard laptop or tablet, in which case input can come from touch-typing on a keyboard or from voice recognition software (though the latter may not be feasible within the classroom), while the output is most likely to be auditory using text-to-speech software (though some low vision students may be able to access visuals with magnification software). Most BVI students at the college level today will use a text-to-speech program (commonly known as a screen reader) on computers and mobile devices. According to a large survey of screen reader users (WebAIM Citation2015), the most commonly used include Job Access With Speech (JAWS; Freedom Scientific), NonVisual Desktop Access (NVDA; NV Access), VoiceOver (Apple), and ZoomText (Ai Squared). Thus, accessible accommodation may require that a BVI student have in-class access to a laptop, tablet, or other computing device even if other students are not allowed these devices in class.
Digital learning aids on a mobile device can be very helpful for BVI students. For example, a blind student in our introductory statistics class used her laptop in class to follow along with the slides using screen reader software and an earbud in one ear. Thus, she could access her notes, refer to a formula sheet, or read words on the slides that were not verbalized directly, while still following along with the instructor’s speaking. A mobile device like a laptop allows in-class access to a text editor not only for temporarily storing numbers but also for taking notes and following along with course material. Finally, while huge lists of numbers—for example, statistical tables—are becoming less common in the introductory statistics classroom, if they are used an instructor should realize that translating to a tactile medium like Braille may require materials that are prohibitively large or immobile. Statistical software or even a simple Excel function serving the same purpose can make traditional tables easily accessible for a BVI student.
Likewise, while calculators are no longer central to introductory statistics courses (GAISE 2016), if sighted students in the classroom are using calculators during instruction, practice, or even exams, then BVI students should have access to the same tools. While talking calculators are one specialized solution that may be necessary for limiting internet access during an exam, mobile devices like smart phones, tablets, and laptops generally include a virtual calculator program with integrated audio that can be used with an earbud to avoid the sound disrupting other students. For early blind individuals, utilizing the auditory medium through digital technology may also fit best with how they naturally remember and manipulate numbers mentally; congenitally blind individuals have been shown to rely more on auditory working memory than sighted individuals when manipulating numbers (Raz et al. Citation2007; Crollen et al., Citation2011).
2.3 Working with Peers
Educational best practices include having students work together with their peers. For example, the GAISE College Report 2016 recommends this especially for large classes. This is not only pedagogically valuable but increasingly an important skill for future employment (Riebe, Girardi, and Whitsed Citation2016). A sighted peer working with a BVI student may be able to verbalize components of a problem and the students can learn from each other (Hasper et al. Citation2015). Likewise, for any hands-on demonstrations, sighted students might verbally describe what is happening while the blind student goes through the actions of the demonstration (Sahin and Yorek Citation2009; cf. Bell and Silverman Citation2019). BVI and sighted students can learn well working together (e.g., Pritchard and Lamb Citation2012), but the instructor may want to check in during group work to ensure smooth communication and collaboration between the students. Additionally, it is important that accessible learning materials are adequate and available so that BVI and sighted students can work together effectively (Whitburn Citation2014).
Unfortunately, depending on the specifics of the course and how the instructor teaches within the classroom, the above suggestions by themselves may not be sufficient to provide a BVI student with the same level of instruction that sighted students receive. Thus, significant accommodation outside of the classroom may be necessary.
3 Accommodation Outside of the Classroom
3.1 Textbooks and Slides
Some preexisting Braille textbooks exist for statistical content; for example, one accessibility resource lists Braille versions of more than a dozen statistics textbooks (AMAC Braille Library Citation2017), though these may not match the textbook used in a given course. Even if the course’s textbook is available in Braille, many of those Braille versions are for old editions that may be quite out-of-date (a significant issue since books with mathematical content often change or renumber practice problems across different editions), and it may be more likely these days to find an up-to-date edition of the textbook in an electronic version that is compatible with a screen reader program. Many textbook publishers now offer digital versions of recent textbooks and text-to-speech programs typically work well for listening to the digital version of a textbook. However, sometimes a digital version may not be directly available; in that case the campus educational access center can work with the student to get one from the publisher or possibly have the textbook digitized with scanning hardware and optical character recognition software. Instructors should take care to adopt accessible materials whenever possible, and when that is not possible, instructors should plan ahead and communicate with the student and educational access center as soon as possible to find an accessible solution. Even then, a digital textbook may not work perfectly with a screen reader: our student found that Greek symbols were read aloud as “edit field” instead of the symbol. Some statistical and STEM textbooks are typeset in a markup language like LaTeX—which is generally accessible to screen readers and Braille readers once learned—and publishers may be able to provide a LaTeX file that is more accessible than the default format of their digital textbook. Of course, LaTeX has a learning curve for the student, so it may not be the ideal solution for a student only planning to take an introductory statistics course. Some initial work has been done on designing synthetic speech (like that of screen readers) to verbalize mathematical content in a clear and unambiguous way (see Murphy, Bates, and Fitzpatrick Citation2010 for a summary), but that aspect of the technology is not yet mature.
Just as important to consider are commonly used digital materials like PowerPoint slides. BVI students report valuing teachers who provide learning materials such as slides and worksheets in their preferred accessible formats in a timely manner (Whitburn Citation2014). Many instructors may be unaware of some simple steps for designing more accessible PowerPoint files that interact well with a screen reader. For example, including titles on slides provides heading structure for screen reader users; the title pane can even be made invisible to sighted users while still existing “behind the scenes” in the file for screen readers. Another helpful tip is to check Outline View in PowerPoint to check reading order and look for text that shows up on the screen but not in the outline. In PowerPoint, choosing Arrange and then Selection Panel will list all panels on each slide and let you adjust the order in which a screen reader will present text so that it is spoken in the intended order (note: panels will be read beginning with the bottom list item and continuing to the top item).
Additionally, any pictures used in a slide should have alternative text (“Alt Text”) entered within the file to allow a screen reader to convey the basic meaning or purpose of the picture: in PowerPoint, users can right click an image and select Format Picture, then choose Alt Text to fill in a description of the image (and a similar process allows Alt Text for tables, charts, and other elements laid out visually on a slide). Furthermore, on each slide itself, ensure that color and formatting like bold or italics are not the only way important information is conveyed. PowerPoint also includes an Accessibility Checker tool which can help identify slides that need additional work to be accessible.
3.2 Handouts and Braille
Braille versions of handouts can be created more easily than an entire textbook, though this takes sufficient planning and time to have the resources ready for their use in class. Braille embossers are special printers for outputting Braille (often on thicker paper) and if one is not available on campus, instructors may be able to access one through a government agency that can provide translation service themselves or coordinate the process through volunteers or projects with public and private agencies. The educational access center on campus may already have contacts to take care of this for an instructor, but this coordination of multiple groups highlights the need to prepare Braille materials ahead of time. If the student has a Braille reader (a refreshable electro-mechanical Braille display) then printing may not be necessary, and automated translation may be possible; instructors should plan to coordinate early (and often) with the student to find what works best.
Of course, much of the content in statistics involves equations of varying complexity, and standard Braille may not work well for that. Thankfully, there are Braille codes that can be learned to encode mathematical and scientific notation in Braille (AAWB-AEVH-NBA Advisory Council to the Braille Authority Citation1972; Archambault Citation2019). Unfortunately, not every BVI student is fluent in Braille, let alone mathematical Braille. Fewer than 10% of legally blind people in the United States were Braille readers as of 1996 (American Federation for the Blind Citation1996). This may partly be shaped by changing technology, but a significant factor seems to be negative social attitudes toward teaching Braille, especially for the roughly 85% of legally blind children who have some residual vision (Holbrook and Koenig Citation1992). This is unfortunate since there is a significant positive correlation between Braille literacy and life satisfaction, self-esteem, and rate of employment (Silverman and Bell Citation2018), but using Braille versions of printed course materials is by no means a sufficient solution for all or even most BVI students. Instead, a markup language like LaTeX can be used for typesetting mathematical writing using ASCII characters that are readable not just in standard Braille but also by screen reader programs, as we describe below. Erhardt and Shuman (Citation2015) even describe a student synching up her tactile Braille reader display with an auditory screen reader program to simultaneously read and hear a LaTeX document with statistical content (see Godfrey Citation2012 and Godfrey, Murrell, and Sorge Citation2018 for a discussion of developing software options to automate and ease the creation of mathematical and scientific documents by and for BVI users).
3.3 Static Visuals and Tactile Graphics
Handouts, slides, textbook pages, and instructor work on the blackboard may all involve visuals that require accommodation to be accessible. For example, in visual graphics color is often used to display additional dimensions of data and thus help students develop multivariate thinking (GAISE 2016), but to make these displays accessible to BVI students, color—like other visual qualities—must be translated to another modality. In some cases, raised-line drawings can use texture to convey information previously represented in color (see Section 4 for detailed information about converting static visuals to tactile graphics), but in other cases density of information or limitations of tactile acuity mean this may not be an ideal solution (likewise, statistical software often uses three-dimensional graphics for visualizing multivariate data—for example, Le, Josse, and Husson Citation2008; Kassambara and Mundt Citation2017—and two-dimensional raised-line drawings will not necessarily capture this information well).
3.4 Statistical Software
While use of statistical tables is much less common today than in traditional introductory statistics courses (and thus the problems with digitizing these tables may be less relevant), large and realistic datasets are becoming central to the modern statistical classroom (Recommendation 3, GAISE 2016). Instructors should keep BVI students in mind when assigning datasets that require significant managing or cleaning up of a dense spreadsheet of many numbers; it can be incredibly challenging to use a screen reader to efficiently and accurately navigate such a spreadsheet, where most of the numbers are far from row and column headings (or, alternately, where every cell clicked through means listening to the row and column labels in addition to the content, adding extra burden to working memory). For the sighted reader, imagine a spreadsheet program where you can only see the cell you are currently selecting, and have the nearly impossible task of comparing that cell to nearby cells you saw recently but are currently invisible, all while being unable to see what row or column you are currently on and unable to glance back at the row and column labels without losing your place and starting over.
Statistical software like R, SAS, Minitab, and SPSS vary in the level of accessibility support they provide, and this is an important consideration when selecting technology tools for education (GAISE 2016). For example, Minitab has historically used dialog boxes that interact poorly with screen readers, and SPSS may only work smoothly with JAWS but not other screen readers (Godfrey and Loots Citation2015). Instructors using proprietary software will likely need to spend extra time ensuring that assignments involving statistical software are accessible with the tools available to their BVI students. Even if students in an introductory statistics course do not use software extensively themselves, modern guidelines for statistics education emphasize they should at least be exposed to interpreting statistical output from such programs (GAISE 2016). Instructors should avoid using screenshots of output and instead ensure it is accessible with a screen reader. Certainly in more advanced classes, instructors will need to consider the accessibility of markup languages like LaTeX, MathML, and HTML for display of output (Godfrey Citation2012; Erhardt and Shuman Citation2015).
Godfrey and colleagues have compared statistical software packages and in general R has been the most promising for BVI users (Godfrey Citation2013; Godfrey and Erhardt Citation2014; Godfrey and Loots Citation2014; Godfrey Citation2016a). Erhardt and Shuman (Citation2015) concur and describe their experience using R with a blind student taking a second year statistics course. For BVI students looking to learn R, an electronic textbook by Godfrey (Citation2016b) is a great start. While the learning curve of R may be larger than proprietary software like Minitab or SPSS for sighted instructors—especially for an instructor who has not taught BVI students previously—there are great community resources like the BlindMath and Blind R Users Group E-mail lists hosted by the National Federation of the Blind.
R Markdown is a tool that allows a student to include R code and commentary alongside statistical output (including graphics) and ‘knit’ it together to produce a document (e.g., for course submission). The BrailleR package (see below) includes an application called WriteR which is a small and simple tool for converting R Markdown into accessible HTML output (Godfrey Citation2016c, Citation2018; Godfrey Citation2019; Godfrey and Curtis Citation2016). A statistics teacher using R could use RStudio to send BVI students R Markdown and HTML output from it. Producing HTML output from R Markdown is more accessible than producing a Word document or PDF, the latter of which cannot currently display equations accessibly.
3.5 Creating and Interpreting Graphical Displays
One important function of software in statistics education is to create and interpret graphical displays. This is one of the nine central goals for introductory statistics in the GAISE College Report (2016). As those guidelines point out, software can facilitate visualization of large, realistic datasets to stimulate insight and curiosity. While there has been some progress in making graphical output from proprietary statistical software accessible, at this time R may still be the most promising software for making graphics accessible. Among other benefits, it offers users much more access than other programs to the intermediate information that it uses to construct graphs (Godfrey Citation2013). As a free, open-source software environment with an extensive community of developers, R also offers extensions that can be useful to BVI users. BrailleR in particular is a package that helps make the graphical content of R accessible to BVI users (e.g., through text descriptions and convenience functions) and has functions to optimize printing R graphics on an embosser by turning a graph into a scalable vector graphic or similar file type (Godfrey Citation2018; Godfrey, Murrell, and Sorge Citation2018). Godfrey and Murrell (Citation2016) describe the use of BrailleR to produce tactile images in a fairly automated way; with this software, a BVI user can experience a graph through specialized hardware (e.g., IVEO from ViewPlus Inc. combines tactile and auditory information to help a user understand tactile graphics) or via an embossing printer (where BrailleR replaces print text with Braille text). Also see Watanabe et al. (Citation2016) for other work in progress for automatically generating tactile graphics from R software. More recent work is being done to automate the use of R to compute rich semantics for graphics to make them accessible on the web through screen readers to allow interactive probing, exploration, and querying (Fitzpatrick, Godfrey, and Sorge Citation2017); however, as the authors point out, it remains to be seen if this is the ideal way to explore all two-dimensional graphs or if additional strategies are needed for BVI users to navigate some graphical content. Godfrey, Murrell, and Sorge (Citation2018) provide an accessible workflow using BrailleR and the DIAGcess Javascript library to annotate SVG graphics with an XML structure that can textually describe a diagram with hierarchical graph structure (top level summary, major components, and individual components), allowing BVI users to create and interactively inspect accessible diagrams using simple commands. Their work includes promising initial feedback from users, though additional tactics (refreshable Braille displays, sonification) to convey spatial relationships may be helpful for future developments (Godfrey, Murrell, and Sorge Citation2018).
3.6 One-on-One Time
Given the challenges and limitations of teaching in a fully accessible manner within the classroom, significant one-on-one time outside of class may be helpful or necessary (Schluchter Citation2018). In our case, the statistics instructor met with a blind student weekly and was told it helped immensely. Erhardt and Shuman (Citation2015) describe doing the same thing for a blind student in a second-year statistics course. BVI students interviewed by Whitburn (Citation2014) reported that one way to increase their sense of inclusion at school is for the instructor to be approachable outside of the classroom for individual consultations. Another solution may be to recruit a TA, peer mentor, or graduate assistant (if available) to work with the student in a dedicated manner. For example, Spindler (Citation2006) describes a tutor helping a student of calculus who was blind. While the original concept was for the tutor to act as a sort of living piece of paper (reading back a problem the way a sighted student may glance back up to reread a problem), the author emphasizes that the tutoring was only effective in the long run because the student and that same tutor built a channel of effective communication by being involved in the learning process many times and discovering the best ways to understand each other. Some authors have suggested that it may be appropriate to administer exams orally (Dick and Kubiak Citation1997; Sticken and Kapperman Citation1998); if so Spindler (Citation2006) suggests this is best accomplished by someone who has worked closely with the BVI student during learning and practice.
One reason that this one-on-one time may be necessary outside of class comes from the limitations of how concepts are explained within the classroom (e.g., referencing visuals and using gestures). When those limitations cannot be fully mitigated or changed within the classroom, then meeting outside of the classroom may be necessary to provide alternative or supplementary explanations for concepts (in ways that do not implicitly or explicitly reference visuals), and to provide access to tactile, auditory, or digital learning aids (which may not be feasible to utilize or reference directly within a class where most students are sighted).
3.7 Online/Digital Homework Systems
Another reason one-on-one time outside of class may be essential is that often courses in statistics use online homework systems with immediate and dynamic feedback. These systems add pedagogical value not available with traditional delayed-feedback homework, enhance student engagement and achievement, and specifically have been shown to help students learn college-level statistics, calculus and other introductory-level mathematics better than traditional homework (Butler and Zerr Citation2005; Zerr Citation2007; Brewer Citation2010; Lunsford and Pendergrass Citation2016). Unfortunately, these online systems may offer little or incomplete accessibility to visually impaired students. For example, the online homework interface may refer to graphs that cannot be seen (and at best may be described incompletely in words readable by a screen reader program), extensive tables that are hard to navigate non-visually, or interfaces that don’t work well with a screen reader. While providers of these systems need to work to improve accessibility, an instructor adopting such a system must be ready to provide accommodations to make up for the system’s limitations. The same can be said for use of interactive applets on the web or from the textbook publisher.
In our case, the student tried the online homework system used by other students and found it unworkable, so the instructor or TA walked through the same (or similar) homework problems in a one-on-one meeting where the student could ask questions and direct the process, but not run into barriers of software accessibility. This did require a fair amount of preparation on the part of the instructor to adjust homework problems into an accessible format without changing the difficulty level of the problems.
Furthermore, since other students using an online platform often receive instantaneous feedback from the system during their homework, a one-on-one meeting may be the only way to provide equivalent formative assessment to a visually impaired student (barring significant progress in online system accessibility). Simply translating problems into a format that can be read by a screen reader will not provide the same level of interactivity and feedback that modern online homework systems do. One intermediate solution that we tried occasionally was a near-synchronous online discussion between student and professor while she worked on a digital document of homework problems (emailing questions as needed while the professor remained at a computer available to respond, clarify, and provide immediate and interactive feedback).
3.8 Formula Sheets
Formula sheets can be converted to tactile versions if the student is comfortable with mathematical Braille and if the instructor can find someone to translate the materials. Alternately or additionally (we did both), a digital file that is screen reader friendly may be ideal for providing formulas during learning and during exams.
Unfortunately, long, complicated equations involving nested parentheses, subscripts, exponents, square roots, fractions, and so on may either be botched by a screen reader completely (e.g., not mentioning subscripts or superscripts), read in an ambiguous manner, or simply be too much to keep in auditory working memory. For example, to calculate the standard error for an independent t-test, students may plug the appropriate values into the equation /
, and this is after calculating the pooled variance
as (
. A screen reader might read this as “s open parentheses M 1 dash M 2 close parentheses equals square root open parentheses
2 slash n 1 plus
2 slash n 2 close parentheses,” which is both ambiguous and a lot to hold in memory.
We found that the best solution was to write out the formula and then describe it in plain English below that within a text file that served as the formula sheet for the student. In our case, it seemed to help to break long formulas up into labeled subcomponents (e.g., “sample mean minus null mean, all divided by SEM” rather than “open parentheses sample mean minus null mean close parentheses divided by s divided by square root n”). Sometimes finding the right balance required editing the formula sheet based on feedback to make it more comprehensible or usable. Instructors should communicate early and often with students to determine the layout that works best for their understanding.
3.9 Resources During Exams
As mentioned above, it is important that the resources available during an exam match the resources the student has been learning and practicing with; switching a BVI student from their familiar laptop software interface to something entirely different may put them at a significant disadvantage relative to other students. This may mean an exception to a laptop or mobile device ban during exams, or having the student test in the instructor or TA’s office or at an educational access center.
If other students are allowed scratch paper during exams, then BVI students who use a text editor program like Notepad during their learning and practice should also have that same tool available during exams. If other students are provided with a formula sheet, statistical table, or their own page of notes, BVI students should have access to a digital and/or tactile copy of the same thing. In our situation within an introductory statistics course, all students had access to a calculator, scratch paper, a formula sheet, and one or two statistical tables for exams that were taken at a centralized proctoring location with locked-down computers.
Even if those computers could be unlocked to allow access to a calculator program and text editor, simply being on an unfamiliar operating system, or using unfamiliar versions of screen reader software, calculator programs, and text editors can create a large and unfair disadvantage for BVI students. Normally, during a skilled activity with a familiar tool (be it concrete or digital), the user has no conscious experience of the tool as an independent object. According to Heidegger (Citation1962) tools in skilled use become phenomenologically transparent; our awareness is purely of the ongoing task. He gives the example of a skilled carpenter: during trouble-free hammering, there is no conscious perception of the hammer or nails in the way there might be if we stop to contemplate them (Wheeler Citation2016). In this phenomenologically transparent state, the hammer is said to be ready-to-hand. We “see through” tools to the task we are engaged in (Dotov et al. Citation2017). However, when something goes wrong during tool use (e.g., the hammer fails), it ceases to be ready-to-hand and we notice it as an object, we notice its properties, we contemplate it as subject to object (it becomes present-to-hand). This Heideggerian analysis has been extended to digital tools like computers. Even minor perturbations when using a computer interface can transition a user from ready-to-hand to present-to-hand; at that point the tool is no longer transparent, functional integration of the tool decreases, performance on the task decreases, and subjects are more distracted by irrelevant information (Dotov et al. Citation2017). This explains why switching from a familiar digital interface (e.g., a particular version of the operating system, a specific text editor, or a preferred calculator program) to an unfamiliar one introduces a significant performance decrement and would be an unfair disadvantage for BVI students.
The ideal solution in our case was to allow the student to take exams using her own laptop with the familiar digital tools she had learned and practiced with, while supervised in the instructor’s office or at an educational access center familiar with her accommodations. In this way, her use of digital tools was automated and phenomenologically transparent so she could focus on the material and the abstract mathematical content instead of the computer interface.
4 Tactile and Auditory Learning Aids
4.1 Tactile Graphics
While text material is made tactile through Braille, graphics can also be converted to a tactile format (and tactile graphics may incorporate a great deal of Braille or none at all, though it should be noted that Braille tends to take up much more room on a paper than print). Various methods exist to create tactile graphics—for example, by creating paper with raised lines and shapes—and these can make previously visual graphics accessible to haptic exploration. Some of the most common systems work much like a traditional printer but use a special paper (called capsule paper or swell paper) that raises up from the page where heat is applied during printing, and this is a simple and fast way to convert simple diagrams, graphs, or other pictures to a tactile form. Many postsecondary campuses may have a printer for capsule paper (e.g., at a library or educational access center) or be able to easily acquire one for instructors to use (e.g., Pictures In A Flash—PIAF—is an affordable printer supplied by Humanware). This takes more preparation than printing or displaying traditional visual graphics, but it can be a great way to make some graphics accessible to the tactile modality.
It is, however, important to understand that a raised-line version of a visual object may not be processed in the same way that a visual student processes the original visual object. For example, the tactile medium requires more linear scanning than vision; Quek and McNeill (Citation2006) make the analogy of asking a sighted student to understand a graph while looking at it through a small tube with one eye (i.e., only a small part of the object can be investigated at one time, as opposed to the holistic processing possible with vision). In general, touch is slower than vision, needs more planning and controlling, and may involve greater demands on working memory (Millar Citation2000; Ballesteros et al. Citation2005). Thus, even with a raised-line tactile version of the visual material, a BVI student may not follow along as quickly or smoothly as sighted students.
Unfortunately, there are also limits to how well these systems can convert visual graphics to tactile ones. Capsule paper typically works best for simple designs, whereas complicated figures with a lot of fine detail may not be understandable in tactile form. Some complex diagrams may require simplifying or converting into multiple simpler sub-graphics before printing on capsule paper. Braille embossers offer more flexibility than capsule paper printing, but are generally more expensive. Instructors may wish to work with their BVI students to establish what sort of graphics can be successfully converted to tactile form via capsule paper or embossing versus those that require an alternative solution or consultation with a Braille graphics expert.
The Braille Authority of North America and Canadian Braille Authority (2011) provides detailed best practices for using Braille or raised-paper shapes to create mathematical and scientific diagrams (e.g., line graphs, histograms, boxplots, stem-and-leaf plots, chemistry diagrams, and so on). They also provide guidelines for when complex diagrams may need to be simplified, and how to do so without losing important information. Because elements that are visually distinct will not necessarily be distinct in the tactile modality, it may require different textures or line types to represent that information, and this requires editing of the graphic before printing on capsule paper; in some cases, this may be beyond the abilities of the instructor and require outside resources or assistance. In other cases, it may require only modest changes that can be completed by the instructor or perhaps assigned to a TA.
A comparison of tactile graphics within Braille versions of math and science textbooks found significant discrepancies with the original visual graphic in one eighth of the sample investigated (Smith and Smothers Citation2012). Subjective ratings of whether the tactile graphic was a valid representation of the original visual form averaged 3.71 on a scale from 1 (strongly disagree) to 5 (strongly agree). It is all too easy for a tactile graphic to serve as an imperfect translation of visual material.
4.2 Hands-on Educational Models
That said, the overall goal of tactile learning aids is to foster understanding of the course material and concepts. Sometimes this may be accomplished best not with raised-printing versions of visual material but with physical objects. Often low-tech solutions using easily available materials may be the best way to teach or demonstrate concepts outside of class.
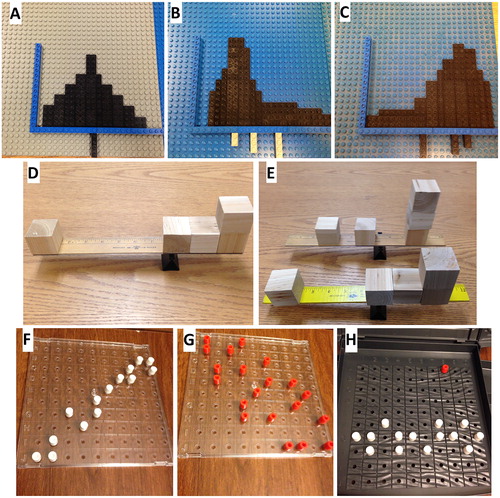
For example, building-block toys like LEGOs can be used to create tactile versions of histograms and other graphs (see for some examples we created to demonstrate measures of central tendency and skew on a histogram). also show how we used everyday materials like a ruler, binder clip, and wooden blocks to recreate a common statistics diagram (the mean as a balance point) for making measures of central tendency more intuitive (we also received feedback from some sighted students that this physical model made the concept more clear than the two-dimensional textbook diagram, another example where accessible resources can benefit all students). To demonstrate scatterplots (with positive, negative, strong, and weak correlations, outliers, etc.), we repurposed the components of the board game Battleship (Milton Bradley; ). Similarly, pushpins on a flat board connected by rubber bands or string can create graphs and figures with straight or even curved lines. We were told by the blind student in our introductory course that these low-tech tactile teaching aids were very helpful in demonstrating and clarifying core concepts.
Fig. 1 Low-tech tactile learning aids. (A) LEGO histogram of symmetrical distribution where mean = median = mode. (B) LEGO histogram of positively skewed distribution where mean is pulled toward outliers. (C) LEGO histogram of negatively skewed distribution. (D) Wooden blocks glued to a ruler balanced on a binder clip to demonstrate the mean as a balance point. (E) Another example where the student had to compare the block location of the mean to that of the median and mode. (F) Battleship pieces used to create a scatterplot with strong positive correlation. (G) Battleship pieces used to create a scatterplot with weak negative correlation. (h) Battleship pieces used to create an outlier on a scatterplot.
Tactile models made with simple, low-tech materials have been used successfully to teach a variety of subjects to BVI students, such as biology/microscopy (Ricker and Benefield Citation1981), geometry (Pritchard and Lamb Citation2012), neuroanatomy (Pietsch Citation1980), economics (O’Donnell Citation1991), music notation (Lam and Wang Citation1982), and environmental concepts (Budd and LaGrow Citation2000). More specific to statistics education, Gibson and Darron (Citation1999) describe ideas for using cardboard and modeling clay to teach a blind student in a statistics class. Vita and Kataoka (Citation2014) demonstrate a great example of using a low-tech tactile model to teach probability concepts like sample space, events, randomness, and relative frequency to BVI students. They did this using a tactile model akin to a homemade board game (a board, pieces of various shapes, foam cards of differing texture, and a variety of toys). This allowed blind students to perform a hands-on experiment demonstrating probability concepts in an intuitive way (e.g., creating a tree diagram representing all possible outcomes of random sampling). Cryer (Citation2013) gives more examples, while Marson, Harrington, and Walls (Citation2013) suggest colleagues in the art department may be of great assistance.
4.3 Custom Tactile Learning Aids Through 3D Printing
While low-tech repurposing of everyday three-dimensional objects into tactile learning aids may work well for teaching some statistical concepts, often the ideal solution would require a custom-designed object created from scratch specifically to teach a concept. 3D printing technology offers just such a solution, and its use in educational contexts has greatly increased in recent years. For example, three-dimensional printed artifacts have been widely used in chemistry education to create models of molecules, proteins, crystals, etc. (Rossi et al. Citation2015).
GAISE (2016) discusses the value of physical explorations prior to computer simulations to illustrate and practice concepts to foster active learning (Recommendation 4); for example, group activities might involve die rolling, flipping coins, or sampling tasks. 3D printing is an easy and cheap way to produce accessible versions of simple objects like dice and coins with Braille faces, as well as slightly more complicated objects like a static (Horvath and Cameron Citation2017) or interactive (Ideabigbang 2017) Pascal’s triangle. As Horvath and Cameron (Citation2017) demonstrate in a chapter on 3D printing for statistics and probability, 3D printing also allows creative tactile displays for concepts like the central limit theorem, thus serving roughly the same function as visual applets. As those authors state “textbooks on probability treat multivariate cases as advanced topics, but in many ways the manipulations of [multivariate] data are more intuitive and physical than the single-variable cases” (p. 114). In other fields, three-dimensional printed objects are already being used to develop multivariate thinking; for example, interpreting multivariate data of behavior (Ram et al. Citation2013) and biomarkers (Thrun et al. Citation2016) as landscapes. Maps are another tool increasing used in statistics education to visualize data in intuitive and insight-provoking ways (GAISE 2016), and 3D printing is an ideal way to translate color-coded maps or heatmaps into a tactile modality using height to represent the variable color is otherwise used to display (e.g., Danowall Citation2018). Giraud et al. (Citation2017) empirically demonstrate benefits of three-dimensional printed maps over raised-line maps for BVI students, further supporting the argument that when maps are used to visualize data in statistics education, 3D printing may provide a great accommodation for BVI students.
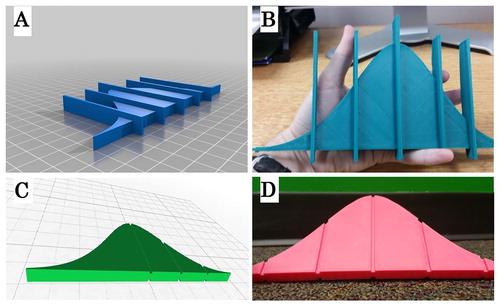
As one example from our own case, author DK improved upon and iterated an existing design available online (Ayoung 2013) for 3D printing a normal distribution. The initial design used raised lines coming out of the curve to represent the mean and one, two, or three standard deviations above and below it (), but after consulting with the blind student using it in our course, he replaced the raised lines with channels cut into the curve () (Kay Citation2016a, Citation2016b). This design could easily be extended to show how a distribution of sample means changes shape for random samples of different sizes; the benefit of three-dimensional printing is that designs can be shared freely online as open education resources for others to use and to improve.
Fig. 2 Iterations of 3D printing designs for the normal curve used in our introductory statistics course. (A) Early three-dimensional model using raised lines to indicate the mean and one and two standard deviations from the mean. (B) Printing of that early model. (C) Improved three-dimensional model using channels cut into the curve, based on feedback from blind student; this version indicates the mean as well as one and two standard deviations on a single side only. (D) Printing of the improved model; this version indicates one and two standard deviations on both sides of the mean.
Godfrey and Loots (Citation2015) mention 3D printing as a promising tactile solution for statistical content specifically (e.g., the empirical rule for the normal distribution), but they also make the important point that reading tactile representations (two-dimensional or three-dimensional) of visual concepts is a skill that needs to be taught and developed rather than something BVI users are born with. Furthermore, three-dimensional printing does not automatically overcome differences in processing spatial information. Sighted students often rely on depth perception to interpret data present three dimensionally, and haptic handling of a three-dimensional object may not provide the same perspective as three-dimensional vision with depth perception. Godfrey and Loots (Citation2015) give the simple example of a blind person exploring a cube with their hands: they may not fully appreciate that a sighted person cannot see the back of the object. Designing three-dimensional objects to convey statistical concepts to a user requires more than just converting a two-dimensional display of three-dimensional information to a three-dimensional printed object; it requires both creativity and user-centered design that takes into account empirical work on haptics and on how BVI users process information. As 3D printing matures beyond its current nascent stage, such empirical work will be necessary to establish best practices for designing educational three-dimensional printed models.
4.4 Auditory Learning Aids
Leuders (Citation2016) makes the case that auditory resources may be a useful option or supplement for learning mathematical material. This is supported by evidence studying how BVI children learn mathematics. For example, blind children have been shown to memorize temporal auditory information better than sighted children, and many blind children spontaneously use auditory representations for numbers (Leuders Citation2016). Blind children often use auditory representations for mental calculations, even when these are not taught in school, possibly because they are less likely to use finger-counting (Crollen et al. Citation2011). Of course, without external storage and playback, information coming in through the auditory system cannot be revisited the same way a visual or tactile object can (Winkler and Cowan Citation2005); thus, one way to utilize audition for learning may simply be for the instructor or student to record in-class lectures and discussion so that the information can be reviewed later.
Additionally, some innovative technologies may combine auditory and tactile information for teaching BVI students. For example, researchers have demonstrated the usefulness of adding auditory information to draw attention to particular spatial locations when teaching BVI students (Sanchez and Saenz Citation2006), something that could potentially mitigate those students’ limited access to deictic information (e.g., to an instructor pointing and saying “HERE”). Other systems add auditory feedback to tactile graphics, say by producing sound corresponding to movement of the learner’s fingers across a tactile surface (Wall and Brewster Citation2006; O’Sullivan et al. Citation2015; Shi, Zhao, and Azenkot Citation2017). Auditory feedback with tactile graphs could potentially translate a great deal of depth and complexity from visual diagrams that a simple visual-to-tactile conversion using raised-line paper cannot accomplish by itself. Howard, Parking, and Remy (2012) give an example to demonstrate the value of auditory information as a supplement to tactile information in teaching robotics programing to BVI students. It is possible the auditory modality could be combined with tactile exploration to recreate existing interactive visual applets. While such systems are all very promising, most are still in development and not widely available, are prohibitively expensive to scale up, or are not yet easily usable within the classroom.
5 Conclusion
Instructors teaching BVI students for the first time may feel unprepared and unsure how to accommodate the student, especially for a course that is heavily visual like many statistics courses. It is important for instructors to recognize the ways in which their typical teaching may be inaccessible to BVI students (e.g., use of gesture and deictics, relying on inaccessible online homework systems), to acknowledge the ways in which BVI students process the world differently than sighted students (e.g., heavy use of auditory working memory, scanning diagrams in a linear fashion), and to recognize the limitations of some accommodations (students may not use Braille, diagrams may be too complex for capsule paper, statistical software must support screen readers).
Rather than reinventing the wheel, we have suggested some accommodation ideas supported by the literature. Given that all accommodations—be they tactile, auditory, digital, or otherwise—have their own strengths and weaknesses, it is likely that a combination of strategies and resources will be necessary to fully accommodate a BVI student in a statistics course at the college level.
Of course, as Erhardt and Shuman (Citation2015) point out when relaying their experience teaching a blind student in a second-year statistics course, solutions that work in an introductory course will not be sufficient for more advanced courses. Likewise, solutions that work for one BVI student may not work well for another (Godfrey and Loots Citation2015). Some students will be proficient with Braille and prefer tactile versions of all textual material, while others may only care that text material is accurately read aloud by their screen reader. Some students will plan to go on to further courses in statistics or general STEM and may find it worth the learning curve of various software and markup languages, while other students may only require simpler solutions sufficient for an introductory course (especially one that focuses more on interpreting output of statistical software than actually using it). In all cases, proper accommodation calls for extensive communication between student and instructor (and potentially other stakeholders), some amount of trial and error, and also creativity on the part of the instructor, the student, and designers of accessible technological solutions.
Related Research Data
References
- AAWB-AEVH-NBA Advisory Council to the Braille Authority (1972), The Nemeth Braille Code for Mathematics and Science Notation (1972 Revision), Louisville, KY: American Printing House for the Blind.
- AMAC Braille Library (2017), available at https://www.amacusg.gatech.edu/braille-search.php
- American Federation for the Blind (1996), “Estimated Number of Adult Braille Readers in the United States,” Journal of Vision Impairment & Blindness, 90, 287.
- Archambault, D. (2019), “Braille Mathematical Notations,” Chezdom, available at http://chezdom.net/mathematicalbraillecodes/
- Ayoung (2013), “Normal Distribution Sliced to Show 68-95-99.7 Rule,” Thingiverse, available at https://www.thingiverse.com/thing:185896
- Ballesteros, S., Bardisa, D., Millar, S., and Reales, J. M. (2005), “The Haptic Test Battery: A New Instrument to Test Tactual Abilities in Blind and Visually Impaired and Sighted Children,” British Journal of Visual Impairment, 23, 11–24. DOI: 10.1177/0264619605051717.
- Bell, E. C., and Silverman, A. M. (2019), “Access to Math and Science Content for Youth Who Are Blind or Visually Impaired,” Journal of Blindness Innovation and Research, 9. DOI: 10.5241/9-152.
- Blackorby, J., Chorost, M., Garza, N., and Guzman, A. (2003), The Academic Performance of Secondary School Students With Disabilities: NLTS2 Report, Washington, DC: U.S. Department of Education.
- Braille Authority of North America and Canadian Braille Authority (2011), Guidelines and Standards for Tactile Graphics (2010), Louisville, Kentucky: American Printing House for the Blind.
- Brewer, D. S. (2010), “The Effects of Online Homework on Achievement and Self-Efficacy of College Algebra Students,” Dissertation Abstracts International Section A: Humanities and Social Sciences, 70, 2425.
- Budd, J. M., and LaGrow, S. J. (2000), “Using a Three-Dimensional Interactive Model to Teach Environmental Concepts to Visually Impaired Children,” Re:view, 32, 83.
- Butler, M. B., and Zerr, R. J. (2005), “The Use of Online Homework Systems to Enhance Out-of-Class Student Engagement,” International Journal for Technology in Mathematics Education, 12, 51–58.
- Chang, L. A., White, C. M., and Abrahamson, L. (1983), Handbook for Spoken Mathematics: Larry’s Speakeasy, Livermore, CA: Lawrence Livermore Laboratory, University of California.
- Cook, S. W., Yip, T., and Goldin-Meadow, S. (2012), “Gestures, but not Meaningless Movements, Lighten Working Memory Load When Explaining Math,” Language and Cognitive Processes, 27, 594–610. DOI: 10.1080/01690965.2011.567074.
- Crollen, V., Mahe, R., Collignon, O., and Seron, X. (2011), “The Role of Vision in the Development of Finger-Number Interactions: Finger-Counting and Finger-Montring in Blind Children,” Journal of Experimental Child Psychology, 109, 525–539. DOI: 10.1016/j.jecp.2011.03.011.
- Cryer, H. (2013), “Teaching STEM Subjects to Blind and Partially Sighted Students: Literature Review and Resources,” available at http://www.rnib.org.uk/knowledge-and-research-hub/research-reports/education-research/stem
- Danowall (2018), “United States by Carbon Emissions per Capita (2000–2014),” Thingiverse, available at https://www.thingiverse.com/thing:2751956
- Dick, T., and Kubiak, E. (1997), “Issues and Aids for Teaching Mathematics to the Blind,” The Mathematics Teacher, 90, 344–349.
- Dotov, D., Lin, N., Wojcik, K., Jinks, A., Yu, X., and Chemero, A. (2017), “Cognitive and Movement Measures Reflect the Transition to Presence-at-Hand,” New Ideas in Psychology, 45, 1–10. DOI: 10.1016/j.newideapsych.2017.01.001.
- Erhardt, R. J., and Shuman, M. P. (2015), “Assistive Technologies for Second-Year Statistics Students Who Are Blind,” Journal of Statistics Education, 23, 1–28. DOI: 10.1080/10691898.2015.11889733.
- Eskritt, M., Lee, K., and Donald, M. (2001), “The Influence of Symbolic Literacy on Memory: Testing Plato’s Hypothesis,” Canadian Journal of Experimental Psychology/Revue Canadienne de Psychologie Expérimentale, 55, 39–50. DOI: 10.1037/h0087351.
- Fitzpatrick, D. (2006), “Mathematics: How and What to Speak,” in International Conference on Computers for Handicapped Persons, pp. 1199–1206, Linz, Austria. DOI: 10.1007/11788713_173.
- Fitzpatrick, D., Godfrey, A. J. R., and Sorge, V. (2017), “Producing Accessible Statistics Diagrams in R,” in 14th Web for All Conference, Perth, Australia. DOI: 10.1145/3058555.3058564,.available at http://pure-oai.bham.ac.uk/ws/files/43284212/a22_Fitzpatrick.pdf
- GAISE College Report ASA Revision Committee (2016), “Guidelines for Assessment and Instruction in Statistics Education College Report 2016,” available at http://www.amstat.org/asa/files/pdfs/GAISE/GaiseCollege_Full.pdf
- Gibson, W. E., and Darron, C. (1999), “Teaching Statistics to a Student Who Is Blind,” Teaching of Psychology, 26, 130–131. DOI: 10.1207/s15328023top2602_13.
- Giraud, S., Brock, A. M., Mace, M. J., and Jouffrais, C. (2017),” Map Learning with a 3D Printed Interactive Small-Scale Model: Improvement of Space and Text Memorization in Visually Impaired Students,” Frontiers in Psychology, 8, 1–10. DOI: 10.3389/fpsyg.2017.00930.
- Goldin-Meadow, S., Nusbaum, H., Kelly, S. D., and Wagner, S. (2001), “Explaining Math: Gesturing Lightens the Load,” Psychological Science, 12, 516–522. DOI: 10.1111/1467-9280.00395.
- Godfrey, A. J. R. (2012), “Putting it all Together: A Blind Person’s Perspective on Developing a Toolbox for Document Preparation,” in Proceedings of the International Workshop on Digitization and E-Inclusion in Mathematics and Science 2012, pp. 135–142, Tokyo, Japan.
- Godfrey, A. J. R. (2013), “Statistical Software From a Blind Person’s Perspective,” The R Journal, 5, 73–79. DOI: 10.32614/RJ-2013-007.
- Godfrey, A. J. R. (2016a), “Statistical Software for Blind Users,” available at https://r-resources.massey.ac.nz/statsoftware/
- Godfrey, A. J. R. (2016b), LURN: Let’s Use R Now, Palmerston North, New Zealand; Massey University, available at https://r-resources.massey.ac.nz/LURN/
- Godfrey, A. J. R. (2016c), “R Markdown: Lifesaver or Death Trap?” in useR! 2016 International R User Conference, Stanford, CA. Available at https://channel9.msdn.com/Events/useR-international-R-User-conference/useR2016/R-markdown-Lifesaver-or-death-trap
- Godfrey, A. J. R. (2018), “BrailleR: Improved Access for Blind Users,” available at https://cran.r-project.org/web/packages/BrailleR/BrailleR.pdf
- Godfrey, A. J. R. (2019), “WriteR,” Github Repository, available at https://github.com/ajrgodfrey/WriteR
- Godfrey, A. J. R., and Curtis, J. (2016), “Simple Authoring of Statistical Analyses by and for Blind People,” in Proceedings of the International Workshop on Digitalization and E-Inclusion in Mathematics and Science 2016, pp. 47–54, Tokyo, Japan. Available at https://r-resources.massey.ac.nz/papers/deims16writeR/
- Godfrey, A. J. R., and Erhardt, R. (2014), “Addendum to ‘Statistical Software From a Blind Person’s Perspective,” The R Journal, 6, 182. DOI: 10.32614/RJ-2014-017.
- Godfrey, A. J. R., and Loots, M. T. (2014), “Statistical Software (R, SAS, SPSS, and Minitab) for Blind Students and Practitioners,” Journal of Statistical Software, 58, 1–25.
- Godfrey, A. J. R., and Loots, M. T. (2015), “Advice From Blind Teachers on How to Teach Statistics to Blind Students,” Journal of Statistics Education, 23, 1–27. DOI: 10.1080/10691898.2015.11889746.
- Godfrey, A. J. R., and Murrell, P. (2016), “Statistical Graphs Made Tactile,” in Proceedings of the International Workshop on Digitalization and E-Inclusion in Mathematics and Science 2016, pp. 69–74, available at https://r-resources.massey.ac.nz/papers/deims16tactile/
- Godfrey, A. J. R., Murrell, P., and Sorge, V. (2018), “An Accessible Interaction Model for Data Visualization in Statistics,” in Proceedings of the International Conference on Computers Helping People with Special Needs 2018, pp. 590–597, Linz, Austria.
- Hasper, E., Windhorst, R., Hedgpeth, T., Van Tuyl, L., Gonzales, A., Baluch, D., Martinez, B., Yu, H., and Farkas, Z. (2015), “Methods for Creating and Evaluating 3D Tactile Images to Teach STEM Courses to the Visually Impaired,” Journal of College Science Teaching, 44, 92–99. DOI: 10.2505/4/jcst15_044_06_92.
- Hawley, C. E., Cardoso, E., and McMahon, B. T. (2013), “Adolescence to Adulthood in STEM Education and Career Development: The Experience of Students at the Intersection of Underrepresented Minority Status and Disability,” Journal of Vocational Rehabilitation, 39, 193–204.
- Heidegger, M. (J. Macquarrie and E. Robinson, trans.) (1962), Being and Time, San Francisco, CA: Harper.
- Holbrook, M. C., and Koenig, A. J. (1992), “Teaching Braille Reading to Students With Low Vision,” Journal of Visual Impairment & Blindness, 86, 44–48. DOI: 10.1177/0145482X0009401102.
- Horvath, J., and Cameron, R. (2017), 3D Printed Science Projects (Vol. 2), Pasadena, CA: Nonscriptum LLC.
- Howard, A. M., Parking, C. H., and Remy, S. (2012), “Using Haptic and Auditory Interaction Tools to Engage Students With Visual Impairments in Robot Programming Activities,” IEEE Transactions on Learning Technologies, 5, 87–95.
- Ideabigbang (2017), “Pascal’s Triangle,” Thingiverse, available at https://www.thingiverse.com/thing:2121207
- Jones, M. G., Minogue, J., Oppewal, T., Cook, M. P., and Broadwell, B. (2006), “Visualizing Without Vision at the Microscale: Students With Visual Impairments Explore Cells With Touch,” Journal of Science Education and Technology, 15, 345–351. DOI: 10.1007/s10956-006-9022-6.
- Kapperman, G. (1974), “A Comparisons of Three Methods of Arithmetic Computation by the Blind,” unpublished doctoral dissertation, University of Northern Colorado, Greeley.
- Kapperman, G., Heinze, T., and Sticken, J. (1997), Strategies for Developing Mathematics Skills in Students Who Read Braille, Sycamore, IL: Research and Development Institute.
- Kassambara, A., and Mundt, F. (2017), “Package Factoextra,” available at http://www.sthda.com/english/rpkgs/factoextra/
- Kay, D. (2016a), “Normal Distribution With Mean and Standard Deviation Markers,” Thingiverse, available at https://www.thingiverse.com/thing:1360467
- Kay, D. (2016b), “Standard Normal Distribution Model (With Mean and Standard Deviation lines),” Thingiverse, available at https://www.thingiverse.com/thing:1463604
- Lam, R. C., and Wang, C. (1982), “Integrating Blind and Sighted Through Music,” Music Educators Journal, 68, 44–45. DOI: 10.2307/3395964.
- Le, S., Josse, J., and Husson, F. (2008), “FactoMineR: An R Package for Multivariate Analysis,” Journal of Statistical Software, 25, 1–18. DOI: 10.18637/jss.v025.i01.
- Leuders, J. (2016), “Tactile and Acoustic Teaching Material in Inclusive Mathematics Classrooms,” British Journal of Visual Impairment, 34, 42–53. DOI: 10.1177/0264619615610160.
- Lunsford, M. L., and Pendergrass, M. (2016), “Making Online Homework Work,” Problems, Resources, and Issues in Mathematics Undergraduate Studies, 26, 531–544. DOI: 10.1080/10511970.2015.1110219.
- Marson, S. M., Harrington, C. F., and Walls, A. (2013), “Teaching Introductory Statistics to Blind Students,” Teaching Statistics, 35, 21–25. DOI: 10.1111/j.1467-9639.2012.00510.x.
- Millar, S. (2000), “Modality and Mind: Convergent Active Processing in Interrelated Networks as a Model of Development and Perception by Touch,” in Touch, Representation, and Blindness, ed. M. A. Heller, Oxford: Oxford University Press, pp. 99–135.
- Moon, N. W., Todd, R. L., Morton, D. L., and Ivey, E. (2012), Accommodating Students With Disabilities in Science, Technology, Engineering, and Mathematics (STEM), Atlanta, GA: Center for Assistive Technology and Environmental Access.
- Murphy, E., Bates, E., and Fitzpatrick, D. (2010), “Designing Auditory Cues to Enhance Spoken Mathematics for Visually Impaired Users,” in Proceedings of the 12th International ACM SIGACCESS Conference on Computers and Accessibility, pp. 75–82, Orlando, FL.
- Nolan, D., and Perrett, J. (2016), “Teaching and Learning Data Visualization: Ideas and Assignments,” The American Statistician, 70, 260–269. DOI: 10.1080/00031305.2015.1123651.
- O’Donnell, M. G. (1991), “A Problem of Graphics: Economics and the Blind,” The Social Studies, 82, 91–93.
- O’Sullivan, L., Picinali, L., Gerino, A., and Cawthorne, D. (2015), “A Prototype Audio-Tactile Map System With an Advanced Auditory Display,” International Journal of Mobile Human Computer Interaction, 7, 53–75. DOI: 10.4018/IJMHCI.2015100104.
- Pietsch, P. (1980), “Three-Dimensional Models for Teaching Neuroanatomy to Blind Students,” Journal of Visual Impairment & Blindness, 74, 109–111.
- Pritchard, C. K., and Lamb, J. H. (2012), “Teaching Geometry to Visually Impaired Students,” The Mathematics Teacher, 106, 22–27.
- Quek, F., and McNeill, D. (2006), “Embodiment Awareness, Mathematics Discourse, and the Blind,” Annals of the New York Academy of Sciences, 1093, 266–279. DOI: 10.1196/annals.1382.018.
- Ram, N., Coccia, M., Conroy, D., Lorek, A., Orland, B., Pincus, A., Sliwinski, M., and Gerstorf, D. (2013), “Behavioral Landscapes and Change in Behavioral Landscapes: A Multiple Time-Scale Density Distribution Approach,” Research in Human Development, 10, 88–110. DOI: 10.1080/15427609.2013.760262.
- Raz, N., Striem, E., Pundak, G., Orlov, T., and Zohary, E. (2007), “Superior Serial Memory in the Blind: A Case of Cognitive Compensatory Adjustment,” Current Biology, 17, 1129–1133. DOI: 10.1016/j.cub.2007.05.060.
- Ricker, K. S., and Benefield, L. W. (1981), “Teaching Biology to Visually Handicapped Students,” Journal of College Science Teaching, 10, 355–360.
- Riebe, L., Girardi, A., and Whitsed, C. (2016), “A Systematic Literature Review of Teamwork Pedagogy in Higher Education,” Small Group Research, 47, 619–664. DOI: 10.1177/1046496416665221.
- Risko, E. F., and Gilbert, S. J. (2016), “Cognitive Offloading,” Trends in Cognitive Sciences, 20, 676–688. DOI: 10.1016/j.tics.2016.07.002.
- Rossi, S., Benaglia, M., Brenna, D., Porta, R., and Orlandi, M. (2015), “Three Dimensional (3D) Printing: A Straightforward, User-Friendly Protocol to Convert Virtual Chemical Models to Real-Life Objects,” Journal of Chemical Education, 92, 1398–1401. DOI: 10.1021/acs.jchemed.5b00168.
- Sahin, M., and Yorek, N. (2009), “Teaching Science to Visually Impaired Students: A Small-Scale Qualitative Study,” US-China Education Review, 6, 19–26.
- Sanchez, J., and Saenz, M. (2006), “3D Sound Interactive Environments for Blind Children Problem Solving Skills,” Behaviour & Information Technology, 25, 367–378.
- Schluchter, S. (2018), “Notes on Teaching Precalculus to a Blind Student in a College Precalculus Course,” The Journal of Blindness Innovation and Research, 8. DOI: 10.5241/8-136.
- Shi, L., Zhao, Y., and Azenkot, S. (2017), “Designing Interactions for 3D Printed Models With Blind People,” in Proceedings of the 19th International ACM SIGACCESS Conference on Computers and Accessibility, pp. 200–209, Baltimore, MD.
- Silverman, A., and Bell, E. C. (2018), “The Association Between Braille Reading History and Well-Being for Blind Adults,” The Journal of Blindness Innovation and Research, 8. DOI: 10.5241/8-141.
- Slee, R. (2011), The Irregular School: Exclusion, Schooling, and Inclusive Education, London: Routledge.
- Smith, D. W., and Smothers, S. M. (2012), “The Role and Characteristics of Tactile Graphics in Secondary Mathematics and Science Textbooks in Braille,” Journal of Visual Impairment & Blindness, 106, 543–554. DOI: 10.1177/0145482X1210600905.
- Spindler, R. (2006), “Teaching Mathematics to a Student Who Is Blind,” Teaching Mathematics and Its Applications, 25, 120–126. DOI: 10.1093/teamat/hri028.
- Sticken, J., and Kapperman, G. (1998), “Collaborative and Inclusive Strategies for Teaching Mathematics to Blind Children,” Educational Resources Information Center, ED421821, available at http://files.eric.ed.gov/fulltext/ED421821.pdf
- Thrun, M. C., Lerch, F., Lotsch, J., and Ultsh, A. (2016), “Visualization and 3D Printing of Multivariate Data of Biomarkers,” in International Conference in Central Europe on Computer Graphics, Visualization and Computer Vision. Pilsen, Czech Republic.
- Vita, A. C., and Kataoka, V. Y. (2014), “Blind Students’ Learning of Probability Through the Use of a Tactile Model,” Statistics Education Research Journal, 13, 148–163.
- Wall, S. A., and Brewster, S. A. (2006), “Feeling What you Hear: Tactile Feedback for Navigation of Audio Graphs,” in Proceedings of the 2006 Conference on Human Factors in Computing Systems, pp. 1123–1132, Florence, Italy.
- Wang, X., Rush, C., and Horton, N. J. (2017), “Data Visualization on Day One: Bringing Big Ideas into Intro Stats Early and Often,” Technology Innovations in Statistics Education, 10. Available at https://escholarship.org/uc/item/84v3774z
- Watanabe, T., Araki, K., Yamaguchi, T., and Minatani, K. (2016), “Development of Tactile Graph Generation Web Application Using R Statistics Software Environment,” Institution of Electronics, Information and Communication Engineers Transactions on Information and Systems, E99-D, 2151–2160. DOI: 10.1587/transinf.2015EDP7405.
- WebAIM (2015),. “Screen Reader User Survey #6 Results,” available at http://webaim.org/projects/screenreadersurvey6/
- Wheeler, M. (2016), “Martin Heidegger,” in The Stanford Encyclopedia of Philosophy (Winter 2016 edition), ed. E. N. Zalta, Stanford, CA: Stanford Encyclopedia of Philosophy. Available at https://plato.stanford.edu/archives/win2016/entries/heidegger/
- Whitburn, B. (2014), “‘A Really Good Teaching Strategy’: Secondary Students with Vision Impairment Voice Their Experiences of Inclusive Teacher Pedagogy,” British Journal of Visual Impairment, 32, 148–156. DOI: 10.1177/0264619614523279.
- Winkler, I., and Cowan, N. (2005), “From Sensory to Long-Term Memory: Evidence From Auditory Memory Reactivation Studies,” Experimental Psychology, 52, 3–17. DOI: 10.1027/1618-3169.52.1.3.
- Wong, P. C., and Bergeron, R. D. (1994), “30 Years of Multidimensional Multivariate Visualization,” in Proceedings of Scientific Visualization, Overviews, Methodologies, and Techniques, pp. 3–33, Washington, DC.
- Zerr, R. (2007), “A Quantitative and Qualitative Analysis of the Effectiveness of Online Homework in First-Semester Calculus,” Journal of Computers in Mathematics & Science Teaching, 26, 55–73.