
 ?Mathematical formulae have been encoded as MathML and are displayed in this HTML version using MathJax in order to improve their display. Uncheck the box to turn MathJax off. This feature requires Javascript. Click on a formula to zoom.
Abstract
One of the main goals of statistics is to use data to provide evidence in support of an argument. This article will discuss some popular forms of writing assessments currently in use, to demonstrate the differences between the methods for structuring the students’ learning to support their arguments with evidence. We share a model, which was originally created to assess students in introductory statistics and has been adapted for the second course in statistics, which takes a unique approach toward assessing the students’ understanding of statistical concepts through writing. In this model, students are expected to answer prompts that required them to (1) take a stance on an argument, (2) defend their position with facts given in the prompt, (3) discern the implications that those facts implied, and (4) give a proper conclusion to their argument. We provide examples of a few of the writing assignment prompts used in the course, their intended assessment purpose, and common answers that students gave to these assignments.
Supplementary materials for this article are available online.
1 Introduction
A common problem in education is determining how we can assess certain learning outcomes within courses and programs. How many times have we sat in curriculum development meetings wordsmithing the perfect learning outcome only to have a colleague reiterate, “it sounds great, but how do we assess it?!” Worse, we design an assessment tool, only to have our students not understand how to use it and we have to scrap the idea. For example, a potential learning outcome for a statistics course might be that we want our students to think and reason statistically. While student’s may be learning to think and reason statistically, assessing their ability to do so may prove difficult in many cases, and teaching them to effectively use assessment tools we have created may also pose a problem.
Even though producing assessments that allow students to demonstrate statistical thinking and reasoning might be difficult, a framework for identifying statistical thinking in student work has already been created. Wild and Pfannkuch (Citation1999) identified five elements of statistical thinking, which include: recognizing the need for data, transnumeration, considerations of variation, reasoning with statistical models, and integrating the statistical and contextual. Pairing this framework with a structure for students to write logical arguments may be what many of us have been looking for to assess our students’ ability to think and reason statistically.
The purpose of this article is to define why and how written work in statistics can be beneficial to statistics instructors and their students, as well as to review the ways in which instructors are currently using this type of assessment. Additionally, a structure to assist students with their writing is proposed, some sample writing assignments that use this structure will be given, and examples of students demonstrating critical thinking through statistical thinking in the assignments will be discussed.
2 Literature Review
Integrating written assessments in courses other than writing and rhetoric courses is not a new concept. After the Second World War, post-secondary education in the United States boomed. With a wider array of students now attending college, introduction to writing courses at the university were no longer able to handle the load that was put on them, to adequately educate students in writing. By the mid-1970s instructors had started to find that incorporating writing in other areas of the curriculum could be used to improve writing and critical thinking among college students. This was the beginning of the Writing Across the Curriculum Movement (Bazerman, Little, and Bethel Citation2005).
By the late 1980s, writing had begun to establish itself in mathematics and statistics courses. To document this process and help others incorporate these techniques into their courses, Connolly and Vilardi published a book entitled Writing to Learn Mathematics and Science. The intention of this book was to offer teaching strategies in an ever-changing learning environment, by providing an approach that could be taught at any school level to help break down the dichotomy often seen between procedures and conceptual knowledge in STEM courses (Connolly and Vilardi Citation1989). This was done through a compilation of articles that describe several authors’ perspectives on and the use of writing in their STEM classrooms.
In the 1990s, educators in quantitative fields, seeking to use written assessment in their courses, expanded on the discussion of using written work to assess students. For example, Radke-Sharpe (Citation1991) discussed the pros and cons of using written assessment in a statistics class and suggested possible ways that writing could be implemented. Shibli (Citation1992) also provided some positive aspects of using writing in quantitative courses, such as promoting problem-solving skills and improving understanding of interpretation. Though only quasi-experimental, Beins (Citation1993) found that by increasing the emphasis on writing in his introductory psychology statistics courses, students were better both computationally and with statistical interpretations.
Recognizing the value of using writing in quantitative courses was not just a fad of the 20th century. Statistics educators still use writing as a form of assessment in their courses and it is highly encouraged to do so by the statistics education community (Jolliffe Citation2007; American Statistical Association Citation2016). Today’s educators have expanded on possible writing assignments that may be used (Holcomb and Ruffer Citation2000), while others have found ways to incorporate statistical writing beyond the introductory statistics course, such as in business statistics (Goenner and Snaith Citation2003), psychology statistics (Drabick et al. Citation2007), and graduate-level research statistics (Parke Citation2008). More information about the types of assignments currently in use is discussed below.
A commonality found between all of this research is that writing tools that can help students conceptualize topics, to aid instructors in assessing student understanding, or to inform researchers as to some of the ways in which students learn concepts in statistics, as well as other fields. Below, we will discuss some of the benefits of using written work and ways that written work is currently used in statistics and other quantitative courses. Additionally, we propose a new writing structure that may be helpful in assessing our students’ statistical.
2.1 Why Use Writing Assignments?
The Principles and Standards for School Mathematics (National Council of Teachers of Mathematics, Citation2000) and the Guidelines for Assessment and Instruction in Statistics Education (GAISE) (American Statistical Association Citation2016) both recommend using written work to assess students. These recommendations acknowledge the multiple benefits written assessments may offer students in quantitative reasoning courses. For example, Johnson (Citation1983) believes that “good writing is part of the problem-solving process.” The writing process involves thinking and reflection (Burns Citation2004) and it forces students to slow down (Van Dyke, Malloy, and Stallings Citation2015) and organize their thoughts so that they can express them clearly. Even though each of these authors was describing writing in a mathematics course, the skills they mention are also encouraged in statistics courses. Utilizing writing assignments also has the added benefit of helping students to improve their writing skills while encouraging creativity of thought (Radke-Sharpe Citation1991). All of these skills may in turn help students internalize and conceptualize what they are learning in their statistics courses (Gopen and Smith Citation1989; Radke-Sharpe Citation1991).
For example, written work may help our students better to understand and demonstrate statistical concepts. Writing removes the temptation to just memorize formulas (Shibli Citation1992), and it helps students focus on the concepts in statistics (Goenner and Snaith Citation2003). This could help students to understand the reasoning behind statistical models, one of the elements of statistical thinking identified by Wild and Pfannkuch (Citation1999). Additionally, for students who are not mathematically inclined, writing may give them an outlet to demonstrate that they understand the material, even if they struggle to do so through computational procedures, which could be a confidence booster for students who are taking statistics courses as a requirement (Jolliffe Citation2007).
In addition to helping our students gain a deeper understanding of the concepts, writing also helps them to become better communicators of content and conceptual knowledge (Johnson Citation2016). With practice, the goal of these types of assessments is for our students to come to understand the language of statistics (Chance Citation1997) and use it to demonstrate what they know about statistical topics. It gives students an opportunity to “take a complex idea and explain it with clarity” (Cline Citation2008, p. 401) so that they may communicate their understanding of statistics to a general audience (Goenner and Snaith Citation2003; Johnson Citation2016). We are providing students with a type of assessment that affords them a different approach to demonstrate statistical thinking in creative ways (Radke-Sharpe Citation1991).
2.2 Writing Assignments Already in Use
Much of the research that was conducted in the late 1980s and early 1990s influenced the way that writing is used in statistics classrooms today. Educators at all levels and in several quantitative disciplines have discovered the benefits of using the students’ written work for assessment and research and have implemented their own assignments with their students. Some examples include minute papers, entry and exit slips and memos for shorter written assessments, and lab reports and course projects for longer written assessments.
For some, the creation of particular assessments was largely restricted by the amount of time it would take to grade and give informative feedback for larger classes. One solution used by Stromberg and Ramanathan (Citation1996) was to use entry and exit slips. In this approach, students respond in writing to a question posed at the beginning or end of class. Students’ responses are restricted to the size of a note card. Because of the limited space to write, students are ensured to give shorter answers to the questions. Similarly, having their business and economic students write memos, Goenner and Snaith (Citation2003) ensured that students wrote coherent but concise reports. This method also had the added benefit that students were practicing with a medium they would potentially use in their careers. These assignments can also be helpful to instructors. Zahn (Citation1992) found that minute papers, or short written assessments that focus on assessing understanding, comprehension, and clarity of thought over spelling and grammar, were valuable assessment tools. The minute papers were designed to be completed in the last few minutes of class and they not only allowed students to monitor their understanding of the material covered in the class period, but it enabled teachers to gain valuable feedback about their students’ progress. Even though these assessments are expeditious to complete and to grade, they can be a powerful tool for both students and instructors.
Other types of written assessment may take more time to grade, but may provide instructors with a better understanding of their students’ thinking. For example, Stromberg and Ramanathan (Citation1996) had students write a journal that supplemented their notes. These journals provided feedback to the instructors as to how well students understood the material, and it helped students to refine their writing to be more clear and concise. Journal entries also helped Hammett (Citation1993) to identify and address misconceptions that his students had in his introductory statistics course.
Writing assessments that are built to support the learning objectives of a course have been found to help students to connect concepts. Holcomb and Ruffer (Citation2000) created six projects for their students to complete over the course of a semester. Each project covered different material, but the context utilized in each of the projects was the same, providing consistency and helping students develop an understanding of the statistical concepts, while still maintaining focus on the context of the data with which they were working. Chance (Citation2002) also structured assignments to build on each other. When students received feedback, it was meant to support their work in subsequent assignments.
Not all assessments need to be semester-long commitments to help students make connections. While not a traditional writing assignment, concept mapping may help one to organize their thoughts on a topic and make connections between concepts through a visual representation, or map of the topic. Doorn and O’Brien (Citation2007) as well as Witmer (Citation2016) utilized concept maps in their introductory statistics courses. While Doorn and O’Brien did not find a significant increase in student learning, students self-reported that creating the concept maps might have improved study habits. Also relying on self-reported data, Witmer’s students stated that they found that concept mapping helped with making connections and some students were able to give specific connections they had identified.
2.3 Development of a Four-Step Structure
Writing may be difficult for students, especially when they are expected to write about a topic that they do not fully understand (Stromberg and Ramanathan Citation1996) or if they have not had much practice with technical writing. While a statistics instructor can provide students with the information they need to know to solve problems, teaching them technical writing to present strong arguments may be outside the scope of the course.
In trying to help her students develop scientific reasoning skills, Keys (Citation1994) found that providing a structure for written reports helped her students to focus their thinking on pertinent information. A popular example of structuring a response comes from Toulmin’s (Citation1958) model for argumentation, originally used to aid in creating verbal arguments for ill-structured problems (Karbach Citation1987). Inglis, Mejia-Ramos and Simpson (Citation2007) discuss several studies in which college mathematics students were expected to use Toulmin’s model, or a modification of it, to create well-defined mathematical arguments.
Toulmin’s model for argumentation directs users to create persuasive arguments by:
stating a claim;
identifying the data that supports the claim; and
make the connection between the claim and the data (known as warrants).
If needed, the argument can also be enhanced by:
providing backing for the warrants;
identifying qualifiers to support the strength of the relationships; and
providing a rebuttal indicating circumstances where the argument may not be true (Toulmin Citation1958).
To assist introductory statistics students in writing complete arguments and help them to better convey their reasoning Woodard (Citation2016), suggested teaching students a similar, yet simpler, four-element model, dubbed the four-step structure. Given a problem with a specific research question (such as the one offered below) this structure directs students to:
answer the question;
state relevant facts from the problem;
state the implications that the facts imply; and
explain how the facts lead to the conclusion.
These steps give students a structure to ensure they discuss all major parts of an argument in a potentially succinct manner. If students can limit themselves to concise statements for each step and still provide convincing arguments, this would significantly reduce the amount of time it would take to grade papers for a larger class. The next sections go into more detail for each of the four steps.
2.3.1 Answer the Question
Similar to Toulmin’s (Citation1958) first step of stating a claim, the first step of the four-step structure is for the students to answer the question in a complete sentence. The following example will be used to demonstrate the different pieces of the four-step structure:
Max is interested in the average wingspan of a particular type of insect. He randomly selected 35 of these insects and measured their wingspans. When conducting the analysis, he notices that the data appears to be slightly right skewed and he is unsure as to whether he can use the normal distribution to model the sample mean. Is the normal distribution a good model for helping Max estimate the average wingspan of the insect? Explain using the four-step structure.
To answer the question using a complete sentence, we might say: Max can use the normal distribution to help estimate the average wingspan of the insects.
Why is this step important? Stromberg and Ramanathan (Citation1996) claim that many students struggle with writing in part because they fail to read the instructions well enough to address the main question of the prompt. How often do we come across a response where the student has argued both sides of the question and never actually manages to tell us which side they believe to be true? It is almost as if they feel if they can hit all the major points on both sides that they might get some credit for the problem.
In making students provide a full sentence that answers the question, this gives them a topic sentence to anchor their argument. This also provides the reader with the direction the argument should go and helps them to assess whether the rest of the argument supports the decision the student has stated. According to Cline (Citation2008, p. 41), “good mathematical writing should present an argument so that the reader can easily follow the logic of each step as we work toward the conclusion.” This begins with knowing where the argument is going.
2.3.2 State Relevant Facts from the Problem
Similar to Toulmin’s (Citation1958) second element of argumentation, identifying data to support the claim, the next step in the four-step structure is to state the relevant facts from the problem that led them to the option they have chosen. Some examples of this may include information from the prompt, statistics they have calculated, or any output that was found with statistical software.
Continuing with our example, the relevant facts that are given to us are that Max took a random sample and it was of size 35. Students may also cite that the distribution of the data was slightly right skewed. Depending on how they focus their argument, this may or may not be important information.
Why is this step important? Too often, students try to argue their opinion on a topic instead of researching facts that can support their claim. This may be reflected in the way the student answers the question, or in the facts that they present to help support their argument. As a result, students may give vague or inaccurate statements (Van Dyke, Malloy, and Stallings Citation2015). Stromberg and Ramanathan (Citation1996) believe that students do this because they are not used to writing technical arguments. Every argument of substance should be backed by facts that strongly support the argument one is trying to make.
In addition to the quality of the argument, Grice believes that to be persuasive, one must also consider the “quantity of information.” When presenting an argument the author should “make [their] contribution as informative as required” but “not make [it] more informative than is required.” (Grice Citation1975, p. 15). In addition to providing the facts that support their claim, students should only provide the relevant facts. This means that students should not give more information than is required to solve a problem or argue a point. Grice (Citation1975) believes that in doing so writers may be wasting the reader’s time, the information could be confusing or, most importantly, it may raise side issues not intended to be discussed in the argument.
Too often students use a “shotgun” approach in which they write down everything they can think of for a problem in an attempt to hit the mark with at least one of their points. Hayden believes that answers should be short and direct. When grading work for his students, Hayden states “ambiguity or vagueness is taken as a sign of uncertainty and costs points” (Hayden Citation1997, p. 204). This is why when stating the facts of the problem, students are told to only give the relevant facts for the problem.
While stating the facts in the problem may not directly demonstrate that a student is thinking statistically about the problem, it is important that the student identifies the appropriate facts to support the claim they are making. These facts are the foundation of the argument and, provided the student follows the structure, they should lead the student to the implications that the facts imply. As we will see in the next section, the implications phase is where students are, in theory, the most likely to demonstrate their statistical thinking.
2.3.3 State the Implications That the Facts Imply
The third step in the four-step structure is for students to make connections between the information in the prompt and details they have learned in the course. They do this by stating implications of the facts that will eventually lead them to the conclusion of their argument. This element does not translate directly to one of the items in Toulmin’s model. Instead, this element combines both supporting claims with warrants and providing backing for the warrants (Toulmin, Citation1958).
Continuing with our example, a qualified statistician would know that if a person stated: “a random sample of 35 was taken” then the sample should be large enough so that we could use the normal distribution to model the sample mean, provided that the population distribution is not heavily skewed. The reason for this is that in our minds, we know that a random sample size of 35 means the central limit theorem applies in many cases.
Stating the implications that the facts imply is important so that we can ensure that the reader knows everything that the author knows and deems important to the argument. In utilizing this step, the author does not assume the reader has any other information besides the facts that have been stated.
In our example, a teacher may understand the student’s purpose, but a nonstatistician might not know the purpose of this information. Students may have been taught in class that as long as the sample size is at least 30 or that the sample size is sufficiently large, then the central limit theorem applies, and if the CLT applies, then the sampling distribution for the mean will be approximately normal. However, through experience, we know that many students forget why the sampling distribution is normal and just remember that the normal distribution can be used. This means that by making students state implications of the facts, we are forcing them to remember more than just how something works, but also why it works, a key factor in demonstrating statistical thinking (Garfield and Ben-Zvi Citation2008).
If a student were using the scenario given in our example to solve a traditional word problem, we may likely give full credit for the response as long as the student realizes the normal distribution should be used. If they do not write something like “by the CLT” on their paper, we would not have any demonstration from the student that they understand why they can use the normal distribution. We might often skip this step in assessing our students, perhaps because in our minds, we can make the leap between the two items very easily and we can convince ourselves that we “knew what the student meant.” With written work, a student has the ability to construct a statement to show exactly what they mean. By including this implication step, we are holding our students accountable for explicitly stating the train of thought that led them to a conclusion, which is what helps us assess their ability to think statistically.
In this step, students are required to make the connection between facts that have been presented to them and their statistical knowledge. One reason why students may write poorly is that their writing follows a method in which they supply a large number of facts, but it is up to the reader to formulate an implied coherent argument from those facts (Stromberg and Ramanathan Citation1996). Gopen and Smith (Citation1989) found that the student’s early written work in a calculus course often gave a list of facts without any connections to concepts. This may suggest that students are not used to writing implications and need some extra help with this step. It might also be that the author naturally assumes that the reader knows what the facts imply, and believes that it is not necessary to make those steps evident to the reader. This is problematic because the facts pertaining to a problem are not enough to prove an argument, especially if the reader does not know what those facts imply. Even if the reader does know what the facts imply, a good argument will still have the author stating why those facts are important to avoid ambiguity in implication (Grice Citation1975).
2.3.4 Explain How the Facts Lead to the Conclusion
In the final step, students are expect to tie together all loose ends and make sure that the reader understands the thought process used to go from facts, to implications, to a conclusion. Depending on how a student has answered the question, this could be similar to providing more backing for the claim, restating the original claim, or it may not translate to any of the elements in Toulmin’s (Citation1958) argumentation model. In this element of the four-step structure, students are expected to come full circle in their explanation and again reiterate the decision they have made for the problem.
In the previous section, we argued that an “ideal” student response would include that a sample size of at least 30 means that the central limit theorem applies. This does not answer the question of whether one can use the normal distribution to solve this problem. The student would then have to state how these things all come together.
The following would demonstrate a full solution to the problem given above: Max can use the normal distribution to model the average wingspan of the insects. We are told that he took a random sample of 35 insects. This means that we have a large enough sample that the central limit theorem should apply, even though there was a slight skew in the population data. When the central limit theorem applies, the sampling distribution of the average wingspan of the insects will be approximately normal and a normal distribution can be used to model the statistic.
Note that the above solution contains the statistical thinking constructs of reasoning with statistical models and integrating the statistical and contextual. Not all types of statistical thinking will be present in every assignment, and trying to include all of them at once may lead to an overbearing prompt. Thus, multiple assignments of this type may need to be assigned in a semester, each having a different outcome of statistical thinking that will be assessed.
3 Methods
To show the applicability of these four-step structured writing assignments, the first author, under the direction of the second author, conducted an IRB-approved, mixed-methods research study. In this study, students completed written assignments that used the four-step structure, which were then coded for instances of statistical thinking. These assignments were graded with a rubric that was developed by the first author and an analysis of student scores and statistical thinking was conducted at the end of the semester to identify improvements in the students’ writing. This section describes the participants, the course setting and the development of the writing assignment used in the study.
3.1 Participants and Setting
Participants for this study came from a small private women’s college in the southeastern United States. During the fall semester of 2016, fourteen students began a second course in statistics with the first author. Thirteen of these students finished the course and volunteered to participate in this study. Most students who take a second course in statistics are sophomore or junior statistics minors (the college does not have a statistic major) or are interested in learning more about statistics to aid in their research. The students in this study were majoring in mathematics (9 students), computer science (2), sociology (1), and psychology (1).
This second course in statistics is a continuation of introductory statistics. It includes topics of one- and two-sample inference, two-way tables, simple and multiple linear regression and one- and two-factor ANOVA. The course used the text Introduction to the Practice of Statistics 8th Edition by Moore, McCabe, and Craig for reference, though students did not complete assignments from the textbook. Homework for the course included automatically graded, online problems created by the first and third authors (worth 1/7th of the student’s grade). Additionally students completed three mid-term exams (worth 3/7th of the student’s grade), a final exam (2/7th of the student’s grade) and writing assignments (worth 1/7th of the student’s grade).
3.2 Writing Assignments
Throughout the course, students completed 10 individual writing assignments using the four-step structure described above. The assignments were created to match the 10 major topics that were covered in the course. Specific types of statistical thinking were not considered when making the writing assignments; however, each of the five types of statistical thinking recognized by Wild and Pfannkuch (Citation1999) could be identified in at least one of the writing assignments produced during the semester.
The general strategy of the writing assignments was to have students make a decision about a scenario using data that was provided for them. To assist students in giving reasonable responses, Chance (Citation1997) believes that students need to be given enough direction to complete the assignments. As such, the instructor worked through the first writing assignment with students and gave them guidance as to how to write the second assignment. Students wrote their responses individually starting with the third assignment.
Most of the assignments necessitated the use of the computer to give a reasonable solution. This design element was intentionally used to assess if students recognized the need for data when providing responses to the prompt, one of the five elements of statistical thinking. Jolliffe (Citation2007) believes that pairing written work with computational output provides a reasonable tool for assessment. While not all students will obtain the same results students could obtain the same output from the computer. When students are expected to interpret the output, we add another layer of differentiation that can be used to assess differences in student understanding.
While the structure of the assignments stayed the same, the purpose of the assignments varied over the semester, which provided an opportunity to assess different types of statistical thinking while maintaining a certain consistency for students. For example, some assignments called for students recognizing the need to use the data provided, as opposed to their intuition, to create an appropriate model for prediction (Wild and Pfannkuch Citation1999; American Statistical Association Citation2005; Citation2016), an example of which can be seen in assignment 7 below. Other assignments asked students to determine if a proposed method was valid when, unbeknownst to the students, the method utilized a common misconception in statistics (Rossman and Chance Citation2004). Other assignments included creating a simulation to answer the question (Tintle et al. Citation2015) or critiquing the work of another individual to determine if that individual had correct thinking (Rossman and Chance Citation2004), an example of which can be seen in assignment 4 below.
Rubrics for grading were developed based on the expected solution strategy to answer the question as well as utilizing the four-step structure. For each assignment, four points were allocated for addressing each part of the four-step structure; one to two points were allocated toward answering the question appropriately; and the remaining five to six points were allocated toward the creation of an appropriate argument for the problem.
The first author used the rubrics to grade the assignments and give feedback to the students. This process took approximately 30–40 min per writing assignment. In one case, the rubric was amended after seeing solutions from students. Because of some specific wording in the rubrics, these were not provided to students prior to submitting their responses. Example rubrics and an explanation of the rubric amendment are described more below.
4 Examples
This section will demonstrate two example writing assignments used in the course. The purpose of each assignment and the intended and observed statistical thinking outcomes will be discussed. Additionally, information will be provided as to when the assignment was given in the course, an intended solution strategy, possible student solutions and misconceptions, and a potential rubric for grading. Throughout this section, pseudonyms are used for all students from the statistics course. The remaining writing assignments from the course and any applicable datasets can be found in the appendix.
4.1 Assignment 7—Weird Statistics: Regressing a Prom Date
Weird Statistics: Regressing a Prom Date () necessitated students using regression output in nontraditional ways to make decisions about the data. The primary purpose of this assignment was to assess the students’ use of context to solve statistical problems and their recognition of a need for data over intuition.
Fig. 1 Weird Statistics: Regressing a Prom Date.
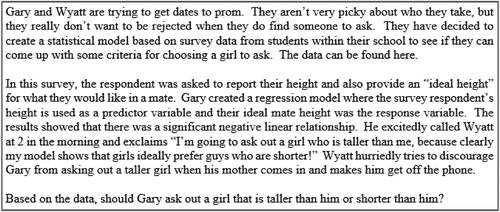
This assignment was given to students at the end of a section covering multiple linear regression. While multiple linear regression may not have been necessary to solve the problem, this put students in the mindset to think about multiple variables to model the response variable.
If the student were to conduct regression on the full dataset, they would see the negative relationship that Gary spoke about with Wyatt. Using the context of the problem, students might recognize that Gary should only be looking at half of the dataset: women describing their preference for their ideal mate. After separating the dataset and redoing the regression analysis, students should find that the regression line is now positive. These data show us an example of Simpson’s Paradox: a trend that occurs when two groups are viewed together disappears or changes when the groups are visualized separately.
Finding that the slope of the regression line is now positive is not the key to solving this problem. Since the slope of our regression line is positive, this tells us that shorter women ideally prefer shorter mates and that taller women ideally prefer taller mates. What Gary could do at this point is input his height in for the response variable and determine the explanatory variable value that would maximize his chances of getting a date, something not traditionally done in a statistical analysis.
However, since we do not know Gary’s height, the student would need to look at the regression line () and recognize that at each point on the regression line, the value of the independent variable is less than the value of the dependent variable. This is what informs us that on average, females desire a mate that is taller than them and what students would need to discuss in order to get full credit on this problem.
An ideal response to this prompt and a rubric for grading () follow.
Fig. 2 Rubric for Weird Statistics: Regressing a Prom Date.
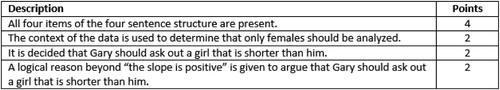
Gary should ask out a young woman that is shorter than he is. When graphing height, ideal mate height and the appropriate regression line for females only, we get a graph like the one visualized in . From this graph we can see that on average (at the regression line) the height of the individual is lower than the ideal height of their mate and it can be visualized that most of the data falls above the line y = x. This means that many women prefer mates that are taller than them. Hence, Gary has the best chance of not being rejected (based on height alone) if he were to find a woman that was shorter than him.
Fig. 3 Scatterplot and regression line of the female data for Weird Statistics: Regressing a Prom Date.
Most of the students in the course could identify that the full dataset included both males and females stating their preferential mate height, and that the responses for the males needed to be removed from the analysis. For example, part of Samantha’s response to the prompt was:
Gary should not ask out a girl that is taller than him … Typically, males are larger than females and would prefer a shorter mate, while females would prefer a larger mate. Likely more males were sampled than females, which would lead Gary to believe that he should ask out a girl that is taller than him … In order to determine who he should ask out based on their preference of mate height, he would need to sample only females so that he would be able to determine what their ideal mate height is so he can see if he fits it…
This solution earned Samantha a score of 7. Even though her conclusion is not given here, Samantha did include all four pieces of the four-step structure in her full response. However, she gave irrelevant facts for the argument. When she stated that “likely more males were sampled than females” it is obvious that she did not use the data she was given to inform her statement as she could determine exactly how many males and females were in the dataset, and it is information that is not relevant for the argument she needs to make. This means she earned 3 points for using the structure, 2 points for using the context to realize that only females should be used in the analysis and 2 points for recognizing that Gary needed to ask out a woman that was shorter than him.
While Samantha was not able to make the leap, most students that reached this point in the analysis then stated something to the effect of “if the slope of the regression line is positive, then that means that women prefer men that are taller than them.” While the way the prompt was intentionally worded may have led students to this response, they may also have come to this conclusion based on their own intuition as opposed to using the data that was given. Provided that students utilized the four-step structure appropriately, the maximum that these students could have earned on the assignment was an 8 because they did not provide a reason beyond “the slope of the regression line is positive.”
One way to help students to avoid this notion and to perhaps look deeper into the data that they have analyzed is to mention that the slope of the regression lines for males is also positive. By the student’s interpretation, that means that men want someone that is taller than them as well. The context may then potentially lead them to sense that their interpretation is not entirely correct.
As it turns out, the students’ conclusions were correct, based on the data, females do desire taller mates. However, they came to this conclusion based on inaccurate implications of the data and we may not have been able to see this fully if they had not used the four-step structure to relay their responses.
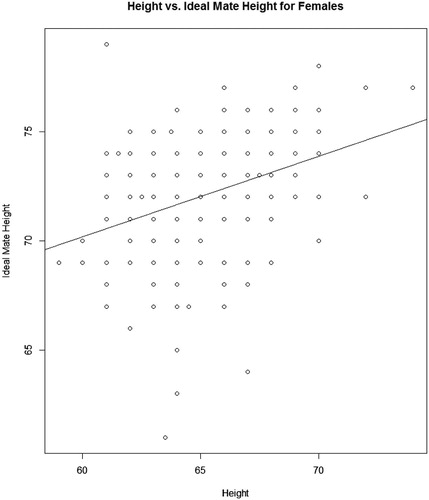
4.2 Assignment 4 – Chi-Square Conditions Conundrum
The goal of Chi-square Conditions Conundrum () was to have students think about the viability of a proposed method. The statistical thinking outcome to be assessed in Chi-Square Conditions Conundrum was students’ understanding of variability in the data. This assignment was given to students after a section on methods for analysis for categorical data. This included using the Chi-square distribution for goodness-of-fit tests and tests for independence.
Fig. 4 Chi-square conditions conundrum.
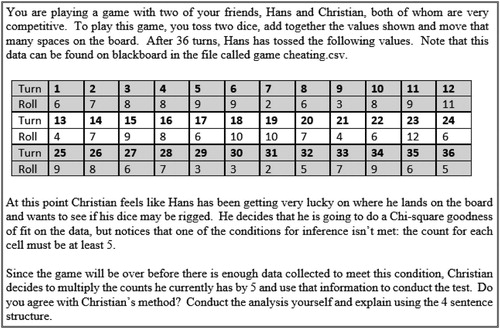
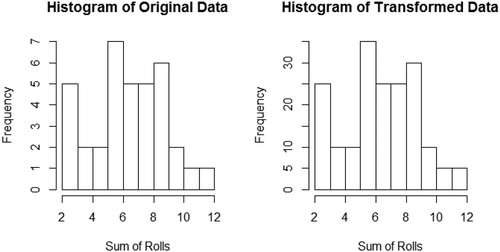
The proposed method in the prompt has students (and Christian) multiplying counts for the data by 5 to ensure the counts for each cell are at least 5, one of the conditions for inference for a Chi-squared goodness-of-fit test. If a student agrees that Christian may proceed with the proposed method, they are essentially stating that data are not variable. A trained statistician would know that the data collected in this game would eventually converge to the theoretical probability distribution for the sum of two 6-sided dice, as the number of turns increased. By multiplying counts of the data given above by 5, we would be preventing the data the opportunity to converge. Consequently, using this method would just amplify results currently found in the data. Graphing data before and after transformation would confirm this, as can be seen in .
Fig. 5 Histograms of original and transformed data for Chi-square Conditions Conundrum.
An ideal response to this prompt and a rubric for grading () follow.
Fig. 6 Rubric for Chi-square conditions conundrum.
I do not agree with Christian’s proposed method. We are told that Christian plans to multiply the counts he currently has by 5 to meet the condition for inference that cell counts are at least 5. We can see from the graphs in that this method provides us with data with the exact same distribution as the original data set, although amplified by a factor of 5. However, it is known that data is variable and that it is essentially impossible that Hans would get the exact same rolls as he did previously, four more times, and that the distribution of all 180 rolls would be exactly the same as it was for the first 36 rolls. Since this method prevents our “new” data from being variable compared to the original data set it presents unreliable data to be used for inference hence the given method should not be used.
Responses that address other conditions for inference, such as observations not being randomly generated or lack of independence between observations would also be acceptable reasons not to utilize this method. Neither of these arguments were made by students, which is probably due to the way in which they were taught. As such, the rubric given in does not account for these options, however, it could be modified to include these responses.
Most students in the class answered this question correctly. However, a few interesting incorrect solutions were identified. Students seem to believe that we should do anything we can to obtain significant results. Emily and Samantha both stated that multiplying the counts by 5 was a good method, not only because it helped us meet the conditions for inference, but also because the results become significant. Even though the students’ arguments were incorrect, both used all four elements of the four-step structure and earned a score of 4 on the assignment. This writing assignment provided a good opportunity to remind students that while we desire significant results, we cannot manipulate the data to obtain those results.
There was also some confusion as to what was being multiplied by 5. Isabella thought that the sums on the dice were being multiplied by 5, not the counts, and demonstrated this when she stated: “if we have two dice and add them together, the most that our number could be would be 12, but if we multiply the numbers we get by two or five, we get unlikely numbers that we could roll.” This was helpful in identifying that Isabella did not understand what was meant when told the conditions for inference. Her solution contained all four elements of the structure and she did make a statement that the method should not be used, earning Isabella 5 points on this assignment.
5 Students’ Growth on Assignments
In addition to being a useful tool for assessing statistical thinking, the four-step structure may have helped improve students’ statistical thinking, their writing skill, or both, as the scores on the writing assignments increased on average from the beginning of the semester until the end.
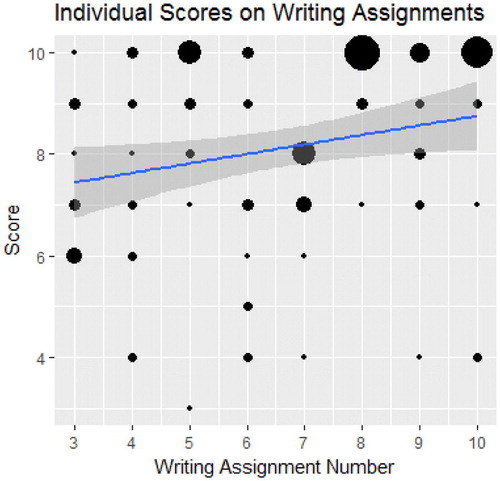
In and , we can see graphs of the average score on writing assignments 3 through 10 and individual scores with a line of best fit for the same assignments, respectively. Recall that the first two assignments of the semester were highly structured by the instructor, and scores on these writing assignments may not be indicative of the students’ ability. Despite some trouble with assignments 6 and 7, we can see a positive trend in the students’ scores throughout the semester, with several students doing very well on the last three assignments of the semester. However, a formal regression analysis of the data would not be appropriate since students’ scores between assignments are likely correlated.
Fig. 7 Average score on writing assignments 3 through 10.
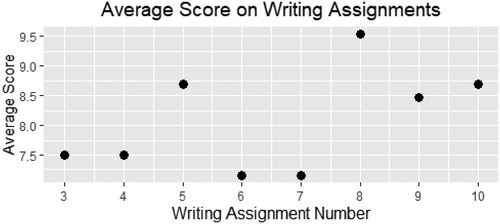
Fig. 8 Bubble plot of scores for individuals on writing assignments 3 through 10.
A breakdown of the scores students earned on these assignments indicate that there was little to no change in the average number of 4-step structure steps included in the student’s assignments. Students were able to use the structure consistently throughout the course. On average between 3.5 and 3.9 instances of the four-step structure were observed in each of the assignments.
Additionally, the proportion of correct responses to the prompt (although not necessarily elaboration of that decision) remained near 85% for all of the writing assignments. Two exceptions to this are writing assignment 10, where 100% of the students responded correctly to the prompt and writing assignment 6 where only 8 of the 13 students correctly answered the prompt.
The only other major aspect of the grading scale that remained constant from assignment to assignment was students’ understanding of the major statistical concepts and being able to make reasonable connections to their conclusions. Since the students’ scores increased on average, this may suggest that the students’ ability to think and reason statistically, or at least to communicate their thinking, improved as the semester went on. It should be noted, however, that the assignments were only graded by the primary investigator and there is a possibility for grader bias in these results.
It is clear from that the scores on assignment 7 – Weird Statistics: Regressing a Prom Date were low. As was discussed above, on this assignment none of the students gave a full solution because they jumped to the conclusion that a positive slope meant that Gary should ask out a shorter prom date. This may have been due to the way the question was worded, or it may be that students were influenced by the context of the data to choose the solution that stated women wanted taller dates. As we can see from , most students received a score of 7 or 8 on this assignment. As it turns out, by this point in the semester, most students were using the four-step structure and writing strong arguments. The only reason the average score for this assignment was low was because of students losing points for giving an incorrect reason as to why Gary should ask out a woman that was shorter than himself.
Similarly, in assignment 6–Professors are out(liers) to get–students implemented inferential procedures before checking the data. In the dataset for this assignment, there was an outlier that was influencing the significance of the regression output, which four of the thirteen students did not see, subsequently earning them scores of 4 or 5 on this assignment and bringing down the class average for this assessment. Despite teaching students to conduct an exploratory data analysis before doing any statistical test, both to understand the story behind the data and to check conditions for inference, it is obvious that some students still did not grasp the importance of using descriptive statistics in an analysis. This assignment helped to demonstrate that this was not an isolated incident and more emphasis should be placed on these items when teaching the course in the future.
For the most part, students seemed to understand and use the four-step structure when completing their writing assignments. Although there was an occasional part of the structure left out of an argument, each student in the class, except for Emily, was able to effectively use the four-step structure to produce strong statistical arguments.
Emily was responsible for seven of the eight lowest scores on the writing assignments displayed in , with a score of only five (the second lowest score) on writing assignment 6. Her low scores are likely due to the fact that she struggled with the course material for the entire semester. One factor that may have contributed to this is that her statistical background consisted of only introductory statistics, while approximately half of her classmates had done additional coursework in either probability or statistical computing. Additionally, while Emily spoke English proficiently, she grew up in a country with three primary languages.
6 Discussion and Implications
The use of writing assignments in statistics courses can be beneficial to students. Using the four-step structure as a model provided students with a consistent base to write their arguments. The structure helped students to include essential pieces of an argument that they may have forgotten to include otherwise, and reminded them to avoid using information that was not relevant to an argument they were trying to make (Keys Citation1994). These assignments gave students the chance to demonstrate they understood the concepts and that they were not just repeating steps in a formula (Shibli Citation1992; Goenner and Snaith Citation2003).
However, as was seen with the case of Emily, students may struggle to write appropriate statistical arguments. This may happen because of weak statistical backgrounds, language barriers, or struggles with the statistical concepts, amongst other reasons. In these cases, it may be helpful to allow students to review other classmates’ papers before they submit them for grading. If students continue to struggle with the four-step structure, the instructor could ask them to color code the four steps in their responses. This will help the student to identify whether they have included all four steps, as well as help the instructor to see how students view each of the four steps.
These writing assignments were also found to be a useful tool for the instructor. In general, the instructor felt like she was more informed of her students’ progress and could more easily identify the areas where students were struggling to understand the material (Stromberg and Ramanathan Citation1996; Burns Citation2004). This allowed her to help students on an individual basis as was seen above in Isabella’s example for Chi-square Conditions Conundrum, or if she saw that multiple students were struggling with the same concept, as was seen in Weird Statistics: Regressing a Prom Date, she could revisit a topic as a class.
The writing assignments also allowed students to be creative in their responses (Radke-Sharpe Citation1991). This helped the instructor to see ways in which students thought statistically, even if it was not with the intended type of statistical thinking. While it was not discussed above, in assignment 3—Monkeying Around with Models, the intended strategy for students to solve the problem was to check the conditions for inference and reason that a two-sample t-test would not be appropriate for the given data. However, several students in the course instead reasoned that the original model—a paired differences test—would possess less variability and would be the better model to use. Since students were thinking statistically about the problem and came up with a reasonable solution, a modified rubric was created to accommodate these responses. Because of the inherent creative nature of writing, instructors that use writing assignments should be prepared to deviate from their initial rubric at times.
By incorporating writing assignments that utilized the four-step structure, one can ask questions of different forms and assess all types of statistical thinking. Student responses tended to be of a moderate length, which made these assignments good for identifying what students understand without having to spend an exorbitant amount of time grading and giving meaningful feedback (Stromberg and Ramanathan Citation1996).
Note: The approach to assessing students and examples of the students’ work presented in this article are based on the dissertation of the first author at the North Carolina State University, under the direction of the second author.
Supplementary Materials
The supplementary materials that can be found online, are files that contain the data sets discussed in the article.
Supplemental Material
Download Comma-Separated Values File (222 B)Supplemental Material
Download Comma-Separated Values File (13.4 KB)Supplemental Material
Download Comma-Separated Values File (5.6 KB)Supplemental Material
Download Comma-Separated Values File (15.4 KB)References
- American Statistical Association (2005), Guidelines for Assessment and Instruction in Statistics Education. American Statistical Association. Available at http://www.amstat.org/education/gaise
- American Statistical Association (2016), Guidelines for Assessment and Instruction in Statistics Education (GAISE) College Report, Alexandria: American Statistical Association.
- Bazerman, C., Little, J., and Bethel, L. (2005), Reference Guide to Writing across the Curriculum. West Lafayette, Indiana: Parlor Press LLC.
- Beins, B. C. (1993), “Writing Assignments in Statistics Classes Encourage Students to Learn Interpretation,” Teaching of Psychology, 20, 161–164. DOI: 10.1207/s15328023top2003_6.
- Burns, M. (2004), “Writing in Math,” Educational Leadership, 62, 30–33.
- Chance, B. (1997), “Experiences With Authentic Assessment Techniques in an Introductory Statistics Course,” Journal of Statistics Education, 5. DOI: 10.1080/10691898.1997.11910596.
- Chance, B. (2002), “Components of Statistical Thinking and Implications for Instruction and Assessment,” Journal of Statistics Education, 10. DOI: 10.1080/10691898.2002.11910677.
- Cline, K. S. (2008), “A Writing-intensive Statistics Course,” Primus, 18, 399–410. DOI: 10.1080/10511970701203239.
- Connolly, P., and Vilardi, T. (Eds.). (1989), Writing to Learn Mathematics and Science, New York, NY: Teachers College Press.
- Doorn, D. J., and O’Brien, M. (2007), “Assessing the Gains from Concept Mapping in Introductory Statistics,” International Journal for the Scholarship of Teaching and Learning, 1. DOI: 10.20429/ijsotl.2007.010219.
- Drabick, D., Weisberg, R., Paul, L., and Bubier, J. (2007), “Keeping It Short and Sweet: Brief, Ungraded Writing Assignments Facilitate Learning,” Teaching of Psychology, 34, 172–176. DOI: 10.1080/00986280701498558.
- Garfield, J., and Ben-Zvi, D. (2008), “Assessment in Statistics Education,” In J. Garfield, and D. Ben-Zvi (Eds.), Developing Students’ Statistical Reasoning (pp. 65–89). Springer Science & Business Media.
- Goenner, C. F., and Snaith, S. M. (2003), “Incorporating Writing into an Introductory Business and Economics Statistics Course: A Practical Approach.” Available at http://ssrn.com/abstract=388480
- Gopen, G. D., and Smith, D. A. (1989), “What’s an Assignment Like You Doing in a Course Like This?: Writing to Learn Mathematics. In P. Connolly, and T. Vilardi (Eds.), Writing to Learn Mathematics and Science (Vol. 21, pp. 209–230). New York: Teachers College Press. DOI: 10.2307/2686716.
- Grice, H. P. (1975), “Logic and Conversation,” In P. Cole, and J. Morgan (Eds.), Speech Acts, Syntax and Semantics (Vol. 3,pp. 41–58). New York: Elsevier.
- Hammett, J. E. (1993), “Writing to Learn Statistics: Maintaining Learning Journals in Order to Identify and Address Undergraduate Students’ Misconceptions,” Third International Seminar on Misconcpetions and Educational Strategies in Science and Mathematics, Misconceptions Trust. Ithaca, NY.
- Hayden, R. (1997), “Using Writing to Improve Student Learning of Statistics,” Writing across the Curriculum, 8, 198–205.
- Holcomb, J. P., and Ruffer, R. L. (2000), “Using a Term-long Project Seq-uence in Introductory Statistics,” The American Statistician, 54, 49–53. DOI: 10.2307/2685611.
- Inglis, M., Mejia-Ramos, J. P., and Simpson, A. (2007), “Modeling Mathematical Argumentation: The Importance of Qualification,” Educational Studies in Mathematics, 66, 3–21. DOI: 10.1007/s10649-006-9059-8.
- Johnson, K. G. (2016), “Incorporating Writing into Statistics,” In J. Dewar, P-s. Hsu, and P. Harriet (Eds.), Mathematics Education (pp. 319–334). Switzerland: Springer International Publishing.
- Johnson, M. L. (1983), “Writing in Mathematics Classes: A Valuable Tool for Learning,” The Mathematics Teacher, 76, 117–119.
- Jolliffe, F. (2007), “The Changing Brave New World of Statistics Assessment,” IASE/ISI. Available at http://iase-web.org/documents/papers/sat2007/Jolliffe.pdf
- Karbach, J. (1987), “Using Toulmin’s Model of Argumentation,” Journal of Teaching Writing, 6, 81–92.
- Keys, C. W. (1994), “The Development of Scientific Reasoning Skills in Conjunction With Collaborative Writing Assignments: An Interpretive Study of Six Ninth-grade Students,” Journal of Research in Science Teaching, 31, 1003–1022. DOI: 10.1002/tea.3660310912.
- Moore, D. S. (2010), The Basic Practice of Statistics, New York: W. H. Freeman and Company.
- National Council of Teachers of Mathematics (2000), Principles and Standards for School Mathematics. Reston, VA: NCTM.
- Parke, C. (2008), “Reasoning and Communicating in the Language of Statistics,” Journal of Statistics Education, 16. DOI: 10.1080/10691898.2008.11889555.
- Radke-Sharpe, N. (1991), “Writing as a Component of Statistics Education,” The American Statistician, 45, 292–293. DOI: 10.2307/2684457.
- Rossman, A. J., and Chance, B. L. (2004),” Anticipating and Addressing Student Misconceptions,” In ARTIST Conference on Assessment in Statistics (pp. 1–4). Lawrence University, Appleton Wisconsin.
- Shibli, A. (1992), “Increasing Learning With Writing in Quantitative and Computer Courses,” College Teaching, 40, 123–127. DOI: 10.1080/87567555.1992.10532232.
- Stromberg, A. J., and Ramanathan, S. (1996), “Easy Implementation of Writing in Introductory Statistics Courses,” The American Statistician, 50, 159–163. DOI: 10.2307/2684429.
- Tintle, N., Chance, B., Cobb, G., Roy, S., Swanson, T., and Vanderstoep, J. (2015), “Combating Anti-Statistical Thinking Using Simulation-based Methods Throughout the Undergraduate Curriculum,” The American Statistician, 69, 362–370. DOI: 10.1080/00031305.2015.1081619.
- Toulmin, S. E. (1958), The Uses of Argument. Cambridge: Cambridge University Press.
- Van Dyke, F., Malloy, E. J., and Stallings, V. (2015), “Conceptual Writing in College-level Mathematics Courses and its Impact on Performance and Attitude,” International Journal of Mathematical Education in Science and Technology, 46, 223–233. DOI: 10.1080/0020739X.2014.956821.
- Wild, C. J., and Pfannkuch, M. (1999), “Statistical Thinking in Empirical Enquiry,” International Statistical Review, 67, 223–248. DOI: 10.1111/j.1751-5823.1999.tb00442.x.
- Witmer, J. A. (2016), “Concept Maps in Introductory Statistics,” Teaching Statistics, 38, 4–7. DOI: 10.1111/test.12083.
- Woodard, R. D. (2016, August), “Emphasizing Critical Thinking in Introductory Statistics,” The Joint Statistical Meetings. Chicago.
- Zahn, D. A. (1992), “Notes on the Use of Minute Papers in Teaching Statistics Courses,” American Statistical Association Proceedings of the Section on Statistics Education, 62–71.
Appendix
Assignment 1—I Z What You Did There
(Reasoning with Statistical Models)
An IT staff member at a large company in Raleigh was asked to determine the average amount spent per laptop for the company last year. Unfortunately, the staff member was a little disorganized and lost most of the receipts. His boss tells him that if he can come up with an estimate for the value, that would be sufficient. The IT member was able to find the receipts for 6 random purchases and found an average cost of $684.92 with a standard deviation of $17.10. He also knows that the distribution of costs on the laptops is normally distributed. He then calculated a confidence interval for the data and reported to his boss: “I am 95% confident that the true average amount we spent per laptop last year was between $671.24 and $698.60.” Is the IT member’s statement correct? Explain using the four-step structure described below.
Provide a clear answer. If the question asks you a yes or no question, state either yes or no and answer in a complete sentence. If the question asks you to choose from two options, choose one of the options and answer in a complete sentence.
State the RELEVANT facts that lead to your answer. Find the information given to you in the problem that is relevant to the answer you have just given. Don’t write everything you know about a topic, only what makes sense for the given problem.
State the additional information the facts imply. Connect the relevant information you just stated to information you have learned that led you to the conclusion you have made.
Explain how the implications lead to the conclusion. Connect any missing dots to your argument that lead you to give the answer you did.
Assignment 2 —Open is the New Biased
(Recognize the Need for Data)
Piper is trying to determine the proportion of teens who text and drive. She went online and found two sources that reported different results. Here is what she found.
Source 1: A newspaper article had randomly surveyed 84 teens anonymously asking questions about different behaviors they exhibited. One of the questions asked, “Do you text while driving?” The survey results stated that 76% of teens reported that they texted while driving.
Source 2: A local high school student and member of the school newspaper posted the question “Do you text and drive” on her Facebook account. 397 of her friends responded. About 53% of them reported that they texted while driving, the results of which the student posted in the school newspaper.
Piper believes that since the second source sampled more people, the results are more reliable. Do you agree with Piper’s conclusion? Explain using the four-step structure.
Assignment 3—Monkeying Around with Methods
(Reasoning with Statistical Models or Considerations of Variation)
Note: This assignment was adapted from a problem found in the Basic Practice of Statistics (Moore Citation2010, p. 456).
The usual way to study the brain’s response to sounds is to have subjects listen to both “pure tones” and a recognizable sound. Researchers were interested in the monkeys’ responses to pure tones versus monkey calls and if the monkeys would respond stronger to the monkey calls. The researchers fed pure tones and monkey calls directly to the brains of 36 monkeys. The response to the stimulus was measured by the firing rate of neutrons in the various areas of the brain. A paired differences test was conducted on the data. Note: the data for this problem can be found on blackboard in the file called Tone Data.csv.
[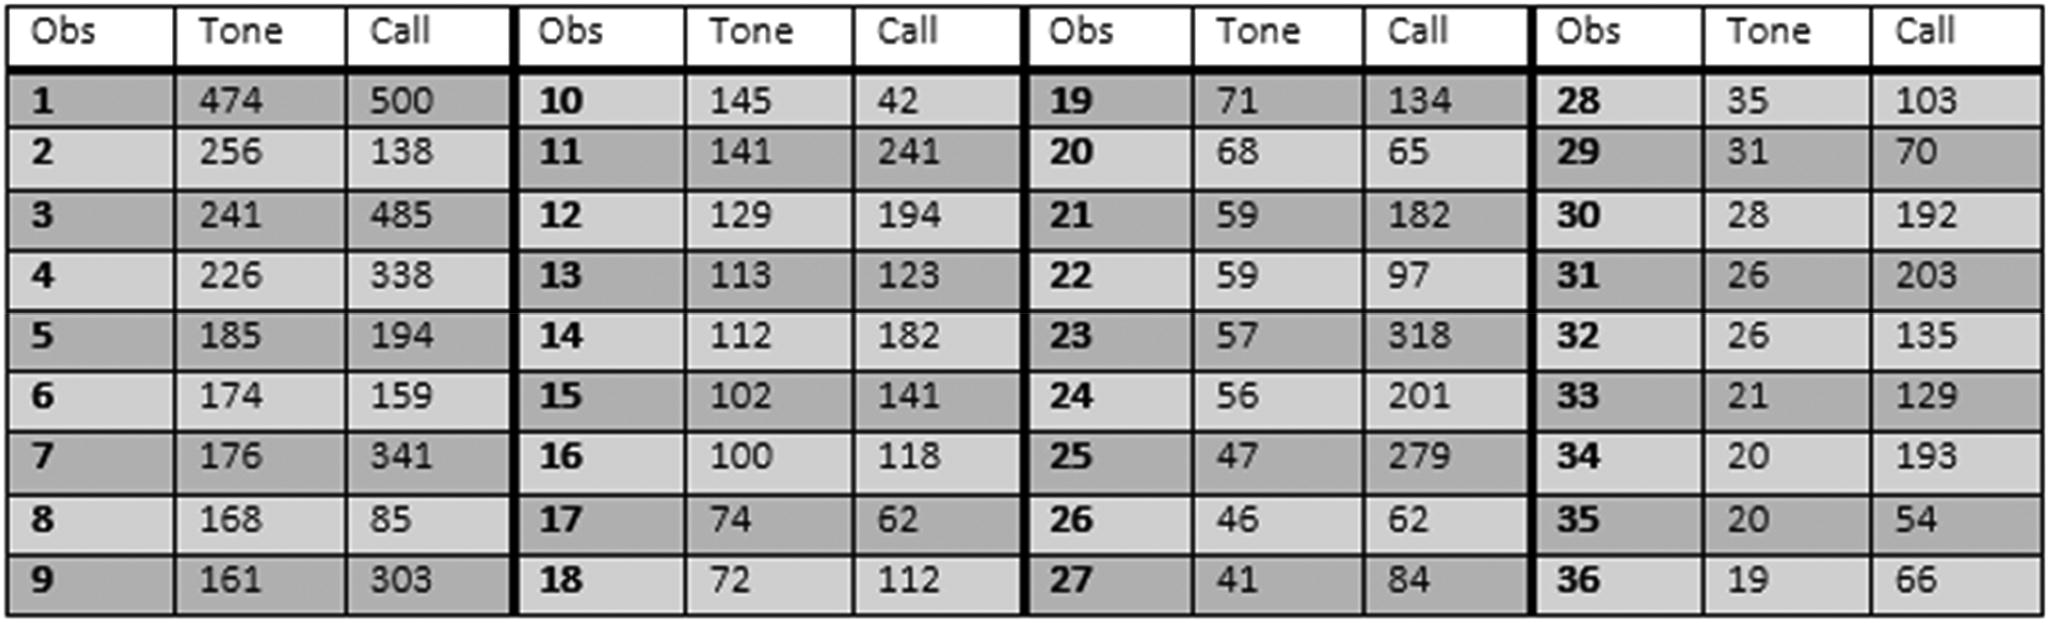 ]
]
Before data collection, one member of the research team had recommended splitting the monkeys in half using random assignment, giving the treatment group the monkey call and the control group the pure tone. The researchers then would have done a two-sample t-test on the data. Solve the problem on your own first then decide: do you agree with the researcher’s proposed method? Explain using the four-step structure. Make sure to support your answer with any relevant analysis.
Assignment 5—Mini Model Selection
(Transnumeration and Reasoning with Statistical Models)
Johnny is a car salesman and is developing a model to help him assign prices to cars that he might want to purchase (to be resold). He has collected several variables worth of data on both Honda Accords and Toyota Camrys. These data can be found on blackboard in the file entitled car.data.csv.
He would like to have a model for predicting price based on the variable mileage. Examine the data given to you and consider different ways to build this model. Your goal is to propose at least two models that Johnny could use to predict the price of the cars. Which of your proposed models do you think is best for Johnny? Explain using the four-step structure.
Assignment 6—Professors Are out(Liers) to Get ya!
(Transnumeration and Reasoning with Statistical Models)
Alice is a student at Mid-South State University (MSSU). She and her friend Alex, who are both rather tall, feel like professors may be intimidated by their height and treat them more harshly when it comes time to assign grades. Alice took an introductory statistics course and remembers her teacher harping on the fact that data beat anecdotes, so she does not want to jump to any conclusions based solely on the accounts of two people.
She was able to obtain some data from surveys collected from randomly selected students at the university. This dataset includes information such as the student’s gender, height, GPA and number of credit hours taken, among other variables. This dataset can be found on blackboard as survey.csv.
Using the data from the survey, Alice examined the linear relationship between height and GPA and found evidence at the 10% level that taller students have lower GPA’s. Do you agree with Alice’s claim that there seems to be a negative relationship between height and GPA? Explain using the four-step structure.
Assignment 8—the Ultima(te) Model Selection
(Reasoning with Statistical Models)
Johnny is back at it again. He is still trying to come up with a model to help him with purchasing cars. However, now he has learned about multiple linear regression and wants to include several variables in his model and come up with the best one to determine the price. The data for this problem can be found on blackboard in the file car data.csv.
From his successful endeavors in simple linear regression, Johnny is convinced that mileage belongs in the model and asks that you include it in future models. Using the data that is given to you, help Johnny determine the best model to predict the price of the cars. Explain why your model is the best model using the four-step structure.
Assignment 9—Identifying Statistical Errors
(Considerations for Variation)
Matthew, a pediatrician, wanted to determine the average amount of calories that his 0 to 3-month old patients were getting. Specifically, he wanted to test to see if the children in his care were getting at least the recommended 400 calories per day, giving him the following hypotheses:
After taking a random sample of his patients, and conducting the appropriate test, he found his p-value to be 0.043. Matthew wrote a summary of his results by saying: “we reject the null hypothesis and there is sufficient evidence to conclude that the children are getting at least 400 calories per day.” When asked about the potential for a statistical error in his results he stated, “No, there is no chance of a statistical error. I double checked my calculations, made sure all of my assumptions were met and I know that when my p-value is small that I reject my null hypothesis.” Is Matthew’s final statement correct? Explain using the four-step structure.
Assignment 10—Confirming Theoretical through Simulation
(Considerations for Variation and Reasoning with Statistical Models)
Recall that the Bonferroni multiple comparison adjustment allows us to compare multiple pairwise comparisons but helps to maintain the correct Type I error rate. That is for example, if we are comparing three populations, and we conduct pairwise t-tests on all combinations, we need to redefine our significance value to be .
Two statisticians are arguing over how well the Bonferroni correction works. One of them argues that it gives us a Type I error rate that is above 5% (that is, the tests will still reject more than 5% of the time, even if the population means are all the same value). The second statistician argues that it gets us below a 5% Type I error rate. Which statistician (if either) is correct? Conduct a simulation to show who is correct. Explain your results using the four-step structure.