
 ?Mathematical formulae have been encoded as MathML and are displayed in this HTML version using MathJax in order to improve their display. Uncheck the box to turn MathJax off. This feature requires Javascript. Click on a formula to zoom.
Abstract
This article presents the results of a case study from one professor’s experience teaching an introductory statistics course. The goal of this study was to better understand student perceptions of engagement in a statistics course. Voluntary, self-reported data were collected daily for students to evaluate the engagement level of the class that day, and students also identified activities that they considered engaging. A final survey was administered at the end of the semester to provide a holistic, retrospective measure of engagement in the course and to collect feedback on various questions related to perceptions of engagement. Results indicate variation in student engagement scores and variation in engagement scores across the semester indicating some influence of class activity on perceptions of engagement. Perceptions of engagement are contextualized with students’ comments from the daily surveys. Associations between engagement and final course grade were also investigated. Student perceptions of engagement were also compared to the professor’s perception of engagement for students.
1 Introduction
Engaging students in an introductory statistics class can be a challenging task, but it is important for student success. Engaged learning is comparable to active learning where students are participating in class and “doing things and thinking about the things they are doing” (GAISE College Report ASA Revision Committee Citation2016, p. 18). Professors and students likely have unique perceptions about engaging activities. Understanding student views on engagement can allow professors to better design their courses to foster engaged learning and encourage student success.
The introductory statistics class that served as the basis for this study is typically taken by a combination of students with and without prior experience in statistics. Informally, this course is referred to as an “advanced introductory statistics course” as it begins the semester performing t-based inference. Historically, this course has been populated by first-year students, but the proportion of upper-classmen taking this course has increased as the course has become required for a variety of majors on campus including biology and public health. Due to the diversity of majors, the course is designed to incorporate interdisciplinary examples to draw connections across fields. The goal of the course is to provide students with applications of statistics so they are able to perform statistical analysis independently. An ancillary goal is to foster conceptual understanding so that when students are presented with more advanced statistical methods, they will have conceptual underpinnings. Topics include t-tests, ANOVA, chi-square test, simple linear regression, and multiple linear regression. This course exclusively uses SAS to perform statistical analysis. As such, students are instructed on the syntax of coding in SAS to code independently. Some demonstrations using applets and R are performed in the course. The professor participating in this study was especially conscious of incorporating many different types of activities and course materials to enhance student engagement during the semester in which study data was collected. In particular, the professor used multiple randomization-based activities (Rossman and Chance Citation2008; Starnes, Yates and Moore Citation2010) to cultivate students’ understandings of statistical inference. Applets such as “Sampling Distribution Simulation” (“Sampling Distribution Simulation” 2008) and “Understanding ANOVA Visually” (Malloy Citation2000) were used periodically throughout the course. In addition, topical readings were provided, such as excerpts from What is a P-Value Anyway (Vickers Citation2009) and Statistics: Guide to the Unknown (Peck et al. Citation2006).
1.1 Hands-On Activities
Hands-on activities were used regularly in this study with the hope it would engage students. Educators emphasize student understanding of deeper concepts, rather than memorized computations, and activities are a means of developing deeper understanding. Several studies have been conducted in recent years to test the effectiveness of different in-class activities on student performance. Froelich, Stephenson, and Duckworth (Citation2008) set out to evaluate in-class activities designed to get students actively involved with data collection and analysis. Five activities were designed to address specific common, conceptual issues, such as distributions and regression. The authors found the most improvement was on the regression activity which led to higher exam scores regarding interpretations of slope and intercept for students in the experimental group. While they did not find a significant change in attitudes for the experimental group at the end of the semester, this did indicate that the activities at the very least did not cause harm.
Another study by Pfaff and Weinberg (Citation2009), on the other hand, found different results. They tested the effectiveness of four different hands-on activities based on statistical inquiry and interpreting real-world results rather than heavy theory. Assessments were done at the beginning of the semester, after completing an activity, and again at the end of the semester to test effectiveness. Unfortunately, the “hands-on activities generally failed to help students develop a good understanding of the underlying statistical concepts” (Pfaff and Weinberg Citation2009, p. 9). Of particular interest to our research is the fact that despite students not gaining significant conceptual knowledge, they did give feedback that the activities engaged them. An important take away is that although an activity might be engaging, that does not necessarily improve a student’s understanding of an underlying statistical concept. Supplementary material or reflection activities could aid students in making these connections to underlying concepts.
1.2 Real-Life Data and Student Projects
Incorporating real-life data and allowing students to collect their own data are also commonly found to enhance student learning and is encouraged by the GAISE report (Aliaga et al. Citation2005). Brophy and Hahn (Citation2014) conducted an experiment using Sudoku puzzles during the very first class period. The data collected were then used throughout the semester to answer varying research questions and to discuss different topics catering to the level of the course. While the researchers believed students enjoyed using the collected data, student reactions were not recorded specifically. However, some students did comment informally on the end of semester survey that they enjoyed using the data, indicating a positive reaction.
Past studies have suggested that using real-life data when teaching statistics has many advantages. Practicing calculations and interpretations using real data allows students to construct knowledge and understand the deeper context. Real-life data, as opposed to hypothetical or simulated data, has also been shown to prepare students for the real-world and industry. Neumann, Hood and Neumann (Citation2013) studied the effects of student perceptions on the use of real-life data. Once the course was finished, a select group of students who were willing to participate were interviewed anonymously over the phone. Student comments showed that real-life data often made an impression on students and allowed them to reference an example in their mind when addressing future problems. Overall, the study found that using real-life data is associated with “specific types of student learning experiences such as relevance, understanding and learning, interest, motivation and engagement” (Neumann, Hood, and Neumann Citation2013, p. 67) and therefore encourages the use of real-life data in the classroom.
Many instructors are aware that statistics does not always have the best reputation among students and those perceptions affect their overall experience. The previous literature cited indicates that a student project would likely positively impact their attitude. Carnell (Citation2008) tested the effect of a student designed project on their overall view of statistics. The experiment contained two groups, one that designed and implemented a project and the other did not. Both groups were given a pre- and post-test to identity attitudes. Carnell concluded that implementing a single student designed project did not significantly change overall attitudes. However even with the results, Carnell called for more research to be done on the impact of projects as more evidence is needed, and there are likely many other confounding variables to be investigated.
1.3 Interactive Social Techniques
Research has also been done to look at different teaching techniques. Neumann, Hood, and Neumann (Citation2009) investigated the effects of humor when teaching statistics. A stratified random sample of 38 introductory statistics students were interviewed by telephone to determine the overall student opinion of humor in the classroom. “Responses indicated that humor aided teaching by providing amusement, breaking up content, bringing back attention, lightening the mood, increasing motivation, reducing monotony, and providing a mental break” (Neumann, Hood, and Neumann Citation2009, p. 1). This study was focused exclusively on student experiences and most respondents recommend the use of humor. However, it is important to note that not everyone appreciated the humor as it could be considered off-topic or distracting, especially for students who were already focused on the material. Therefore, the use of humor must be done with tact. The authors ultimately recommend humor be incorporated into the many techniques utilized to increase student engagement and improve overall learning.
1.4 Influencing Behavior and Attitudes
Motivational variables have also been researched. Sproesser, Engel, and Kuntze (Citation2015) designed an experiment for eighth graders to determine if motivational variables such as self-concept, one’s own confidence in their abilities, and interest could be positively influenced by certain statistical activities in the classroom. Since interested students are more likely to engage with an activity and the overall material, this study is of particular interest to us as well. Previous research has supported that providing feedback and allowing students to work both independently and in groups enriches motivational variables. Some of the activities that were used included hands-on candy activities, collecting and analyzing data from student experiments, as well as analysis of real-world data. The researchers created an intervention group that would be exposed to these activities and a control group for comparison. For assessment, students were asked to complete a pretest which showed no differences between the two groups in terms of self-concept and interest. After the post-test however, the intervention group that completed the activities showed significant improvement in self-concept and interest, “[h]ence, it appears that providing statistics-specific hands-on activities, cooperative learning, student-centered work and feedback in the learner-centered intervention helped to foster student’s self-concept and interest” (Sproesser, Engel, and Kuntze Citation2015, p. 5). Understanding what affects these motivational variables is important for our study because students who have greater confidence and interest are likely to be more engaged with the material and could have greater success.
A 2006 study by Vanhoof et al. explored Belgium students’ attitudes and their relationship with a short-term statistics exam grade, as well as a long-term dissertation grade. The researchers used the Attitudes Toward Statistics scale (Schau et al. Citation1995) which incorporates students’ attitudes about statistics in their field, in addition to attitudes about the course they are enrolled in. The study cited a myriad of previous research asserting evidence that student attitudes had a statistically significant positive correlation to exam results. The results by Vanhoof et al. were in alignment, finding student attitudes toward the course and their statistics exam results (short term) were significantly positively correlated. In the long term, a student’s dissertation grade was more related to their attitude about statistics in their field, as opposed to the specific course. “Our results suggest that students who recognize the importance of statistics for their field of study will tend to obtain a better dissertation grade” (Vanhoof et al. Citation2006, p. 12). Thus, student success can be dependent, at least in part, on their attitudes toward statistics.
A meta-analysis by Emmioğlu and Capa-Aydin (Citation2012) also analyzed the relationship between student attitudes toward statistics and achievement in 17 different studies, across eight different countries ranging in publication dates from 1998 to 2011. All studies used the Survey of Attitudes Toward Statistics scale (Schau et al. Citation1995) to capture student attitudes. The results from the meta-analysis showed there were significant positive relationships between student attitudes (Affect, Cognitive Competence, Value, and Difficulty) and achievement. Interesting to note, is that studies conducted in the United States showed larger effect sizes than those conducted in non-U.S. countries. These results are important in helping to illuminate the positive relationship between student attitudes and achievement in statistics.
However, research regarding student views about what they find engaging is not as extensive. Therefore, this study is aimed at providing insight into how professor and student engagement perceptions relate and what activities students find most engaging. Our goal was to develop a better understanding of what students view as engaging in an introductory statistics course in relation to what a professor views as engaging. The results would help educators design courses with maximum engagement to potentially increase student attitudes and thus achievement.
2 Methods
At the end of each class period, students were encouraged to voluntarily fill out an engagement survey (Appendix A) rating the level of engagement for the day on a scale from 1 (not engaging) to 10 (as engaging as possible). They were also provided a comment field with the prompt “List the activities or types of activities that you considered engaging in today’s class.” Students were asked to complete this survey of daily engagement after each class, excluding exams days, with periodic reminders throughout the course from the professor to complete the daily surveys. At the end of the semester, students were sent out a more comprehensive survey they could voluntarily complete regarding their final impressions, including overall level of engagement for the course (Appendix B). On the end of semester survey, students were asked to provide definitions of “engaged learning.” This survey was administered after final course presentations, which took place during the final exam block. Participants provided informed consent, and this experiment was conducted under IRB approval.
After each class period, the instructor also assessed the level of engagement during the class period using the same 1 to 10 scale as students. This rating indicated the level of engagement the professor perceived the class to be through the lens of a student. In addition, the instructor listed the elements of the class that she perceived were most engaging for students.
To better understand students’ views of engagement in the class, the instructor incorporated a variety of potentially engaging materials. Some of this engagement is typical for the professor, as mentioned in the introduction. Typical engagement for this professor includes the use of randomization-based activities, applets, additional readings, and class time to work on examples. As a part of this study, the instructor also incorporated watching statistical music videos, statistical sing-a-longs, statistical cartoons, current events related to statistics in the news, and information on jobs in statistics. The course instructor found much of the additional engagement items using the Consortium for the Advancement of Undergraduate Statistics Education web page.
After final grades were submitted, students’ daily responses, end of semester responses, and final grades were matched and the resulting data was de-identified. An additional dataset that recorded the instructor’s daily responses was also generated.
Analyses included descriptive boxplots and scatterplots. Inferential methods included Pearson correlations, simple linear regression and Kruskal–Wallis tests. Bonferroni’s adjustment for multiple comparisons was used for simultaneous confidence intervals.
3 Results
This research study took place during a Fall semester in which there were 38 class days and one final exam block which was used for class presentations (Day 39). Three class days (16, 25, and 35) were used to administer noncumulative exams and several work days were provided. Project presentations were given during the final exam block. Of the 30 students registered for the class, 29 agreed to participate in the study. Of the 29 participants, 21 students completed at least one daily survey and the end of the semester survey. The average number of daily engagement surveys completed by students was 17.2 (SD = 6.68). To better understand some of the trends in the data, it is important to note that Day 20 was the last day of class before Fall Break and that Day 35 was the last day before Thanksgiving Break. There were two days (34 and 38) where no students completed the daily engagement survey.
3.1 Overall Data Summary
shows summary information regarding the daily student engagement scores, reported overall course engagement at the end of the semester, the class grades, and the professor engagement scores where daily engagement is rated from 1 (not engaging) to 10 (as engaging as possible). The daily student engagement score reported in is the mean engagement score across 34 class days, where the score for each day is the average of all student scores for that class period. Daily averages from student scores typically ranged between 5 and 9 (mean = 6.4, SD = 0.88), indicating a moderate to high level of engagement (). There were 587 responses throughout the entire semester. The overall response rate varied from day to day with a median rate slightly over 58.6%. Response rates can be seen in where larger circles indicate higher response rates. The response rates were higher in the beginning of the semester and slowly decreased as the course progressed. Also seen in , the student daily average engagement ratings tended to fall between 5 and 8 on the ratings scale. The mean student engagement score across all responses for the course (mean = 6.43, SD = 2.16) and the mean daily student engagement score () are comparable, but these scores are less than the mean professor engagement score for the course (mean = 8.15, SD = 1.68). In general, there was a difference of at least one point between the student daily averages and the instructor’s rating. Ranges in engagement ratings often spanned much of the scale, suggesting the course activities influenced student perceptions of engagement. shows individual student ratings throughout the semester, sorted and color-coded by the number of daily surveys completed by the student. Most students displayed variability in their responses which is desirable.
Fig. 1 Student average daily engagement ratings over the course of the semester. Blue dots are proportional to the number of student responses. Day 1 shows 27 out of 29 students. Day 39 shows 2 out of 29 students. Dotted lines represent the time with no engagement responses. The red, horizontal line represents the average daily student engagement rating over the course.
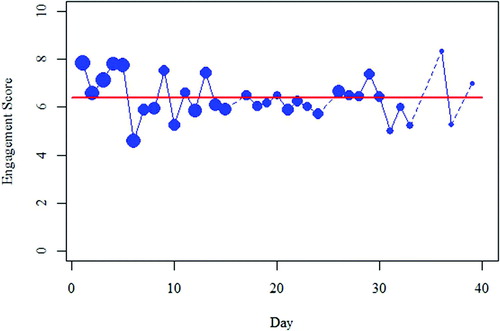
Fig. 2 Boxplots comparing student engagement ratings over the course of the semester sorted by student response rate. Response rate was categorized based on the number of daily surveys completed by the student. Very Low indicates fewer than 10 daily surveys, low indicates 10–14, moderate indicates 15–19, high indicates 20–24, and very high indicates 25 or more.
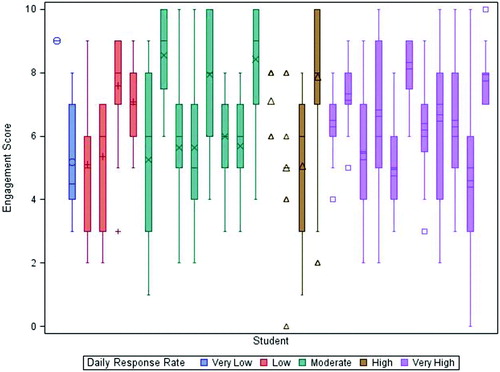
Table 1 Summary table of student daily engagement scores, final grades and professor daily engagement score.
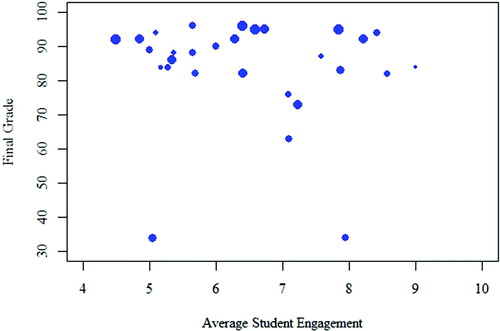
The average final grade in the course was a B (mean = 83.15, SD = 15.64), where the minimum and maximum grades are omitted from to further mask the data. Two students earned Fs and one student earned a D. There were no withdrawals. At the end of the semester, students reported a score for the overall course engagement. On average, students rated the course engagement 1 point higher at the end of the semester than the average of their daily engagement scores throughout the semester (n = 21, mean = 7.43, SD = 1.4). The relationship between a student’s end of semester engagement rating and their final grade was investigated (). In general, final grade seems fairly evenly distributed amongst the overall engagement ratings of 6, 7, 8, and 9 with a few students who do not quite follow the typical trend. A correlation test showed that there is no significant relationship between end of semester engagement rating and final grade (, p = 0.96). This was slightly surprising since one might assume a relationship between student engagement and course grade.
Fig. 3 Scatterplot comparing average daily engagement scores versus final grades for each student. Points are proportional to each student’s response rate where larger dots indicate more frequent ratings. Note that the axes do not represent the entire possible range for each variable to show more detail in the data.
3.2 Engagement by Day
As previously mentioned, depicts the average daily engagement scores across the semester, where the size of the point indicates the number of student responses. Overall, most students participated in the study at the beginning of the semester and levels varied somewhat throughout the semester. Of interest, the instructor rated eleven class days (33.3% of non-exam days which were rated by the instructor) a 10. Comparatively, there were 22 class days (64.7% of the non-exam days which were rated by students) in which at least one student rated the engagement a 10. However, of the 587 student daily ratings, there were only 44 (7.5%) student ratings of 10. All of the ratings of 10 came from 11 distinct students.
3.2.1 High Engagement Days
To better understand the types of activities that students find engaging, highlights from days on which student ratings were highest are provided below. The engagement scores for these days were more than 1 point above the overall median, thus 7.3 or above. Students’ comments and the instructor’s notes from the day are reported to illustrate what classes looked like and to help understand what students thought was engaging from each class. Class Days 1, 4, 5, 9, 13, and 29 received the highest student engagement scores over the course of the semester and had more than 50% of students responding to the survey. Interestingly, all of these days with the exception of Day 29 were in the first half of the course. Day 36 had the highest overall engagement score 8.33 (SD = 1.53), but there were only three responses on this day. This class period was an in-class project work day.
On Day 1 (introductory randomization activity), students on average reported an engagement level of 7.86 (n = 28, SD = 1.6). Of the days that had a response rate greater than 50%, Day 1 received the highest rating of the semester, and the instructor reported the following engagement activities during that class period: viewing of “This is Statistics” video (“Why You Need to Study Statistics” Citation2015) and a hands-on simulation-based activity to illustrate statistical inference using note cards. In terms of engaging activities, over 70% of the student comments mentioned the hands-on card activity used to model a scenario of gender discrimination with pilots from Day 1 (Starnes, Yates, and Moore Citation2010). Further, 30% of the comments discussed group work and 19% referenced SAS. Surprisingly, only three students specifically mentioned the video in their comments. A few student comments regarding these findings:
“Using statistics to determine whether or not there was gender discrimination involved in a hiring process was interesting and engaging,” engagement rating 8
“Working within groups and discussing our results with other groups made the class very engaging today,” engagement rating 10
“Using the cards was helpful to visualize statistics. Also, following along on SAS was helpful,” engagement rating 7
On Day 4 (SAS introduction and activity), the student average engagement score was 7.83 (n = 23, SD = 1.99). This day was the second highest rated day with a response rate over 50% and entailed a short introduction to SAS followed by students working independently through a SAS tutorial. Students overwhelmingly commented regarding SAS in 19 of the 21 comments, appreciating both the detailed coding instructions as well as the time to practice on their own. Student comments included:
“I loved the fact that we were able to work on our own learning how to use SAS. I found this extremely helpful and fun!” engagement rating 10
“Learning how to use SAS on our own,” engagement rating 8
“Working with the group on SAS,” engagement rating 8
The next highest rated days were 5 (randomization activity), 9 (hypothesis testing examples), 13 (types of errors), and 29 (least-squares regression part 2) with engagement scores of 7.72 (n = 25, SD = 1.74), 7.5 (n = 18, SD = 2.09), 7.42 (n = 19, SD = 1.71), and 7.35 (n = 17, SD = 1.9), respectively. These class days were characterized as an entire class period activity that introduced hypothesis testing using a randomization-based approach (Rossman and Chance Citation2008) (Day 5), class time to work through examples and do a p-value sing-a-long (Lesser Citation2005) (Day 9), an interactive, discussion-based lesson on Types of Errors (Day 13), and simple linear regression and correlation guessing games (Day 29). Students commented on the following aspects of those classes:
“Creating the data ourselves is better than just copying and pasting it into SAS,” Day 5, engagement rating 9
“Video explaining p-value was helpful,” Day 9, engagement rating 7
“Much more time for interaction between peers,” Day 13, engagement rating 8
“Liked the games today,” Day 29, engagement rating 10
3.2.2 Moderate Engagement Days
The majority of class periods (56.4%) fell within 1 point of the median engagement score, that is, within the range of 5.3–7.3. The instructor reported a variety of types of engagement on these days. An assortment of engagement methods was located through the Consortium for the Advancement of Undergraduate Statistics Education. These included viewing statistical music videos and cartoons (CAUSE; Landers Citation2006; Tate Citation2008; Posner Citation2013), participating in statistical sing-a-longs (CAUSE; Lesser Citation2006, Citation2013), and viewing virtual poster presentations from the Electronic Undergraduate Statistics Research Conference (CAUSE). Other engagement methods included standard pedagogical tools such as working on examples independently, performing hands-on and virtual simulations, viewing applet demonstrations, participating in class discussions of statistical concepts or student example work, reviewing for exams, and participating in project work days. The instructor also incorporated playing a statistical Bingo game (Instructor-created activity), performing SAS demonstrations and working independently with SAS, engaging in a card activity for p-values (Eckert Citation1994), and viewing news articles and job advertisements related to statistics.
Some activities in this time period were well-received by some students. For example, some students gave engagement scores of 9 or 10, these are the activities these students highlighted in their survey responses:
“Working through formulas and programs together, the song at beginning of class,” (Day 2—descriptive statistics part 1)
“examples, notes, cartoon,” (Day 3—descriptive statistics part 2)
“Card hypothesis matching human intuition with the p-value scale… that was engaging,” (Day 8—introduction to formal hypothesis testing)
“Great, like how you tied this activity to a previous one in class. Made things a lot more clear. Everything made sense. Gold star.” (Day 12—classical approach)
“Great class today! Very engaging, loved the [undergraduate] stats poster project conference!” (Day 17—confidence intervals part 2)
“Seeded and unseeded clouds was interesting but hard to follow with the idea of using log and e” (Day 19—log transformations)
“Analyzing stats about Elon students was interesting,” (Day 22—inference for proportions part 2)
“I liked the online activity as well as solving the table by ourselves. Much fun. Good good,” (Day 26—ANOVA part 2)
“Cigarette study interesting,” (Day 28—scatterplots, correlation, and least-squares regression part 1)
“Projects and presentations were cool as they demonstrated what everyone had learned during the semester,” (Day 39—student presentations)
Some comments from students who rated this same time period with an engagement rating of 4 or less are included below:
“I think I would feel more engaged, had I not taken so many statistics courses already,” (Day 2—descriptive statistics part 1)
“Brainstormed with our neighbors about stats vocab, took notes,” (Day 2—descriptive statistics part 1)
“Working together on examples in notes,” (Day 3—descriptive statistics part 2)
“Today was a little too note heavy!” (Day 8—introduction to formal hypothesis testing)
“Card activity was super engaging,” (Day 8—introduction to formal hypothesis testing)
“Just took notes,” (Day 12—classical approach)
“The meme was engaging, and beyonce references,” (Day 12—classical approach)
“The house activity was interesting,” (Day 17—confidence intervals part 2)
“Note taking which wasn’t engaging,” (Day 28—scatterplots, correlation, and least-squares regression part 1)
Additionally, these comments show that even if students found a particular aspect of class to be engaging, such as a card activity, that did not necessarily influence their overall perceived level of engagement for that class period.
3.2.3 Low Engagement Days
Class Days 6, 31, 33, 10, 37, and 24 received the lowest student engagement ratings. Day 6 (sampling distributions and Central Limit Theorem) received the lowest average student engagement score of 4.58 (n = 26, SD = 2.34). The instructor reported students were walked through a virtual simulation in Fathom on sampling distributions and that the central limit theorem applet did not work, so the professor demonstrated through StatCrunch. Despite the applets and simulations, there was a lot of class lecture on these days. In anticipation of completing more tedious material on this day, the instructor brought in candy to share with the class. Student comments included:
“Lots of definitions: statistic, sampling distribution, parameter, population mean and median, null hypothesis, test statistic, …,” engagement rating 8
“No hands on activities,” engagement rating 3
“We only watched and took notes today,” engagement rating 3
“I enjoyed the history lesson on how we have modern stats. Too many notes,” engagement rating 6”
“Candy and interactive graphs,” engagement rating 2
While the level of engagement was low on Day 6, students still found aspects engaging: notably, the history lesson and examples. The candy however might have caused students to rate the class higher than they otherwise might have.
For Day 31 (coefficient of determination, prediction/confidence intervals for regression), the average engagement score was 5 (n = 9, SD = 2.45) and the professor reported a lecture heavy class period with some examples that students worked on independently. Day 33 (multiple linear regression part 2) rated a 5.22 (n = 9, SD = 2.49) and the professor noted that students worked on their own to interpret a SLR using previous class notes, a demonstration of changes in R2, and SAS examples of forward and backward selection. Day 10 (two-sided alternatives and proc ttest in SAS) received a 5.25 (n = 20, SD = 2.45) and the professor indicated class time was spent on a hypothesis testing worksheet, calculations of t-based probabilities in SAS, and using SAS procedures to conduct a hypothesis test. There was a fairly even mixture of lecture and independent work this day. Day 37 (assumptions for regression) only received four responses (mean = 5.25, SD = 2.06). The professor reported engaging activities for this day as some independent SAS coding and exercises. Lastly, Day 24 (chi-squared example and ANOVA part 1) was rated 5.71 (n = 17, SD = 1.57) and the professor believed a chi-square test exercise on prison sentences, an applet demonstrating ANOVA, and using SAS were engaging for students. Student comments over these days include:
“Lecture was fairly dull,” engagement rating 3 (Day 31)
“Moved kind of quick with SAS code,” engagement rating 6 (Day 33)
“A ton of notes,” engagement rating 2 (Day 10)
“We did a final practice problem,” engagement rating 4 (Day 37)
“Not many interactions with neighbors, lecturing only,” engagement rating 5 (Day 24)
3.3 Relationship between Student and Professor Engagement
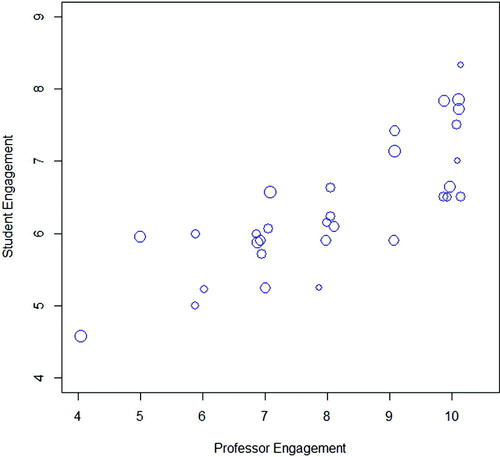
shows the relationship between the professor and average student daily engagement rating for each day. A correlation test confirms a significant strong, positive linear relationship (r = 0.78, p < 0.0001) between the daily professor and student average engagement rating indicating that as professor ratings increase, student ratings also increase. Based on the size of the points in , engagement ratings tended to follow a similar pattern regardless of whether or not high percentages or low percentages of the class responded to the survey each day.
Fig. 4 Jittered scatterplot comparing professor (x-axis) versus student average engagement (y-axis) where each point represents a day, proportional to the student response rate. Note that the axes do not represent the entire possible range for each variable to show more detail in the data.
3.4 Summary of End of Semester Responses
The end of semester survey that students were asked to complete included additional questions regarding their impressions of the overall course engagement. shows that over 80% of respondents believed the course engagement was “very” or “somewhat helpful” in helping them understand the course material. For each of the response categories in , the average daily engagement score is reported based on the average daily scores provided by students who selected that response. Students who viewed the course engagement as “very helpful” had the highest average daily engagement scores. However, the students in the “somewhat helpful” category had lower average daily engagement scores than the students in the “neither helpful nor unhelpful” response category. Though, it should be noted that samples sizes were small, the response was based on matter of opinion, and evaluating helpfulness could vary based on what a student considered to be course engagement. Differences in average daily ratings were not detected based on student rating of engagement and perceived helpfulness (, p = 0.36).
Table 2 Summary of student responses to the item: “To what extent did the course engagement help you better understand the course material?”
shows that more than 85% of respondents agreed that in order for a lesson to be engaging, it must also be entertaining. The exact meaning of “entertaining” was not specified and likely varies for each respondent. However, designing an entertaining lesson could pose a challenge for some topics that require prior explanation of basic concepts. Again, we see that average daily ratings were lowest for the students in the “somewhat agree” category. These ratings are lower than the ratings for students in the less extreme category of “neutral.”
Table 3 Summary of student responses to the item: “To what extent do you agree with the following statement: in order for a lesson to be engaging, it must also be entertaining.”
Finally, students were asked to select the types of activities in the course that they found engaging. Respondents were not limited in their number of selections. shows that 70% of respondents thought performing simulations, having class time to work independently of instructor, and listening to statistical music were engaging activities. Interestingly, 65% of respondents thought hearing the instructor’s personal stories was also engaging. Viewing applets was lower than expected, with only 40% of respondents choosing it as an engaging activity. Most surprisingly was that only 15% of respondents thought that viewing student presentations was engaging.
Table 4 Counts and percentages of students who were asked to select which activities they found engaging (n = 21).
4 Discussion
4.1 General Discussion
The goal of this study was to better understand how students view the engagement in an introductory statistics class. To understand student perceptions of engagement, student engagement based on day was examined in the categories of student ratings of high engagement, moderate engagement, and low engagement. Unsurprisingly, students viewed days with lecture as less engaging. However, it is noted that the dispersion of class days that students found engaging did have some patterns with higher engagement ratings earlier in the semester (, p = 0.33). This could indicate that students are more engaged when the material is relatively easier and less engaged when the material becomes more challenging. There were also activities that the instructor viewed as engaging that were not mentioned by students or did not receive high scores. For example, class time to work on projects did not seem to be viewed by students as “engaging.” To remedy this, some more explicit project work day instructions may be useful in the future. For example, instructions to generate a certain type of graph with one paragraph of commentary or to create a table with specific summary or inferential information in it by the end of the class period may help students feel more engaged in these open-ended project work days. It could also be that project work days had less structure than typical class days. Therefore, students did not perceive project work days and perhaps presentation days as engaging because they were not being explicitly engaged by the instructor during those times.
On Day 27, the instructor brought in a news article about SAS and an advertisement for a statistics-related job to share with students. Interestingly, no students mentioned these in the comments. These items were shown and discussed at the beginning of class, so it may be that smaller forms of engagements/statistical illustrations have little impact. However, if these smaller illustrations were done on a regular-basis, students may be more meaningfully engaged by them or if students were asked to bring these items in to class. In terms of responses on high engagement days, two of the three randomization activities occurred on the days with the highest levels of student-reported engagement. This hints toward later findings that indicated students equate engagement with entertainment as these activities are usually well-received by students. Higher engagement on days with randomization activities also relates to the end of semester item where students identified the activities that they found engaging in the class. On the end of semester survey, performing simulations tied with working through problems independently and listening to statistical music (70%).
On the end of semester survey, students reported a higher score for the overall engagement in the course than the average of their reported daily scores. This could indicate that in retrospect, the cumulative engagement is viewed as more meaningful. All students saw course engagement as either beneficial or neutral to helping them understand the course material as seen in . It is interesting to note that students who viewed it as “very helpful” had the highest average daily and end of semester ratings. These students also earned grades of B + or better. Of the students who responded to this question, the students with the highest 9 final grades in the class viewed the engagement as either “very helpful” or “somewhat helpful.” While students’ perceptions of the helpfulness of the course engagement was positive, not all course engagement was aimed at increasing content knowledge, such as the “This is Statistics” video (“Why You Need to Study Statistics” Citation2015) or the statistics job advertisement. Additionally, while students indicated that they perceived the course engagement as being helpful, this study did not explore the actual impact of methods of engagement on student learning outcomes. Looking at , all students were on the agree or neutral side that a class has to also be entertaining to be engaging.
The methods of engagement that students identified connected with previously mentioned results. Some of the overall patterns in of what students viewed as engaging were surprising. Most surprising of all, fewer than half the students surveyed selected the engagement items of “viewing applets” and “class time to view student presentations.” However, it is interesting to note that while items like “listening to statistical music” and “watching statistical videos” were popular on this survey, these items did not receive many comments in the daily engagement surveys. “Listening to instructor’s personal stories” was selected by a majority of respondents. Of note, these stories may or may not have always been related to statistics. The authors hypothesize that this relationship may be due to the fact that personal stories are often interesting and the research above indicates that students equate entertaining with engaging. In addition, personal stories can help professors and students relate to each other.
As expected, participation in the daily survey steadily declined over the course of the semester. Also, students provided comments that were not always in alignment with the engagement rating, such as “The house activity was really interesting,” (engagement rating 3), “Lots of definitions: statistic, sampling distribution, parameter, population mean and median, null hypothesis, test statistic, …” (engagement rating 8) and “Card activity was super engaging,” (engagement rating 3).
The authors also expected to find a positive relationship between students’ final grades and their end of semester engagement rating, because it was anticipated that students who were more engaged would do better in the course. Based on our case study, there was no evidence of a relationship between final grade and end of semester engagement rating. Similarly, there was no evidence of a relationship between final grade and average daily rating either. This could indicate that high ratings are not solely being driven by students who are academically strong.
4.2 Instructor Perspective
The comments in this section are from the perspective of the teacher of this course and as an author of this article.
There were many findings that surprised me. Most of those are mentioned in Section 4.1 related to the general discussion of our findings. However, I wanted to address my use of personal stories in the classroom as I use the same stories most semesters. In particular, we use a dataset on the pH of a steer carcass and the time after slaughter (Ramsey and Schafer Citation2013). It is a fairly depressing topic even if you like steak, but I always share the story of the time I was playing cards at my cousin’s house when his cow gave birth to twins. In addition, I bring in the end of visit summaries from my daughters’ doctors visits to show them z-scores and percentiles. The doctors visit summaries are then usually accompanied by a story about my daughters’ recent shenanigans. In addition, when we collect random samples from a giant box of beads that I have prepared to simulate the sampling distribution of the sample proportion, I relate the color of the beads to represent male and female Cane toads and share several highlights with students about the documentary that I watched on Cane toads. These personal stories do not take an immense amount of time in class, but I find that students are more interested when I have shared something personal about myself.
The most surprising result of the study for me was that students did not find project work days or project presentations to be the highest forms of engagement. Similarly, entire days spent working independently were not rated ten across the board by students. As a professor, I mostly perceived engagement to be synonymous with working independent of the instructor (either alone or in small groups). It may be that on some level the professor needs to scaffold student engagement to keep them interested, on-task, and engaged in the day’s assignment.
In addition, I was not surprised that students associated entertainment with engagement. I often accomplished this by having a fun theme to the data or a joke (often preplanned). Throughout this study, I also sought out statistical songs and music videos, which I also enjoyed. Most of the activities I used in this semester were not new to me. Some of the new forms of engagement that I sought out while conducting this study were statistical cartoons, songs, videos, and news articles. These were tools that I rarely brought in to the class prior to this semester.
For me, the greatest result of this research project was being conscious about the engagement in my class. In particular, participating in this project forced me to enhance my teaching and refresh my presentation of material. For this reason alone, I would encourage other statistics educators to conduct a similar self-study to take the time to improve and find new ways to engage students in the classroom.
4.3 Student Perspective
The comments in this section of the article are from a student and the coauthor of this article. This student was a member of another course in which the same professor collected feedback on student engagement (not published in this report).
As a student in another course (design of experiments) taught by the same professor, taking the daily survey (in a class which is not the focus of this study) made me think more critically about how class time was spent. A lot of what I found interesting has already been addressed in Section 4.1, however I will touch on aspects relating to a student perspective in particular.
I know for myself personally, my perceived level of engagement is correlated with how interesting I find the particular task to be. Additionally, I think that the perceived difficulty of the content relates to the level of engagement and that is definitely a question to be addressed in future research. For the most part, my views align with the results in as I consider simulations and independent work time to be some of the most engaging ways to spend a class period. Although not necessarily related to class material, I always enjoyed hearing the professor’s personal anecdotes. It is easy to forget that your professors are real people too and listening to their stories and experiences helps develop a relationship and makes them more relatable. It is also nice to be reminded of statistics in the real-world and to hear a professional’s experiences in the field.
I was not at all surprised to see that in general, students did not find class time spent viewing presentations to be very engaging. This is true for me personally, especially if I do not find another group’s topic very interesting. While this is challenging to overcome and presenting gives students additional skill sets, presentations could be made more interesting by ensuring no two groups research the same topic. I was however a little surprised that viewing applets did not rate higher, as they are an interactive way to build conceptual knowledge and visualize an abstract concept.
For myself, incorporating unique, real-world datasets throughout the course will be one of the most lasting aspects of engagement. I will continue to associate certain real-world datasets with certain experimental designs. If I wanted to create a complete block design I would think back to the finger tapping data, or the diabetic dog data for a split plot/repeated measures design (Cobb Citation2008). While they may be odd, there is something to be said for unique, real-world data that can help students understand concepts and most importantly, retain them moving forward.
4.4 Future Research
This was a small case study, from one section of one professor’s introductory statistics class, from one university, so generalizations to larger populations may not be applicable. In addition, student responses were voluntary and the nature of the engagement of the course material may have additionally impacted the ratings students gave in the class or even the willingness to complete the daily engagement surveys. Given that, some additional research on student perceptions of engagement in introductory statistics would be valuable. One specific recommendation for a similar or extended version of this study would expand upon where students would be additionally asked “How does this course compare in difficulty to other courses you’ve taken?” or to have students also rate the difficulty of the material on each class day, in addition to their rating of the engagement. The authors believe there is likely a relationship between perceived difficulty and what is viewed as engaging. It is reasonable to believe that a harder course or a harder lesson might be viewed as less engaging. Additionally, investigating whether or not the timing in a class period of an engaging activity (at the beginning, middle or end) affects the engagement score, would be helpful in the future. Another avenue of research would be investigating perceived engagement in upper-level major courses as expectations for engagement could vary based on interest in topic.
References
- ——— (2008), “Sampling Distribution Simulation,” Rice Virtual Lab in Statistics, available at http://onlinestatbook.com/stat_sim/sampling_dist/.
- Aliaga, M., Cobb, G., Cuff, C., Garfield, J., Gould, R., Lock, R., Moore, T., Rossman, A., Stephenson, B., Utts, J., Velleman, P., and Witmer, J. (2005), Guidelines for Assessment and Instruction in Statistics Education (GAISE): College Report, USA: American Statistical Association, available at http://www.amstat.org/education/gaise/GaiseCollege_Full.pdf.
- Brophy, C., and Hahn, L. (2014), “Engaging Students in a Large Lecture: An Experiment Using Sudoku Puzzles,” Journal of Statistics Education, 22, 1–20. DOI: 10.1080/10691898.2014.11889690.
- Carnell, L. J. (2008), “The Effect of a Student-Designed Data Collection Project on Attitudes Towards Statistics,” Journal of Statistics Education, 16, 1–16. DOI: 10.1080/10691898.2008.11889551.
- Cobb, G. W. (2008), Introduction to Design and Analysis of Experiments (1st ed.), Hoboken, NJ: Wiley.
- Consortium for the Advancement of Undergraduate Statistics Education (CAUSE), available at https://www.causeweb.org/cause/.
- Eckert, S. (1994), “Teaching Hypothesis Testing With Playing Cards: A Demonstration,” Journal of Statistics Education, 2, 1–3.
- Emmioğlu, E., and Capa-Aydin, Y. (2012), “Attitudes and Achievement in Statistics: A Meta-Analysis Study,” Statistics Education Research Journal, 11, 95–102.
- Froelich, A. G., Stephenson, W. R., and Duckworth, W. M. (2008), “Assessment of Materials for Engaging Students in Statistical Discovery,” Journal of Statistics Education, 16, 1–29. DOI: 10.1080/10691898.2008.11889561.
- GAISE College Report ASA Revision Committee (2016), “Guidelines for Assessment and Instruction in Statistics Education College Report,” available at http://www.amstat.org/education/gaise.
- Landers, J. (2006), “Cartoon: Boxplots,” CAUSE, available at: https://www.causeweb.org/cwis/r1626/cartoon_boxplots.
- Lesser, L. M. (2005), “What P-Value Means,” CAUSE, available at: https://www.causeweb.org/cause/resources/fun/songs/what-p-value-means?id=86.
- Lesser, L. M. (2006), “Song: What P-Value Means,” CAUSE, available at: https://www.causeweb.org/cwis/r1248/song_what_p-value_means.
- Lesser, L. M. (2013), “Song: Mean,” CAUSE, available at: https://www.causeweb.org/cwis/r2210/song_mean.
- Malloy, T. (2000), “Understanding ANOVA Visually,” University of Utah, available at: http://web.utah.edu/stat/introstats/anovaflash.html.
- Neumann, D. L., Hood, M., and Neumann, M. M. (2009), “Statistics? You Must be Joking: The Application and Evaluation of Humor when Teaching Statistics,” Journal of Statistics Education, 17, 1–16. DOI: 10.1080/10691898.2009.11889525.
- Neumann, D. L., Hood, M., and Neumann, M. M. (2013), “Using Real-Life Data When Teaching Statistics: Student Perceptions of This Strategy in an Introductory Statistics Course,” Statistics Education Research Journal, 12, 59–70.
- Peck, R., Casella, G., Cobb, G. W., Hoerl, R., Nolan, D., Starbuck, R., and Stern, H. (2006), Statistics: A Guide to the Unknown, Belmont, CA: Thomson, Brooks/Cole.
- Pfaff, T. J., and Weinberg, A. (2009), “Do Hands-on Activities Increase Student Understanding?: A Case Study,” Journal of Statistics Education, 17, 1–34. DOI: 10.1080/10691898.2009.11889536.
- Posner, M. (2013, February 27), “Stats Can Be Cool You See I (Official Video, Based on Mike Posner’s Cooler Than Me” [Video file], available at https://www.youtube.com/watch?v=4rKQtDb4VjU.
- Ramsey, F. L., and Schafer, D. W. (2013), The Statistical Sleuth (3rd ed.), Boston: Brooks/Cole Cengage Learning, pp. 179–180.
- Rossman, A. J., and Chance, B. L. (2008), “Concepts of Statistical Inference: A Randomization-Based Curriculum,” available at http://statweb.calpoly.edu/csi.
- Schau, C., Stevens, J., Dauphinee, T. L., and Del Vecchio, A. (1995), “The Development and Validation of the Survey of Attitudes Toward Statistics,” Educational and Psychological Measurement, 55, 868–875. DOI: 10.1177/0013164495055005022.
- Sproesser, U., Engel, J., and Kuntze, S. (2015), “Raising Self-Concept and Interest for Statistics Through Activity-Based Instruction,” International Association for Statistical Education, Satellite: Advances in Statistics Education, July 2015, Rio de Janerio, Brazil, pp. 1–5, available at http://iase-web.org/documents/papers/sat2015/IASE2015\%20Satellite\%2029_ENGEL.pdf.
- Starnes, D. S., Yates, D., and Moore, D. S. (2010), The Practice of Statistics (4th ed.), New York: W. H. Freeman.
- Tate, C. (2008), “Video: statz 4 Life,” CAUSE, available at https://www.causeweb.org/cwis/r1759/video_statz_4_life.
- [This is Statistics] (2015, April 2). “Why You Need to Study Statistics” [Video file], available at [This https://www.youtube.com/watch?v=wV0Ks7aS7YI.
- Vanhoof, S., Castro Sotos, A. E., Onghena, P., Verschaffel, L., Van Dooren, W., and Van den Noortgate, W. (2006), “Attitudes Toward Statistics and Their Relationship with Short- and Long-Term Exam Results,” Journal of Statistics Education, 14, 1–17. DOI: 10.1080/10691898.2006.11910588.
- Vickers, A. (2009), What Is a P-Value Anyway? 34 Stories to Actually Help You Understand Statistics (1st ed.), Boston; London: Addison-Wesley.
Appendix A
Daily Survey
What is your student ID number?
Rate the level of engagement in today’s class only.
List the activities or types of activities that you considered engaging in today’s class.
Appendix B
End of Semester Survey
State your assigned ID number.
On a scale of 1–10, how do you rate the overall engagement in this class?
What were your expectations or definition of “engaged learning” prior to this class?
Did your expectation or definition of “engaged learning” change during this class? If yes, please explain how.
In what ways did this class meet your expectations of engaged learning?
In what ways did this class not meet your expectations of engaged learning?
Based on your other course experiences at Elon University, how does this course compare to the engagement in your other classes:
Much less engaging
Somewhat less engaging
Similar level of engagement
Somewhat more engaging
Much more engaging
To what extent did the course engagement help you better understand the course material:
Very unhelpful
Somewhat unhelpful
Neither helpful or unhelpful
Somewhat helpful
Very helpful
To what extent do you agree with the following statement: In order for a lesson to be engaging, it must also be entertaining.
Disagree
Somewhat disagree
Neutral
Somewhat agree
Agree
What are the activities in this course that you considered engaging? Check all that apply
Performing simulation studies with note cards, beads, or using computer programs (like R)
Viewing applets
Class time to work through problems independent of instructor
Class time to discuss concept questions (like, would you expect to obtain a large or small p-value based on this graph) with a neighbor
Class time to work on projects
Class time to view student presentations
Class time to practice writing SAS code
Watching statistical videos
Listening to statistical music
Viewing statistical cartoons
Listening to instructor’s personal stories
Hearing statistics jokes
Hearing nonstatistical jokes
Learning about statistical history
Other