
Abstract
We designed a sequence of courses for the DataCamp online learning platform that approximates the content of a typical introductory statistics course. We discuss the design and implementation of these courses and illustrate how they can be successfully integrated into a brick-and-mortar class. We reflect on the process of creating content for online consumers, ruminate on the pedagogical considerations we faced, and describe an R package for statistical inference that became a by-product of this development process. We discuss the pros and cons of creating the course sequence and express our view that some aspects were particularly problematic. The issues raised should be relevant to nearly all statistics instructors. Supplementary materials for this article are available online.
KEYWORDS:
1 Introduction
Online education continues to put pressure on brick-and-mortar institutions to deliver on the promise of a better life for our graduates. At our institutions—which according to CollegeData.com have an average annual cost of attendance of $71,156.25—ever-increasing sticker prices are justified by the promise of personalized academic instruction from world-renowned scholars, a vibrant residential experience, awe-inspiring facilities, and membership in exclusive and lucrative alumni networks. While the high cost of attendance at our private schools and others is highly variable based on a student’s personal circumstances, these high sticker prices face downward pressure from several factors. Obama-era policies focus on a value versus cost argument that tends to favor inexpensive, high-performing public institutions. Trump-era policies tax high private endowments and relax restrictions on for-profit institutions. Most inescapably, it seems increasingly plausible that the breadth, convenience, low cost, and low barrier to admission of online education—particularly in computer science and data science fields—in some settings makes up for the aforementioned benefits of private education.
Although we have had experience teaching on a variety of online learning platforms, including Coursera, edX, and Statistics.com, this article focuses on our experience with DataCamp. DataCamp is an online learning platform whose curriculum is centered around data science, specifically targeting coding skills in R, Python, and SQL. In addition to the usual online experience of watching videos and answering multiple choice questions, DataCamp provides an interactive, browser-based coding environment, wherein students get instant feedback as they work through exercises. DataCamp courses are asynchronous and self-paced, so once a course in published, there is no instructor involvement and no deadlines for the student to worry about.
In this article, we reflect on our experience designing an eight-course sequence that comprises the Statistics Fundamentals with RFootnote1 and Statistical Inference with R skills tracks on DataCamp. In Section 2, we outline the topics covered in the course sequence, which is designed to approximate the vast majority of the one-semester introductory statistics courses offered at our institutions (and many others). In Section 3, we discuss the trade-offs between brick-and-mortar versus online learning, and illustrate how these DataCamp courses can be successfully integrated into a typical course. We delve further into pedagogical concerns in Section 4. In Section 5, we discuss infer, an R package for statistical inference that emerged as a by-product of our course development. We reflect on the process of creating content for DataCamp in Section 6, and conclude with final thoughts in Section 7.
2 Our Introductory Statistics Sequence
Content at DataCamp is organized into courses. A course consists of four or five chapters, each of which contains 8–12 exercises. Each exercise is of one of three types: video, multiple choice, or coding. Thus, a typical course has 45–60 exercises and is designed to engage students for about 4 hr. Collections of courses can be organized into tracks, centered around a particular skill (e.g., Machine Learning with Python) or targeting a particular career (e.g., Data Scientist with R).
In the fall of 2016, we agreed to design a sequence of courses that originally comprised the Intro Statistics with R skills track. DataCamp subsequently split our eight course sequence into two four course sequences: Statistics Fundamentals with R, which focuses on descriptive statistics, and Statistical Inference with R, which focuses on inferential statistics. The Fundamentals track is contained within the longer Data Scientist with R and Data Analyst with R career tracks. While there are other DataCamp courses that are clearly sequenced, this was the first time that a team of instructors was hired to build an entire skill track. We wanted our courses to be coherent, and we agreed to split any royalties four ways, regardless of how many people took each course within the track.
While we did not expect our skills track to replace the introductory statistics courses at our institutions, we shared a desire to mimic those courses as much as possible, thus providing several benefits. First, it would enrich our courses by offloading much of the coding content to DataCamp, thereby allowing us to spend less time in class on both lectures and labs, leaving more time for working with students interactively. This would help us deliver on the promise of personalized instruction, and potentially even lighten our teaching loads by eliminating lab sections. Second, it would allow us to deliver this same benefit to other instructors all over the world who wanted to follow our curriculum. Our sequence brings some uniformity of instruction to institutions whose resources and focus on teaching vary widely.
We chose to mimic the content of the Diez, Barr, and Çetinkaya Rundel (Citation2014) textbook as much as possible, since three of us use it in our courses. Like Lock et al. (Citation2014) and Chance and Rossman (Citation2006), we wanted to include techniques for simulation-based inference to provide an intuitive introduction to inferential concepts. We also agreed to introduce multiple regression as a descriptive technique early in the track and return to inference for regression later. We discussed at length whether we should include probability as a course in the sequence, and while we were conflicted, we ultimately decided to leave it out, mainly due to constraints of time and space and the desire to have the track be a minimally self-supported set of courses with no prerequisites. All of our courses use R, and in particular, use a consistent syntax based on the tidyverse collection of R packages (Wickham Citation2017).
The Statistics Fundamentals with R skills track consists of the following courses:
Introduction to Data: Data types, factors, sampling, Simpson’s paradox, scope of inference, blocking, stratified sampling
Exploratory Data Analysis: Bar charts, proportions, boxplots, histograms, density plots, measures of center and spread, outliers
Correlation and Regression: Correlation, spurious correlation, simple linear regression, regression to the mean, interpretation of slope and intercept coefficients, model fit, leverage, influence, outliers
Multiple Regression: Parallel slopes models, interaction, Simpson’s paradox, multiple regression, parallel planes, logistic regression, odds ratios
The Statistical Inference with R track contains these courses:
Foundations of Inference: Hypothesis testing, randomization distributions, p-values, confidence intervals, Type I and II errors, the bootstrap
Inference for Categorical Data: Randomization and t-based inference for a single proportion and for a difference of proportions, randomization and chi-squared test for independence, chi-squared test for goodness of fit
Inference for Numerical Data: Bootstrap and t-based inference for a single parameter and for a difference in two parameters, central limit theorem, ANOVA
Inference for Regression: Simulation and t-based inference for regression, residual analysis, multicollinearity, inference for transformed variables
A second edition of Diez, Barr, and Çetinkaya Rundel (Citation2014) that supports the presentation of the introductory statistics material in this particular order is in the works. We should note that the DataCamp courses are designed to build and assess a student’s conceptual understanding of statistics—they are not just coding quizzes.
3 Using DataCamp in Your Course
As noted previously, a major attraction to us was the promise of incorporating the material from our DataCamp courses into our brick-and-mortar courses. In this section, we discuss the mechanics of how to incorporate DataCamp courses in a variety of different settings.
It is beyond the scope of this article to assess the relative merits of online versus in-person learning. However, it seems self-evident that a combination of the two could be greater than either alone.
There are several advantages to integrating DataCamp into a traditional course:
Cost: Typically, the first chapter in a DataCamp course is free, but for premium courses, the rest of the chapters require a paid membership. However, instructors can sign their class up for DataCamp for the Classroom, which enables a defined set of students to freely access all of DataCamp’s content for six months.
Scalability: Each additional student in your class requires extra time and effort from you to grade their assignments, meet with them during office hours, make room for them in the classroom, etc. Conversely, DataCamp will deliver content to an unlimited number of students asynchronously.
Instant feedback: Students receive instant feedback on the DataCamp coding exercises. This relieves some of their frustration and also frees the instructor from having to answer some of the frantic emails from students.
LMS integration: DataCamp for the Classroom provides modules for direct integration with many popular learning management systems (LMS), including Blackboard and Moodle. This means that you can assign students to complete a certain chapter or course by a certain deadline, and those marks will automatically feed back into your LMS, showing each student’s grade.Footnote2 You can also download a spreadsheet of all of your students’ progress through all of DataCamp’s course content.
Scope: When students have questions about material that is outside the syllabus, you can point them toward another DataCamp course that covers that material. As long as they access DataCamp through the Classroom, all content should be available for free. This can dramatically increase the scope of what students can learn in your course, without putting any additional burden on you.
In our courses, we will often assign the completion of a DataCamp course as a homework assignment. For example, as we begin a two-week unit on bivariate relationships, we would assign the Correlation and Regression course and give students one week to complete it. Using the LMS integration, the percentage of the course that each student completes by the deadline would register automatically for both the student and instructor to see. No additional grading is necessary. We would then assign a written homework assignment that does not require a computer but focuses on conceptual and practical understanding of the material. The second assignment requires grading but might be shorter than it would otherwise be, since much of the material was covered in the online course.
The notion of DataCamp courses as supplementary learning materials in a brick-and-mortar classroom is particularly attractive. In an introductory statistics course, we might assign all eight courses in the tracks to all students over the course of the semester. In a second course in statistics, different groups of students might benefit from different DataCamp courses. All students might want to refresh their understanding of a certain topic. First-year and transfer students, or students who took their introductory statistics course in another discipline (where R use is less common) might find these courses helpful not only to refresh their understanding of statistics, but also to learn how to use R. Those familiar with R, but not with the tidyverse, might find these courses useful in learning the new syntax. Additional DataCamp courses, such as “Reporting with R Markdown” can be useful, in this case for helping students learn how to submit their homework in a reproducible format (Baumer et al. Citation2014).
DataCamp integration is not without its own challenges. First, the coding exercises are “interactive” in the sense that: (1) a live R session running in their browser will return results; (2) each incorrect answer will solicit a canned cagey response; and (3) canned hints are available upon request by the student. This is a far cry from actual interaction with a student teaching assistant or course instructor. Second, all simulations are done on the computer. Research supports the notion that tactile simulation (e.g., with playing cards, dice, balls, etc.) improves conceptual understanding among students (Holcomb et al. Citation2010; Roy et al. Citation2014; Hancock and Rummerfield Citation2020). Third, there is no mechanism for students to ask questions on DataCamp. We often use a class Slack team for this purpose.
4 Pedagogy
The four of us consider ourselves to be teachers first and foremost. As mentioned above, we set out to create this course sequence on DataCamp as a way of bringing our approach to statistics to a wider audience. We spent many hours thinking carefully about how we can most effectively communicate using a platform which is incredibly different from a brick-and-mortar classroom, regardless of the class size. We found that the pedagogical challenges for teaching and learning statistics online are quite large and different from the challenges one encounters when designing and teaching this material in person.
4.1 Pedagogical Challenges
Within our own classrooms, we rely on interactivity to drive discussion—as instructors we ask our students many questions, as students they regularly pause the discussion to ask for clarification or extensions to other ideas. We are able to anticipate many of the questions, and we have infused our DataCamp courses with consideration of standard queries. However, the “video-exercise-repeat” framework leaves some students with questions about particular aspects that do not get addressed. We recognize that the lack of interaction is an obvious disadvantage and one that would exist in any online platform, but we bring it up first to emphasize how much we value the face-to-face time we spend with our students in the brick-and-mortar classrooms.
There are additional aspects of the traditional classroom that cannot be captured by the DataCamp framework—pair-share work, tactile simulations (Holcomb et al. Citation2010; Roy et al. Citation2014; Hancock and Rummerfield Citation2020), and semester projects (Halvorsen and Moore Citation2001) are all techniques we use for helping students understand the introductory statistics material more deeply. For example, in the Inference for Numerical Data course we introduce constructing a confidence interval via bootstrapping for a median. The data are a sample of 20 one-bedroom apartments in Manhattan, scraped from Craigslist on one particular day. We purposefully start with a small sample—even though it would be straightforward to scrape a much larger number of apartments—to enable a tactile simulation in the classroom. In the brick-and-mortar classroom, we divide students into teams and each team receives a bag with 20 pieces of paper, each with the rent of a sampled apartment printed on it. Then, each team is asked to take a bootstrap sample of 20 apartments from their bag, calculate the median, and record it on the board by placing a dot on the dotplot. The process provides students with personal experience sampling with replacement in order to build a bootstrap distribution of sample medians. The tediousness of doing the entire thing by hand leaves students longing for a computational approach to speed up the process. While we only do a few of these tactile simulations throughout the semester, they serve as mileposts to which we refer back regularly as we introduce simulation in new inferential settings. The tactile experience is not possible to achieve on an online learning platform. On DataCamp the closest we were able to come to it was to explain the process and include screenshots of what sampling by hand would look like in the slides that accompany the videos. An alternative would be a video of the instructor conducting the tactile simulation. While the video would certainly be an improvement, it likely will not have the same effect as the tactile simulation that students get to experience first hand.
Some teaching strategies were not possible using the DataCamp platform, but we could see the platform expanding to incorporate such methods as it develops more sophisticated presentation capabilities. In particular, it was not possible to use the DataCamp platform to walk through using an applet to explain a particular concept. In our own classrooms, we use applets (see, e.g., Healy et al. Citation2003; Chance and Rossman Citation2019; Lock et al. Citation2019) on a daily basis to explain the abstract ideas associated with sampling distributions, power, p-values, and confidence intervals. However, the slides created for our DataCamp courses were required to be static (no videos, animations, or applets). Including screenshots of the applets did not seem worthwhile.
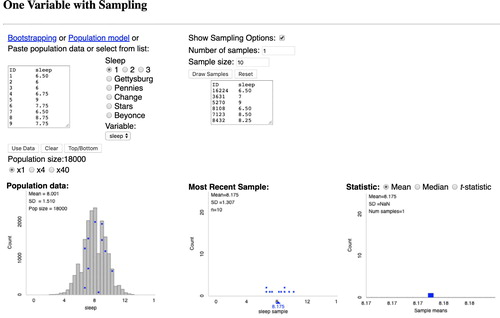
Along with the technological limitations of the DataCamp platform, we were unable to use some materials of great pedagogical value due to licensing issues. For example, the applets designed by Chance and Rossman (Citation2019) are protected under a copyright that makes them available for use in instructional settings, but not necessarily for embedding in a commercial product like our DataCamp courses. The applet shown in provides an excellent visualization for conceptualizing the differences between a population distribution, a sample distribution of the data, and a sampling distribution of the statistic. Such applets have been developed over many years through careful thinking and continual refinement, and are not trivial to reimplement. Thus, DataCamp courses cannot always build on the wealth of materials which are freely available to the educational community to help instructors break down complicated ideas for their students.
Fig. 1 Screenshot of the “One Variable with Sampling” applet from the Rossman/Chance collection.
In the classroom, we are accustomed to being able to dedicate 10–20 min to talking through topics that are particularly nuanced or abstract, such as the notion of a sampling distribution or statistical power. By contrast, a DataCamp video has a maximum length of around 4 min, and it is recommended that much of the video be spent discussing code. In part, this is a useful constraint; it coheres with the pedagogical philosophy of active learning and the DataCamp motto of “Learn by doing.” However, without a long-form lecture (or long-form reading), it is challenging to treat certain complex topics at the appropriate level of depth.
4.2 Pedagogical Advantages
We also recognize the strengths an online platform has for communicating introductory statistics concepts. First, having videos instead of an in-person instructor means that the student can stop the video, slow it down, and/or go back and repeat the video. That is, each student can take the ideas in at their own pace. Additionally, unlike in a standard classroom, a student can pause the video to look up a definition or contextualize an example. The process by which a student chooses their own pace and answers their own questions along the way leads to a deeper understanding of the material being covered.
The structure of the DataCamp course is to watch a video and then answer multiple choice or coding questions. Although the multiple choice questions cannot possibly ask students to write down their understanding “in their own words,” they do allow for an immediate self-assessment of whether the concept makes sense. Similarly, while the coding questions do not typically test intuitive understanding, they do allow for the student to practice applying statistical concepts, and they certainly build the students’ abilities in R.
5 The infer Package
How does one convey concepts through code?
In a traditional classroom setting, concepts are conveyed verbally through lecture or readings and often reinforced with examples and activities. Code, if it is used, serves as a tool to carry out an analysis. Writing code amounts to describing to a computer, in the computer’s own language, what you want it to do.
The DataCamp platform presents an intriguing challenge to this paradigm. Video lectures are required to be brief and to focus on preparing students to code, severely handicapping the ability to convey more abstract concepts. The instructor is left with the choice of foregoing conceptual understanding or trying to integrate the concepts into the code itself.
For teaching data visualization, this latter approach is made possible by the Grammar of Graphics (Wilkinson Citation2012), a principled framework for building data graphics. This grammar has been incorporated into several programming languages, most notably in the ggplot2 package for R (Wickham Citation2016). The result is code that reads less like instructions for a computer and more like a human’s decomposition of a complex graphic into meaningful components.
In our courses, ggplot2 was essential for teaching concepts of visualization through code. The dplyr package (Wickham et al. Citation2015) served a similar purpose for data wrangling. When we came to statistical inference, however, we could find no similarly expressive syntax. The most promising was offered by the mosaic package, which “provides a simplified and systematic introduction to the core functionality related to descriptive statistics, visualization, modeling, and simulation-based inference required in first and second courses in statistics” (Pruim, Kaplan, and Horton Citation2017). The guiding design principle of “less volume, more creativity” lessens the cognitive load involved in learning R while encouraging students to explore different descriptive and inferential questions using R’s formula interface. The result is code that is far more expressive of the underlying concepts than base R code.
Unfortunately, mosaic did not cover all of the procedures in which we were interested and was not natively built from the same design principles as ggplot2 and dplyr, so the transition between wrangling, visualization, and modeling was jarring. It was out of this need that we began work on a new package called infer (Bray et al. Citation2018).
5.1 Design of infer
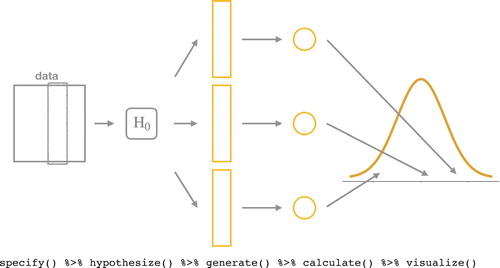
infer is built on the idea that most classical inferential techniques (e.g., hypothesis tests and confidence intervals) are variations on a single theme (Downey Citation2016). This theme, shown in , begins with the specification of the variables of interest, including indications of which variable will serve as the response in a bivariate setting. From there, one posits a model of the world: the null hypothesis (H0). That model is sufficient to generate multiple datasets that might be observed in that world. For each of these hypothetical datasets, one calculates a test statistic that bears on the question of interest. The collection of statistics represents the kind of statistics that one would observe in a world where H0 is true. The final step is to visualize this distribution of statistics and assess where the single observed test statistic falls to determine if the data is consistent with H0.infer encodes each of these steps as a function: specify(), hypothesize(), generate(), calculate(), and visualize(). These functions can be composed in different ways to carry out a broad range of inferential techniques.
Fig. 2 Statistical inference pipeline using infer. This diagram expresses the “there is only one test” philosophy in code.
5.2 An Example
As an example, consider a subset of the General Social Survey (gss, Gu Citation2014), which asked a representative sample of Americans if they considered themselves “happy” or “unhappy” and also asked them with which political party they affiliated. In the subset from 2016, the proportion of Democrats that report being happy is 70% and the proportion of happy Republicans is 79%.
Using dplyr, one could compute a two-way table with the following two lines of code:
two_way <- gss %>% group_by (party) %>% summarize (N = n(), p = mean(happy == “happy”)) two_way ## # A tibble: 2 x 3 ## party N p ## <chr> <int> <dbl> ## 1 dem 43 0.698 ## 2 rep 34 0.794
One might be interested in assessing the hypothesis that happiness is independent of political affiliation in the population at large. First, we use dplyr to compute the observed difference in proportion (i.e., the test statistic).
obs_diff_p <- two_way %>% summarize (diffp = diff(p)) %>% pull() obs_diff_p ## [1] 0.09644323
Given the sample size, is this 9.6 percentage point difference consistent with the hypothesis that happiness and political affiliation are independent?
5.2.1 A Permutation Test
In what follows, we use infer to simulate the null distribution of statistics under the independence hypothesis and visualize where the observed statistic falls in that distribution.
In a single pipeline, we can compute the null distribution using the infer verbs specify(), hypothesize(), generate(), and calculate(). Within each function are arguments where the researcher specifies the details of the particular procedure. The first argument to specify() is a formula, a common syntax in R for formulating a model; in this case, we’ll be modeling happy as a function of party. hypothesize() explicates the type of null hypothesis we are making. generate() permutes the dataset 1000 times, and calculate() computes a difference in proportionsFootnote3 for each of the corresponding 1000 permuted datasets. null_dist <- gss %>% specify (happy ∼ party, success = “happy”) %>% hypothesize (null = “independence”) %>% generate (reps = 1000, type = “permute”) %>% calculate (stat = “diff in props”, order = c(“rep”, “dem”))
We can now contextualize the observed difference in proportions within the null distribution using visualize() and the value of the test statistic we computed before.
null_dist visualize() + shade_p_value(obs_stat = obs_diff_p, direction = “both”)
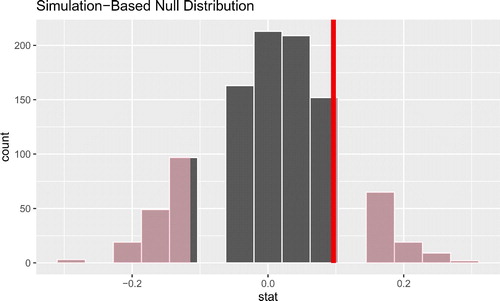
The output of this pipeline is a histogram (shown in ) of the distribution of permuted test statistics (differences in proportions), with an added layer that shades in the statistics that are more extreme than the observed statistic. The p-value can be obtained directly using the get_p_value() function shown below.
Fig. 3 Visualizing the p-value using infer and a permutation-based method. The area of the shaded histogram bars represents the p-value, while the solid red line indicates the value of the observed test statistic.
null_dist %>% get_p_value(obs_stat = obs_diff_p, direction = “both”) ## # A tibble: 1 x 1 ## p_value ## <dbl> ## 1 0.494
5.2.2 A Bootstrap Interval
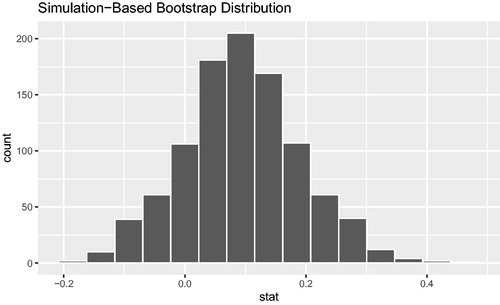
Because the infer syntax is expressive, small changes to the pipeline we developed above can reinforce the connections between tests and confidence intervals. Simply commenting out the hypothesize() step and changing the type argument to generate() from” permute” to” bootstrap” results in the bootstrap distribution show in . This allows students to visualize a confidence interval for the difference in proportions.
Fig. 4 Visualizing the bootstrap distribution for the difference in proportions using infer.
gss %>% specify(happy ∼ party, success = “happy”) %>% # hypothesize(null = “independence”) generate(reps = 1000, type = “bootstrap”) %>% calculate(stat = “diff in props”, order = c(“rep”, “dem”)) %>% visualize()
Please see Bray et al. (Citation2018) for more examples and further explication of the design philosophy behind infer and its current capabilities.
6 All the Feels
DataCamp and similar online learning platforms are continuously seeking new instructors to create, develop, and/or license content for their platform. In this section, we offer reflection and guidance to potential new instructors based on our experience of creating a DataCamp course. Our courses were solicited by our handler, a DataCamp content manager, but the company maintains apubliclistofcoursesindevelopment and accepts new course ideas. Our Appendix in the supplementary materials provides more details about the process of developing content, more of our reflective thoughts, and a short discussion of possible alternative platforms.
At least one peculiarity of the DataCamp content creation process has crossed over to our regular course development practice. When developing a DataCamp course, you write the solution code for the computing exercises first. Writing solutions up front felt foreign and counterintuitive to us at first, as if we were putting the cart before the horse. However, thinking through the code we expected students to write helped us focus on what R packages we were going to use (see Section 5) and in turn laid bare what we would have to cover in our videos. Since our courses were part of a sequence, we had to carefully coordinate the packages and syntax we used. Several of us have subsequently found ourselves using this paradigm to develop new contentFootnote4 for our brick-and-mortar courses.
All told, we experienced the full range of emotions from entering into a business relationship with a for-profit entity. On the plus side, the DataCamp platform provided us with an exciting and effective way to teach material in an online format and to deliver it to thousands of people. Compared with other academic “side hustles,” being a DataCamp instructor was fairly lucrative relative to the time commitment, especially in the long-term (assuming the courses continue to attract paying customers). On the down side, while we had a large degree of freedom in creating the courses, we lost some control over how that content was organized afterward. Moreover, we found ourselves in a position where our names and faces were being used to enrich a person and a company who had done bad things,Footnote5 and there were few good options for extricating ourselves from that position.
7 Conclusion
We found that although there are pedagogical advantages to the DataCamp platform, the pedagogical challenges are quite large. We remain convinced that the learning taking place within the classroom continues to greatly surpass that of the online platform.
We summarize some lessons we learned. On the positive side,
We reached thousands of people. Of course, we can put our materials online wherever, but the ability of private companies to reach a wide audience through marketing is substantial.
We received great feedback on our content. Although we did not always agree with how DataCamp interpreted the data on their users and the subsequent changes to our courses they recommended, their interactive dashboard was impressive in delivering detail about where students got confused and starting looking at hints, etc. These data were informative and are hard to collect in a brick-and-mortar setting. Finally, the sheer volume of users helped separate signal from noise.
We created the infer package.
We coalesced around a plan for the second edition of Diez, Barr, and Çetinkaya Rundel (Citation2014).
We and our students benefited from free access (although the mutually beneficial free access is available to all instructors who register through DataCamp for the Classroom).
On the negative side,
We learned not to sign exclusive contracts, and that DataCamp does not give the same standard contract to every instructor.
We learned to always have an exit strategy.
We learned to think carefully about how we feel about for-profit education, as decisions made in this domain can be different than those in most academic settings.
We learned to consider what we would have control over once a course is launched.
The long version is that as four instructors, we have four different perspectives on our experiences with DataCamp. The short version is that while we are all glad to have taken on the challenge and to have successfully created the course sequence, none of us are anxious to do it again.
Supplementary Materials
Our supplementary materials provide more details about the process of developing content, more of our reflective thoughts, and a short discussion of possible alternative platforms.
Disclaimer
This work was not supported by any grant, although the authors do receive royalties from DataCamp.
Supplemental Material
Download PDF (119.8 KB)Acknowledgments
The authors thank Chester Ismay, Evgeni Chasnovski, and numerous others for their contributions to infer.
Notes
1 A ninth course, Experimental Designin R taught by Kaelen Medeiros, was subsequently added by DataCamp to the sequence.
2 As of January 2019, it appears as though DataCamp no longer supports LMS integration.
3 One could replace the stat argument to calculate() with stat =“Chisq” to perform a permuted chi-squared test (which yields a very similar result in this case).
4 An alternative for new content is the learnr package, which enables interactive tutorials in R Markdown (Schloerke, Allaire, and Borges Citation2019).
5 Our already damaged relationship with DataCamp was thrown into grave peril by the sexual misconduct perpetrated by DataCamp CEO Jon Cornelissen against one of our colleagues, and the subsequent poor response from DataCamp (Alba Citation2019). We were members of the group of more than 100 instructors who pushed DataCamp for an appropriate response, and spent time and effort working with that group to try and repair a rapidly deteriorating relationship. We are heartened by the strength, passion, and solidarity of the instructor community in their support of the victim. In seeking to be part of a solution, one of us joined the DataCamp Instructor Advisory Board.
References
- Alba, D. (2019), “A Multimillion-Dollar Startup Hid a Sexual Harassment Incident by Its CEO—Then a Community of Outsiders Dragged It Into the Light,” BuzzFeed News, available at https://www.buzzfeednews.com/article/daveyalba/datacamp-sexual-harassment-metoo-tech-startup.
- Baumer, B. S., Çetinkaya Rundel, M., Bray, A., Loi, L., and Horton, N. J. (2014), “R Markdown: Integrating a Reproducible Analysis Tool Into Introductory Statistics,” Technology Innovations in Statistics Education [online], 8, available at https://escholarship.org/uc/item/90b2f5xh.
- Bray, A., Ismay, C., Baumer, B., and Çetinkaya Rundel, M. (2018), “infer: Tidy Statistical Inference,” R Package Version 0.3.1, available at https://CRAN.R-project.org/package=infer.
- Chance, B. L., and Rossman, A. J. (2006), Investigating Statistical Concepts, Applications, and Methods, Belmont, CA: Duxbury Press, available at http://www.rossmanchance.com/iscam3/.
- Chance, B. L., and Rossman, A. J. (2019), “Rossman/Chance Applet Collection,” available at http://www.rossmanchance.com/applets/.
- Diez, D. M., Barr, C. D., and Çetinkaya Rundel, M. (2014), OpenIntro Statistics with Randomization and Simulation (1st ed.), Boston, MA: OpenIntro, Inc., available at http://www.openintro.org.
- Downey, A. (2016), “There Is Still Only One Test,” Probably Overthinking It, available at http://allendowney.blogspot.com/2016/06/there-is-still-only-one-test.html.
- Gu, C. (2014), “Smoothing Spline ANOVA Models: R Package gss,” Journal of Statistical Software, 58, 1–25, available at http://www.jstatsoft.org/v58/i05/. DOI: 10.18637/jss.v058.i05.
- Halvorsen, K. T., and Moore, T. L. (2001), “Motivating, Monitoring, and Evaluating Student Projects,” MAA NOTES, pp. 27–32.
- Hancock, S., and Rummerfield, W. (2020), “Simulation Methods for Teaching Sampling Distributions: Should Hands-on Activities Precede the Computer?,” Journal of Statistics Education, available at https://www.tandfonline.com/doi/full/10.1080/10691898.2020.1720551.
- Healy, M. R., Berger, D. E., Aberson, C. L., Saw, A., and Romero, V. L. (2003), “A Web-Based Computer Program for Determining Group Classification,” Technical Report, Claremont Graduate University, available at http://wise.cgu.edu/.
- Holcomb, J., Chance, B., Rossman, A., Tietjen, E., and Cobb, G. (2010), “Introducing Concepts of Statistical Inference via Randomization Tests,” in Data and Context in Statistics Education: Towards an Evidence-Based Society (ICOTS8), Voorburg, The Netherlands.
- Lock, R., Lock, P. F., Morgan, K. L., Lock, E., and Lock, D. (2014), “Intuitive Introduction to the Important Ideas of Inference,” in Proceeedings of the 9th International Conference on Teaching Statistics (Vol. 9), eds. K. Makar, B. de Sousa, and R. Gould, International Assocation for Statistical Education, International Statistical Institute, pp. 1–6, available at http://icots.info/icots/9/proceedings/pdfs/ICOTS9\_4A3\_LOCK.pdf.
- Lock, R., Lock, P. F., Morgan, K. L., Lock, E., and Lock, D. (2019), “StatKey,” available at http://www.lock5stat.com/StatKey/.
- Pruim, R., Kaplan, D. T., and Horton, N. J. (2017), “The Mosaic Package: Helping Students to ‘Think With Data’ Using R,” The R Journal, 9, 77–102, available at https://journal.r-project.org/archive/2017/RJ-2017-024/index.html. DOI: 10.32614/RJ-2017-024.
- Roy, S., Rossman, A., Chance, B., Cobb, G., VanderStoep, J., Tintle, N. and Swanson, T. (2014), “Using Simulation/Randomization to Introduce p-Value in Week 1,” in Proceedings of the 9th International Conference on Teaching Statistics (Vol. 9), eds. K. Makar, B. de Sousa, and R. Gould, pp. 1–6, available at https://icots.info/9/proceedings/pdfs/ICOTS9\_4A2\_ROY.pdf.
- Schloerke, B., Allaire, J., and Borges, B. (2019), “learnr: Interactive Tutorials for R,” R Package Version 0.9.2.9001, available at https://rstudio.github.io/learnr/.
- Wickham, H. (2016), ggplot2: Elegant Graphics for Data Analysis, New York: Springer-Verlag, available at https://ggplot2.tidyverse.org.
- Wickham, H. (2017), “tidyverse: Easily Install and Load the ‘Tidyverse’,” R Package Version 1.2.1, available at https://CRAN.R-project.org/package=tidyverse.
- Wickham, H., Francois, R., Henry, L., and Müller, K. (2015), “dplyr: A Grammar of Data Manipulation,” R Package Version 0.4 (Vol. 3).
- Wilkinson, L. (2012), “The Grammar of Graphics,” in Handbook of Computational Statistics, eds. J. Gentle, W. Härdle, and Y. Mori, Berlin, Heidelberg: Springer, pp. 375–414.