
Abstract
Many students who enroll in introductory statistics courses do not have positive attitudes about the subject. A 2012 wide-ranging study by Schau and Emmioglu showed that student attitudes do not tend to improve after completing an introductory statistics course. However, there is a need for more studies about attitudes in introductory statistics courses that utilize reform teaching methods. In this article, we present findings about student attitudes toward statistics in both a teacher-centered lecture-based class and a student-centered active learning class, taught by the same instructor. The overall results of this study were consistent with those reported in the study by Schau and Emmioğlu. Although on an overall level, it seemed that attitudes did not change for both classes, when each attitude component was analyzed on a deeper level, from both a quantitative and a qualitative perspective, differences were found between the two classes for the components of Effort, Affect and Cognitive Competence, Interest, and Difficulty.
1 Introduction
Undeniably, making informed decisions is greatly enhanced by a strong understanding of how to deal with numbers and data. Statistical literacy and statistical reasoning are important components to understanding the economy, government decision-making, health issues, environmental concerns, and much more. Therefore, as a part of preparing university students for independent decision-making, many majors require at least one statistics course prior to graduation. Nevertheless, those students who complete such a course do not necessarily emerge from these statistics classes with a solid comprehension of the material presented or the skills necessary to use statistical reasoning in the long run (American Statistical Association Citation2016). Therefore, researchers interested in the teaching and learning of statistics continue to search for ways to increase statistical reasoning and comprehension skills in students. Since the 1980s, some of these researchers have been focusing on student attitude as an important factor of retention and future use of statistical reasoning. Many researchers have been studying students’ attitudes toward statistics while also documenting student performance (e.g., DeVaney Citation2010; Vanhoof et al. Citation2011; Griffith et al. Citation2012; Ramirez, Schau, and Emmioğlu Citation2012; Butt Citation2014). For the most part, this research has focused on traditional courses, traditional courses with some nontraditional elements, online courses, or flipped courses; however, studies that focus on other forms of active learning (e.g., discussion-based, inquiry-based, discovery learning, etc.) in statistics are still scarce. “The literature related to course delivery method in statistics education is still in its infancy” (Gundlach et al. Citation2015, p. 4). Therefore, the purpose of this study was to add to the literature by examining student attitudes at the beginning and end of two sections of a collegiate introductory statistics course, taught by the same instructor, where more traditional instructional methods (i.e., mostly lecture) were used in one class and more active learning methods (i.e., mostly discussion-based) were used in another. Students in the traditional section attended lectures from the instructor during class, were asked to complete homework outside of class, and listened to the instructor answer questions about homework during the subsequent class. Whereas the students in the nontraditional section were given questions to investigate prior to class meetings, discussed their findings and questions with one another in small groups during class, and presented their findings to their classmates during the same class. The authors aimed to investigate the following research question: How did students’ attitudes toward statistics compare to one another when the same instructor taught two introductory statistics courses, one in a teacher-centered lecture style and the other in a student-centered active learning style?
2 Background Literature
2.1 Attitude Survey Instruments
Researchers have argued that if students can emerge from a statistics course with a positive attitude toward learning the subject, they are more likely to apply the skills and procedures necessary to understanding statistics in their lives outside of the classroom (Garfield et al. Citation2002). Since 1980, when Roberts and Bilderback created the Statistics Attitude Survey (SAS) to explore attitudes as a predictor of student achievement in statistics courses, there has been a growing interest in researching student attitudes in statistics courses. This initial survey was later followed by the Attitudes Toward Statistics (ATS) survey (Wise Citation1985). Although these two surveys are two of the most widely used in statistics attitude research, their content has been criticized (Ramirez, Schau, and Emmioğlu Citation2012), and their popularity has waned. The major criticisms were that SAS is too one-dimensional because of its use of a single global attitude score and that ATS only uses two attitude components, “‘Field’—’attitudes of students toward the use of statistics in their field of study’ and ‘Course’—’students’ attitudes toward the course in which they were enrolled’ (p. 402)” (p. 60, as cited by Ramirez, Schau, and Emmioğlu Citation2012). Two new popular instruments emerged in the decades to follow, the Survey of Attitudes Toward Statistics (SATS-28) and the expanded version, SATS-36 (Schau Citation1992, Citation2003). The reliability and validity of the SATS have been critically analyzed by several researchers (e.g., Chiesi and Primi Citation2010; Vanhoof et al. Citation2011; Griffith et al. Citation2012; Pearl et al. Citation2012).
The instruments that Schau developed have increased in popularity, and in 2012, Schau and Emmioğlu published the results of data they collected for SATS-36 from approximately 2200 post-secondary students across the United States. Data were collected when students entered and left introductory statistics courses. Results of the study showed that in general, attitudes toward statistics either decreased or did not change significantly after the completion of an introductory course. The attitudes decreased in Value, Interest, and Effort and remained the same in Affect, Cognitive Competence, and Difficulty.
The instruments developed by Schau have been used in several other studies about student attitudes in statistics courses. In most cases, studies have used these instruments to assess student attitudes at the beginning and end of statistics courses as a way to compare the results to student achievement and/or course effectiveness (e.g., Finney and Schraw Citation2003; Chiesi and Primi Citation2009; Sizemore and Lewandowski Citation2009; Posner Citation2011; Gundlach et al. Citation2015). These studies have addressed student attitudes in courses that used both traditional and nontraditional teaching techniques. In the case of this article, the authors used the SATS-36 to assess student attitudes in one class that used more traditional instructional methods and another class that used more active learning instructional methods (specifically focusing on more student discussion during class time). The SATS-36 was chosen for its reliability, validity, and to compare the results to other similar studies, including Schau and Emmioğlu (Citation2012) wide-ranging study described above.
2.2 Active Learning Versus Traditional Learning
For the purposes of this research, the active learning the authors referred to is a teaching approach in which the students became more interactive and verbal participants in the in-class instruction process. Active learning in this context could be thought of as discussion-based learning. The students become the ones who discover solutions to problems by coming up with strategies that are guided by careful questioning on the teacher’s part. The students do not listen to a lecture, but rather they develop meaning by answering questions and discussing with classmates. The researchers chose Bonwell and Eison’s (Citation1991) description of what it means for students to engage in active learning to most closely define what they meant by the terminology in this study—that rather than listening to lectures and doing homework outside of class by mimicking a process illustrated by the teacher, to learn actively, during class time, students must do more than just listen: They must read, write, discuss, or be engaged in solving problems. Most important, to be actively involved, students must engage in such higher-order thinking tasks as analysis, synthesis, and evaluation. (Bonwell and Eison Citation1991, p. iii)
This is not to say that active learning does not occur in a traditional classroom; however, in general, most traditional classrooms do not require the students to “do” much of the work during class time. Most lectures entail instructors sharing their knowledge with students, while students take notes and follow along. In these types of environments, students are rarely asked to come up with creative and individual ways to solve problems that are different from the teacher’s ways. Although a traditional classroom requires active listening, most of the reading, writing, discussing, and problem-solving is done outside of the classroom when engaging with the homework and is generally done in a way that mimics the instructor’s solution methods. Because students are often mimicking teachers, when they encounter problems that are different from the ones that were shown in class, they may not try to solve the problem at all because they do not have a similar one to use for guidance. In the active learning classroom described in this study, every new concept is encountered without a previous explanation from the instructor, so the students are asked to come up with their own understandings and solution strategies on a regular basis.
2.3 Previous Research
Research that has examined the effects of similar instructional techniques on students’ learning in statistics courses has had mixed results. Various short and long-term positive results on student comprehension of statistics when they more actively engaged with the curriculum have been reported (Christopher and Marek Citation2009; Knypstra Citation2009; Kalaian and Kasim Citation2014; Winquist and Carlson Citation2014; Peterson Citation2016). For example, a group of students who had taken a previous more traditional course with the same instructor self-reported, in written evaluations of the class sessions, that this class format engaged them more and gave them greater satisfaction than the more traditional format (Knypstra Citation2009). In another instance, students who learned statistics in a flipped course versus a traditional one did not display significantly different results on assessments during the courses; however, the students in the flipped course performed better in statistical reasoning on an assessment taken one year after the classes were initially taught (Winquist and Carlson Citation2014). On the final exam for two sections of a statistics course, students who participated in a flipped classroom version of the class outperformed those who took the traditional version by more than a letter grade (Peterson Citation2016). And a meta-analytic study of nine research studies that compared academic achievements of students in active small-group learning environments to traditional ones reported “that evidence-based research supports the effectiveness of active small-group learning methods in promoting students’ achievement in statistics” (Kalaian and Kasim Citation2014, p. 1).
Other research has indicated no significant effect on students’ understanding of statistics when the subject was taught using active learning techniques (Pfaff and Weinberg Citation2009; Bowen et al. Citation2014). One study that compared multiple randomly assigned sections of traditional introductory statistics courses to hybrid courses that combined interactive online and face-to-face techniques, at 6 different universities, reported no significant difference in statistical reasoning or performance skills between sections (Bowen et al. Citation2014).
Some studies have reported lower student comprehension or course performance in active learning environments (Weltman and Whiteside Citation2010; Gundlach et al. Citation2015). Some have even suggested that traditional instruction could be best for certain students (Burgan Citation2006; Walthausen Citation2013). One study compared three sections of an introductory course taught by the same instructor in three different ways (web-augmented traditional, fully online, and flipped). Although the students experienced some active learning, students in the web-augmented traditional section outperformed the students in the other two sections on all three exams for the semester. However, those results were only significantly higher on exams one and two. On exam three, the traditional section students scored significantly higher than only the online section (Gundlach et al. Citation2015).
Studies that have examined the effects of nontraditional teaching methods on attitudes in statistics courses have also had mixed results. Some studies have found that attitudes improved in active learning environments (Carlson and Winquist Citation2011; Nowacki Citation2011; Posner Citation2011; Butt Citation2014). In a student-centered, proficiency-based assessment and reassessment of learning outcomes (PARLO) college-level introductory statistics class, student attitudes improved more than in a similar traditional assessment class (Posner Citation2011), and in a problem-based learning statistics course, students’ attitudes toward statistics increased significantly (Nowacki Citation2011). One group of students who engaged in a flipped classroom approach to instruction in a final-year actuarial course, in general, displayed more positive views about the approach than traditional instructional methods (Butt Citation2014). And another group of students who experienced an active learning, workbook curriculum “(1) had more confidence in their ability to perform and understand statistics, (2) liked statistics more, and (3) thought statistics was more difficult than the comparison group” (Carlson and Winquist Citation2011, p. 1).
Other studies have found that active learning techniques did not significantly impact attitudes (Carnell Citation2008; Gundlach et al. Citation2015). Asking students to actively engage by implementing a student-led project component to a statistics course did not have a significant impact on attitudes in one study (Carnell Citation2008). And across three sections of introductory statistics (web-augmented traditional, fully online, and flipped), there was no significant difference in attitude overall; but for the components Affect and Difficulty (“perceived easiness”), students in the traditional class scored higher than those in the online class (Gundlach et al. Citation2015).
The point here is not to give an exhaustive review of the literature that exists on active learning and/or its effects on attitudes in statistics courses but rather to give a sample of studies that have yielded various mixed results, which could be a consequence of “the enormous diversity of approaches referred to as ‘active learning”‘(Carlson and Winquist Citation2011, p. 3). However, despite these mixed results, when done effectively, this approach to instruction can be beneficial to students’ understanding of and attitudes toward statistics (Carlson and Winquist Citation2011; Winquist and Carlson Citation2014). With such a wide variety of active learning approaches being studied, more research is needed on classrooms that use reform teaching methods, as the study of diverse kinds of learning environments is still scarce in the literature (Gundlach et al. Citation2015).
In light of the need for more studies examining the attitudes of students who engage in statistics courses that use active learning and the authors’ beliefs that active learning can be more effective than traditional approaches, the authors of this article compared and contrasted the attitudes of students enrolled in two sections of introductory statistics, one taught using a lecture-based approach and the other using an active learning approach.
3 Method
This study was a classic quasi-experimental design with a control and experimental group. This research compared the attitudes of students from one section of an introductory statistics course that was taught using a traditional lecture-based approach (control: the established method of teaching for the instructor) to a second section taught using a student-centered active learning approach (experimental: the entirely new method of teaching for the instructor). This particular 100-level course is one option that satisfies the general education mathematics requirement at a regional university in the Southeastern United States. During the time this study was conducted, the university had a minimum acceptance GPA of 2.0, an average ACT score of 22 and a 6-year graduation rate of 49.7% for first-time, first-year students. The prerequisite for this course is the same as for the university’s college algebra course and is based on satisfactory scores on a standardized test (ACT, SAT, university mathematics placement exam, etc.) or successful completion of developmental mathematics. Students self-selected the sections they ended up in. When they made their selections, the same instructor was listed for both classes; however, students did not have any information about the different instructional approaches. Students were informed of the difference during the first week of classes.
3.1 Student Demographics
At the start of the semester, there were 30 students enrolled in the lecture-based class and 26 students enrolled in the nonlecture class. Participation was voluntary and while all students in each section chose to participate, data was only analyzed for those students who completed all surveys and assessments (resulting in the sample sizes shown in ). The breakdown of majors between the two sections varied a little (see ). Just over 50% of the 27 students in the lecture-based section were STEM majors. In contrast, the nonlecture section consisted of about 42% of 24 students that were STEM majors. Furthermore, the lecture-based course was made up of approximately 70% females and 30% males; whereas, the non-lecture section consisted of about 58% female and 42% males (see ). contains the breakdown of academic rank for each section of this course.
Fig. 1 Number of students majoring in STEM and non-STEM fields (left) and student genders (right) for each class section.
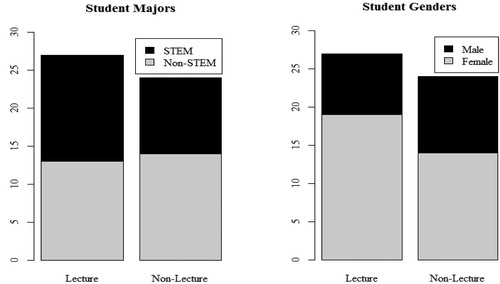
Table 1 Academic rank by section.
3.2 Description of Teaching Style for Each Class Section
The same instructor taught both sections of the course, which met three times per week, with the lecture section meeting at 11:30 a.m. and the nonlecture section meeting at 1:50 p.m. The lecture section was traditional in that the instructor lectured while students took notes and then completed similar problems on their own. For the lecture, students were provided with guided notes that were to be filled in during class. The printed version of these notes included statistics content and problems that were connected to the content. After the instructor presented new material, an example would be solved by the instructor. Most days, students would also get the opportunity to work an example on their own during class. While the class was predominately lecture, five in-class activities were used throughout the semester to give students opportunities for practice with the material in a more engaging manner. These activities were always connected to material that had already been explicitly covered during prior class time and were not identical to activities assigned in the nonlecture section. As a result, both the examples and activities worked in-class were intended as a form of practice to reinforce concepts introduced via lecture. While this practice can be valuable, the placement often leads students to mimic the process that was just shown in class, not actively engage in understanding the concepts or why a particular process is correct. After class, students would complete assigned homework problems (on their own or in groups) that were turned in and graded on a weekly basis. If students chose to work on the homework in groups, they were still required to each write and turn in their own work. While some of these problems were similar to those presented in class, others required the students to think beyond mimicking a process and required that they make connections among course concepts.
In the nonlecture section, the instructor never lectured. Instead, students were expected to encounter the material on their own prior to coming to class. This was facilitated via homework journals that consisted of sets of questions that were designed to guide students through the content by providing appropriate scaffolding as students worked to develop conceptual understanding of statistics content, similar to methods used by Winquist and Carlson (Citation2014) and Wilson (Citation2013). The types of questions on the homework journals included both conceptual and procedural questions. Students were encouraged to seek out sources (textbook, online, etc.) to aid in the completion of the homework journals. Class time was spent in small-group and whole-class discussions of the homework journals. During these discussions, students would share strategies, methodology, and solutions with each other. During the discussions, the instructor served as a facilitator. It was not uncommon for students to be in front of the class explaining a problem or concept. The discussions provided time for students to share and defend ideas, uncover misconceptions, and learn new strategies. The homework journals were not collected daily or graded for correctness. However, at the end of each unit, the instructor would give a completion grade by flipping through students’ binders while they were taking an exam. At the beginning of each class, students would complete in-class journals (which were essentially quizzes) that covered the material discussed in the previous class meeting or on that day’s homework journal. The scope of the questions on these journals ranged from conceptual to procedural to factual. The in-class journals were graded each day. However, students were allowed to revisit these to improve their scores. While the instructor held a PhD in statistics and had over eight years of experience teaching statistics with favorable student reviews, she did not have prior experience with teaching a course in a nontraditional manner. Therefore, she worked closely with two mathematics education colleagues to design and implement this method of teaching.
3.3 Quantitative Data Collection and Analysis
The SATS-36 was used to assess student attitudes before and after having taken this introductory statistic course. The SATS-36 consists of 36 questions (worded both positively and negatively) that make up six components designed to measure attitudes related to statistics. The components are Affect, Cognitive Competence, Value, Difficulty, Interest, and Effort (see ). These are measured using a standard 7-point Likert scale where 1 corresponds to “strongly disagree,” 4 is “neither disagree nor agree,” and 7 corresponds to “strongly agree.”
Table 2 SATS-36 attitude component descriptions.
Students completed the pretest survey on the second day of class and the posttest survey on the last day of class, prior to the final exam day. The researchers obtained permission from the university’s Institutional Review Board prior to beginning the study, and student participation was voluntary. Student responses were recorded in a spreadsheet after the end of the semester. The questions that were negatively worded were reverse coded. Each student’s mean score for each component was analyzed; this value is referred to as the component’s subscale score (Schau Citation2003). If a student failed to answer a question for a particular component on the pre or posttest, his/her responses were disregarded for that specific component (see for sample sizes). Higher subscale scores for any component indicated a more positive attitude. For instance, a higher score in Difficulty (or perceived easiness) on the pretest and/or posttest indicated that a student perceived statistics as less difficult than a student who scored lower on Difficulty. This can be demonstrated by thinking about the following statement about Difficulty from the survey: “Statistics formulas are easy to understand.” A higher score for this statement indicated the student perceives statistics formulas as easier than a lower score did. A higher score for Effort on the pretest indicated that students planned to work hard in the class, while a higher score on the posttest indicated that they believed they did work hard in the course. Final exam grades and final course grades were also collected for the purposes of analyzing correlations between grades and the various attitude components for each class. Although the final exam grades and final course grades were not made up of exactly the same components due to the different teaching techniques, the authors were interested in seeing how these two variables compared with student perceptions in each section. Both classes took three exams during the semester (both classes on the same days during regular class time) and a comprehensive final exam (at the university-scheduled time). The first two exams where either identical other than the use of different datasets. The third exam and comprehensive final were not the same in each section, as the slower-paced non-lecture section did not progress as far through the material on inferential procedures. Although confidence intervals were covered in both sections, hypothesis testing was only covered in the lecture section.
The distributions of the subscale scores are presented via boxplots, with the mean of each subscale score included for reference. Since the questions on the SATS-36 employ a Likert-scale response and the sample sizes were quite small (see ), the component subscale scores were analyzed using nonparametric methods. The two-tailed Mann–Whitney test was used to test for a significant difference between the lecture and nonlecture classes in the distributions of the subscale score for each of the six components. When comparing paired pretest and posttest subscale scores within each class, the two-tailed Wilcoxon signed rank test was used. Additionally, relationships are explored using Spearman’s rho. Since each inferential procedure involves six tests (one for each of the attitude components), a Bonferroni adjustment to the 0.05 overall significance level is used, resulting in an adjusted significance level of 0.0083 for each test. All analyses reported in the Results section were performed using R (R Core Team Citation2012).
3.4 Qualitative Data Collection and Analysis
Students also participated in four directed reflections throughout the semester. For the first three reflections, students were asked, “What have you learned as a result of being in this class? (Note that this does not necessarily have to be statistics-related.)” For the final reflection, students were directed to, “Tell me something you have learned in this class that you can see being useful for you in the future.” These data were analyzed using an interpretive framework to increase validity of the findings (LeCompte and Schensul Citation1999). All student responses from these reflections were organized into a table that included a column for responses from each reflection and a row dedicated to each participant. Individually, the three researchers read through all reflections multiple times and coded comments that reflected Affect, Cognitive Competence, Interest, Effort, and the relationship between perception of Difficulty and performance on the final exam. Common themes were identified, and then the researchers shared and discussed the themes that emerged. Data were then analyzed by looking for similarities in themes that emerged as they related to the SATS-36.
4 Quantitative Results
4.1 Pretest/Posttest Scores and Variability
Students’ pretest subscale scores, as well as the variability in these scores (see ), differed across components, as shown in the boxplots in . Students tended to have the highest scores (and the least amount of variability) about their perceptions of Effort they would put forth at the start of the semester, while they started the semester with the lowest scores in their perceptions of easiness of the course (Difficulty). To test whether or not the differences that can be seen in the lecture and non-lecture sections are significant, the Mann–Whitney test was utilized. All p-values (see the pretest column of ) were found to be nonsignificant; this meant that there was no significant difference in the student attitudes about statistics at the start of the semester between the two sections.
Fig. 2 Boxplots of student pretest subscale scores by section and attitude component.
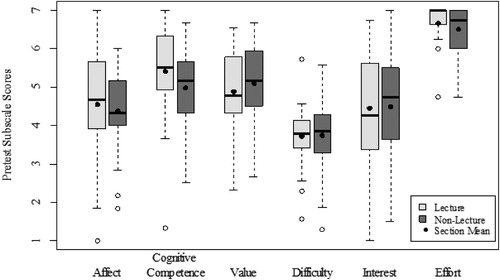
Table 3 Interquartile ranges for pretest and posttest subscale scores.
Table 4 Results from Mann–Whitney tests comparing the two course sections.
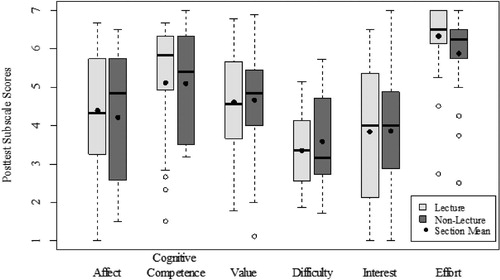
Posttest subscale scores for the students are presented in . As was the case of the pretest scores, students tended to have the highest scores in the Effort component and the lowest scores in perceived easiness (Difficulty). There tended to be more variability in posttest subscale scores than pretest subscale scores, as indicated by the interquartile ranges (IQR) (see ). In fact, most of the interquartile ranges are larger for the posttest scores than for the corresponding pretest scores with the following two exceptions out of the twelve: the lecture class’s Cognitive Competence IQR remained the same, while the non-lecture class’s Effort IQR decreased by 0.25. Two-tailed Mann–Whitney tests comparing the posttest scores for the two sections (see the Posttest column of ) revealed that the only significant difference (at the 0.05 level) was in Effort. Students in the non-lecture class had significantly lower scores (corresponding to a less positive attitude) about the amount of effort they put into the course (attendance, assignment completion, etc.) at the end of the semester than those in the lecture class. It should be noted that if a Bonferroni adjustment for the six tests is made to the significance level (0.0083), this difference is no longer considered significant.
Fig. 3 Boxplots of student posttest subscale scores by section and attitude component.
4.2 Changes in Scores
contains boxplots for the students’ changes in subscale score (posttest–pretest) for the six attitude components. More than 50% of nonlecture students had positive changes in Affect and Cognitive Competence, as indicated by the positive medians. This signified that a majority of the nonlecture students indicated a positive shift in their feelings concerning statistics (Affect) as well as about their own knowledge and skills when applied to statistics (Cognitive Competence). A large majority of students (more than 75%) in both sections had negative changes in their Effort attitudes, indicating that they did not actually expend as much effort into this class as they thought they would at the start of the semester. Mann–Whitney tests (see the change column of ) revealed that there were not significant differences in the changes in attitude between the two sections for any of the six components.
Fig. 4 Boxplots of student change in subscale scores (posttest–pretest) by section and attitude component. The reference line at 0 indicates no change in attitude.
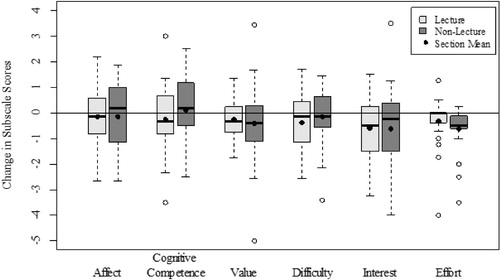
Schau and Emmioğlu (Citation2012) considered differences of ½ point or more as important. Using the median change, the changes in Interest for the lecture class (–0.5) and Effort in the nonlecture class (–0.5) are considered important decreases. The mean change also indicates these decreases as being important (–0.614 for Interest in lecture and –0.620 for Effort in nonlecture). Furthermore, the decrease in Interest for the nonlecture class is also important when considering the mean change (–0.615).
Although shows that, overall, most of the changes in attitude tended to be negative (with the two exceptions of Affect and Cognitive Competence in the nonlecture section), to test for significance, the two-tailed Wilcoxon signed rank test was used to compare paired student pretest and posttest subscale scores. contains the p-values that resulted from each of the tests performed. There was a significant decline in Effort for both sections at the 0.05 significance level, with students not meeting the work-ethic expectations they put upon themselves at the start of the semester. Additionally, there was a significant change in Interest for the lecture section at the 0.05 significance level; lecture students’ level of interest in statistics declined over the course of the semester. To explore this, further analysis regarding this component was conducted. Change in Interest attitude for the lecture students was found to be significantly positively correlated with year in school at the 0.05 significance level (Spearman correlation of 0.4192; p-value = 0.015). Thus, students that were further along in their college career tended to have more positive changes in their interest in statistics than those who were “younger.” Additionally, a Mann–Whitney test revealed that the change in Interest is significantly higher for upper-division students than it is for lower-division students (p-value = 0.0095). For the nonlecture class, no such significant relationship between change in Interest and year in school was found. It should be noted that when using the Bonferroni-adjusted significance level, the changes in Interest and Effort in the lecture section are no longer significant.
Table 5 Nonparametric inference results for change in attitude.
To provide the reader with an idea of the effect size (post-pre), also contains nonparametric confidence intervals for the difference in location parameters of the post-pre distributions (Hollander and Wolfe Citation1973). Each column of intervals has an overall confidence level of 95% (i.e., each individual interval has a 99.17% confidence level). Intervals containing 0 suggest no significant difference in the locations of the pretest and posttest distributions.
To examine the relationship between students’ change in attitude and performance in the course, correlations were calculated between the final exam score and change in subscale score for each of the attitude components, as well as between the final course grade and change in subscale score. contains the values of the correlations (Spearman’s rho), which were tested for positive associations. Using the Bonferroni-adjusted significance level, these relationships were significantly positive for Affect and course grade in both sections. Students who scored better in the course tended to have more positive changes in Affect (for both sections). Students who scored better in the course overall tended to have more positive changes in Value for both sections and for Cognitive Competence in the nonlecture section. Although not all of the relationships were found to be significant, all of the correlations were positive. Thus, students that tended to score higher (on either the final exam or in the course as a whole) tended to have more positive changes in attitude. It is also noteworthy that all of the corresponding correlations are stronger (and the p-values are smaller) for the nonlecture section than the lecture section.
Table 6 Correlations (Spearman’s rho) between change in attitude and grades.
5 Discussion of Results With Qualitative Data Ties
5.1 Effort
For both sections, students’ attitudes about the amount of effort they would put into this statistics class decreased from the beginning of the semester to the end. Students started the semester with higher expectations of themselves; that they would attend class regularly, study hard, and complete all assignments. However, at the end of the semester, they seemed to recognize that this did not happen. Regardless, this was still the attitude component in which students, overall, tended to report having the most positive attitude on the posttest, even though it was not as positive as at the start of the semester. This is consistent with the results that Schau and Emmioğlu reported in their wide-ranging study (2012).
It is interesting that there was a significantly lower posttest attitude for Effort in the nonlecture section than there was for the lecture section since the nonlecture class was designed in such a way that students were required to put forth more effort to discover concepts. Analysis of student reflections indicated that students in the nonlecture class seemed to feel as though they did not have to study as much for the exams since they were revisiting the material so many times through the journals and discussions. One student wrote, “I’ve learned that being in a class like this, it seems almost as if I don’t have to study as much, because I’ve studied throughout to do the homework journals.” Several students discussed that doing statistics in this way forced them to put effort into learning the material sooner than they normally would. Throughout the semester, students wrote statements such as, “procrastination and laziness are habits I have to break,” “I need to manage my time better, To [sic] many times I’ve had to come to class unprepared due to my workload in other classes,” and, “Its [sic] very time consuming and I don’t spend near enough time studying for it.” It appears that in the active-learning class, much of the effort students put forth to understand the material was before and during in-class group discussions; whereas, students in the more traditional classroom setting put more work in outside of class, after material was presented by the instructor and right before exams. There was more collaboration in making sense of difficult concepts. This format pushed students to put more effort into learning the subject in a more spread out way, which seemed to give students the impression that they had to put less effort into learning the subject than they thought they might.
5.2 Affect and Cognitive Competence
Although the positive changes seen in a majority of the nonlecture students’ Affect and Cognitive Competence were not statistically significant, the qualitative data supported the idea that these two components of attitudes can be positively affected by learning statistics in a student-centered classroom environment. Many students described not enjoying the discussion style of the class; however, even with that in mind, several of them wrote about positive changes in Affect and Cognitive Competence in ways that did not appear in the lecture class comments. Student comments from the nonlecture class included, statements such as, “They [the lecture class students] may just be remembering & forgeting [sic] where I feel that I [am] exploring and remebering [sic].” Other comments included,
This class is slowly building my confidence in my math skills. I understand how to do the problems the majority of the time. Even though it is very difficult to learn in the group setting, I always understand when we go over our homework as a class.and
I have also learned new ways of thinking in statistics—I can deductively find answers on my own as opposed to simply being told or shown answers.
Yet another non-lecture student wrote,
I have learned more about myself and how I can be a leader and help others. This will give me confidence to succeed and help others while in the nursing profession.
In a previous publication, the authors described some limitations to the way the student-centered course was taught (Autin, Bateiha, and Marchionda Citation2013). Since this was the instructor’s first attempt at teaching in such a way, she experienced discomfort in teaching this course that she did not experience in the lecture class. The students in the nonlecture class seemed to share in that discomfort. After reflection, the instructor noted that she would teach the course with more confidence in the future, and would make an effort to reassure the students of the benefits to the method being used. Carlson and Winquist (Citation2011) found that using an active learning approach had significant impacts on Affect and Cognitive Competence. More studies of student-centered statistics courses would need to be investigated to further confirm that teaching in this way could lead to significant positive changes in Affect and Cognitive Competence.
5.3 Interest
Students in both sections appeared to lose interest, which is consistent with previous findings (Carlson and Winquist Citation2011; Schau and Emmioğlu Citation2012). In this study, the median loss was greater for the lecture class. This could imply that students seemed to find the student-centered environment more interesting, which could have contributed to positive student motivation. Analysis of student responses brought out several comments of student interest in the student-centered class. They included, “The material was interesting & most was pretty easily understandable,” “I found the class was less boring and more enjoyable,” and
I thought this class would involve a lot of complicated and difficult mathematics concepts. However, my first impresion [sic] that I had in my firs [sic] stat class was that it was very fascinating and different from other math coursses [sic]. The exemple [sic] that Ms. Melanie explained allowed us to see how the statistics are applied to the real life application question.
Further analysis indicated that most students in the lecture class did not find the course and/or material interesting and when there were positive shifts in Interest, they were limited to upper-level students in the lecture section. Whereas changes in Interest for the nonlecture students were not tied to age or year of study, for the lecture students, upper-level students (juniors and above) seemed to be the only students to have a positive shift in Interest in comparison to younger students. This may be due to more maturity and an intrinsic desire to learn the material than what exists for a less mature university audience. Comments from upper-division students in the lecture class included, “Sometimes the homework would confuse me, but challenged me in a good way. I never gave up on a problem, I always tried to work thru them” and “I’ve learned that statistics has much more to do w/[sic] real life situations that [sic] I’d ever previously thought. Although I already took a similar course at UK, this one is more hands on & gives real life situations.” However, comments from lower-division students in the lecture class included, “I learned a great deal in this class, but I am not sure how I will ever use it outside of these doors” and “I wish I could have understood the material a little better and if [sic] we could have gone slower in the class. Also if there wasn’t as much information covered on the tests.”
The increases in variability seen in the posttest scores () suggest that students’ attitudes differ more among each other at the end of the semester than they do at the start of the semester. Several factors could have contributed to this result including but not limited to some students losing/gaining enthusiasm for learning statistics after performing poorly/well in the course.
5.4 Difficulty
Although not statistically significant at the adjusted 0.0083 level, the relationship between change in Difficulty and final exam grades was much stronger in the nonlecture section than in the lecture. In fact, the correlation was essentially zero in the lecture section. This could indicate that the students in the lecture class who did well on the final exam did not seem to display a better (or worse) attitude about Difficulty, whereas the higher scoring students in the nonlecture class seemed to display a better attitude about Difficulty. The lack of a relationship in the lecture section between Difficulty and performance is interesting. It seems intuitive that students who do well in a course find it less difficult, and students who find a subject less difficult do better; however, that did not happen in the lecture class. This suggests that perhaps using a student-centered teaching model has more of an effect on the relationship between perception of difficulty and performance on the final exam. Students in the nonlecture section may be more in tune with both their own sense of understanding of the material (or lack thereof) and difficulty level than the students in the nonlecture section. This suggests that students in the lecture class may not know that the content is difficult until they have to perform on the final exam. They may have a false sense of security. One student in the lecture class gave a good description of the false sense of security she has during lectures when she wrote,
I always feel like I understand it during class but when I go home to do it I can’t recall how I did it and even though [I] look to the notes for most of the questions, there are still some I can’t answer.
The students in the nonlecture class had to perform each day and were never shown solutions, which may have contributed to self-awareness about the difficulty they were experiencing. Further, it is noteworthy to mention that all of the corresponding correlations are stronger for the nonlecture section than the lecture section. Thus, change in attitude seems more closely tied to performance in the nonlecture section than in the lecture section.
6 Limitations
The authors of this study recognize that there were many limitations to this work. First, this was an observational study and the students were not randomized to the two course sections. Thus, these results may not be generalized to a larger population, nor can conclusions about causality be drawn. There were several confounding factors that may have skewed the results. The class sizes were small, and only two classes were studied. Although individual class sizes do not necessarily need to be increased, more classes taught in the ways described need to be studied to gather more accurate information. Additionally, the composition of the groups, including their majors, personal characteristics, etc. could have impacted the outcomes. Furthermore, it is possible that the instructor’s lack of experience with teaching in the style of the nonlecture class could have negatively affected the attitudes of the students. Although the authors believe that limitations existed, they present these findings not as a way to make broad, sweeping generalizations about teaching statistics, but rather as a way to provide some insights into what happened to this particular instructor and her students’ attitudes as she began to shift to a different teaching style. The authors hope that these insights could be useful to others as they begin thinking about taking risks and teaching differently.
7 Conclusion
The overall results of this study were consistent with those reported in Schau and Emmioğlu (Citation2012). Students at this university did not display significant changes in attitudes toward statistics from the beginning to the end of the semester. Although overall the change in attitudes was not significant, a closer quantitative and qualitative analysis of the various components of attitudes gave some deeper insight as to why there were some quantitative and qualitative differences in attitudes between teaching statistics in a lecture versus nonlecture format, with the nonlecture format yielding more positive results. Although students in the nonlecture class did more conceptual work and had to figure out procedures on their own throughout the semester, they seemed to perceive the class as needing less effort than the lecture class, who seemed to describe themselves as having to put in a lot of effort to study the material, likely in shorter bursts of time, such as before an exam. Further, several students in the nonlecture class seemed to depict and describe higher Affect and Cognitive Competence than the lecture class. Students in the nonlecture class wrote about gaining confidence in themselves and their abilities to comprehend statistics. Being actively engaged in class seemed to also yield more interest in the subject matter in the nonlecture class than the lecture class, where interest seemed to exist more for upper-division students, who might just be more mature students and therefore more likely to be more interested than lower-division students. Finally, data revealed that students in the nonlecture class seemed to have more awareness about their understanding of the material and the difficulty they were having with comprehension than the lecture class. Perceptions of difficulty level were more closely tied to student performance in the nonlecture class than the lecture class.
What is important to note is that although on an overall level, it seemed that attitudes did not change for both classes, it was necessary to investigate each attitude component on a closer level, from both a quantitative and a qualitative perspective, to gain a deeper understanding of any differences that existed between teaching in the two ways described here. The authors believe that it could be beneficial to study the individual components of student attitudes toward statistics from the quantitative and the qualitative views to gain a better understanding of how to teach statistics more effectively. Given the nature of instruction in those two sections and the instructor’s reflections that the nontraditional section could be improved upon based on what she learned (Autin, Bateiha, and Marchionda Citation2013), more research, similar to that described in this article, is needed to determine if teaching in a student-centered, active learning environment could further improve attitudes as they relate to statistics.
References
- American Statistical Association (2016), “Guidelines for Assessment and Instruction in Statistics Education: College Report,” American Statistical Association, available at http://www.amstat.org/education/gaise/GaiseCollege_Full.pdf.
- Autin, M., Bateiha, S., and Marchionda, H. (2013), “Power Through Struggle in Introductory Statistics,” PRIMUS, 23, 935–948. DOI: 10.1080/10511970.2013.820810.
- Bonwell, C., and Eison, J. (1991), “Active Learning: Creating Excitement in the Classroom. 1991 ASHE-ERIC Higher Education Reports,” ERIC Clearinghouse on Higher Education, The George Washington University, Washington, DC.
- Bowen, W. G., Chingos, M. M., Lack, K. A., and Nygren, T. I. (2014), “Interactive Learning Online at Public Universities: Evidence From a Six-Campus Randomized Trial,” Journal of Policy Analysis and Management, 33, 94–111. DOI: 10.1002/pam.21728.
- Burgan, M. (2006), “In Defense of Lecturing,” Change: The Magazine of Higher Learning, 38, 30–34. DOI: 10.3200/CHNG.38.6.30-34.
- Butt, A. (2014), “Student Views on the Use of a Flipped Classroom Approach: Evidence From Australia,” Business Education & Accreditation, 6, 33.
- Carlson, K., and Winquist, J. (2011), “Evaluating an Active Learning Approach to Teaching Introductory Statistics: A Classroom Workbook Approach,” Journal of Statistics Education, 19. DOI: 10.1080/10691898.2011.11889596.
- Carnell, L. J. (2008), “The Effect of a Student-Designed Data Collection Project on Attitudes Toward Statistics,” Journal of Statistics Education, 16, 1–15. DOI: 10.1080/10691898.2008.11889551.
- Chiesi, F., and Primi, C. (2009), “Assessing Statistics Attitudes Among College Students: Psychometric Properties of the Italian Version of the Survey of Attitudes Toward Statistics (SATS),” Learning and Individual Differences, 19, 309–313. DOI: 10.1016/j.lindif.2008.10.008.
- Chiesi, F., and Primi, C. (2010), “Cognitive and Non-Cognitive Factors Related to Students’ Statistics Achievement,” Statistics Education Research Journal, 9, 6–26.
- Christopher, A., and Marek, P. (2009), “A Palatable Introduction to and Demonstration of Statistical Main Effects and Interactions,” Teaching of Psychology, 36, 130–133. DOI: 10.1080/00986280902739784.
- DeVaney, T. A. (2010), “Anxiety and Attitude of Graduate Students in On-Campus vs. Online Statistics Courses,” Journal of Statistics Education, 18, 1–15. DOI: 10.1080/10691898.2010.11889472.
- Finney, S. J., and Schraw, G. (2003), “Self-Efficacy Beliefs in College Statistics Courses,” Contemporary Educational Psychology, 28, 161–186. DOI: 10.1016/S0361-476X(02)00015-2.
- Garfield, J., Hogg, B., Schau, C., and Whittinghill, D. (2002), “First Courses in Statistical Science: The Status of Educational Reform Efforts,” Journal of Statistics Education, 10, 456–467. DOI: 10.1080/10691898.2002.11910665.
- Griffith, J., Adams, L., Gu, L., Hart, C., and Nichols-Whitehead, P. (2012), “Students’ Attitudes Toward Statistics Across the Disciplines: A Mixed-Methods Approach,” Statistics Education Research Journal, 11, 45–56.
- Gundlach, E., Richards, K. A. R., Nelson, D., and Levesque-Bristol, C. (2015), “A Comparison of Student Attitudes, Statistical Reasoning, Performance, and Perceptions for Web-Augmented Traditional, Fully Online, and Flipped Sections of a Statistical Literacy Class,” Journal of Statistics Education, 23, 1–33. DOI: 10.1080/10691898.2015.11889723.
- Hollander, M., and Wolfe, D. A. (1973), Nonparametric Statistical Methods, New York: Wiley.
- Kalaian, S. A., and Kasim, R. M. (2014), “A Meta-Analytic Review of Studies of the Effectiveness of Small-Group Learning Methods on Statistics Achievement,” Journal of Statistics Education, 22, 1–20. DOI: 10.1080/10691898.2014.11889691.
- Knypstra, S. (2009), “Teaching Statistics in an Activity Encouraging Format,” Journal of Statistics Education, 17. DOI: 10.1080/10691898.2009.11889518.
- LeCompte, M., and Schensul, J. (1999), Designing & Conducting Ethnographic Research, Walnut Creek, CA: Altamira Press.
- Nowacki, A. S. (2011), “Using the 4MAT Framework to Design a Problem-Based Learning Biostatistics Course,” Journal of Statistics Education, 19, 1–24. DOI: 10.1080/10691898.2011.11889622.
- Pearl, D. K., Garfield, J. B., delMas, R., Groth, R. E., Kaplan, J. J., McGowan, H., and Lee, H. S. (2012), “Connecting Research to Practice in a Culture of Assessment for Introductory College-Level Statistics,” Recuperado de, available at www.causeweb.org/research/guidelines/ResearchReport_Dec_2012.pdf.
- Peterson, D. J. (2016), “The Flipped Classroom Improves Student Achievement and Course Satisfaction in a Statistics Course A Quasi-Experimental Study,” Teaching of Psychology, 43, 10–15. DOI: 10.1177/0098628315620063.
- Pfaff, T. P., and Weinberg, A. (2009), “Do Hands-On Activities Increase Student Understanding? A Case Study,” Journal of Statistics Education, 17. DOI: 10.1080/10691898.2009.11889536.
- Posner, M. A. (2011), “The Impact of a Proficiency-Based Assessment and Reassessment of Learning Outcomes System on Student Achievement and Attitudes,” Statistics Education Research Journal, 10, 3–14.
- R Core Team (2012), R: A Language and Environment for Statistical Computing, Vienna, Austria: R Foundation for Statistical Computing, available at http://www.R-project.org/.
- Ramirez, C., Schau, C., and Emmioğlu, E. (2012), “The Importance of Attitudes in Statistics Education,” Statistics Education Research Journal, 11, 57–71.
- Schau, C. (1992), “Survey of Attitudes Toward Statistics (SATS-28),” available at http://evaluationandstatistics.com/.
- Schau, C. (2003), “Survey of Attitudes Toward Statistics (SATS-36),” available at http://evaluationandstatistics.com/.
- Schau, C., and Emmioğlu, E. (2012), “Do Introductory Statistics Courses in the United States Improve Students’ Attitudes?,” Statistics Education Research Journal, 11, 86–94.
- Sizemore, O. J., and Lewandowski, G. W. (2009), “Learning Might Not Equal Liking: Research Methods Course Changes Knowledge But Not Attitudes,” Teaching of Psychology, 36, 90–95. DOI: 10.1080/00986280902739727.
- Vanhoof, S., Kuppens, S., Castro Sotos, A. E., Verschaffel, L., and Onghena, P. (2011), “Measuring Statistics Attitudes: Structure of the Survey of Attitudes Toward Statistics (SATS-36),” Statistics Education Research Journal, 10, 35–51.
- Walthausen, A. (2013), “Don’t Give Up on the Lecture,” The Atlantic, available at http://www.theatlantic.com/education/archive/2013/11/dont-give-up-on-the-lecture/281624/.
- Weltman, D., and Whiteside, M. (2010), “Comparing the Effectiveness of Traditional and Active Learning Methods in Business Statistics: Convergence to the Mean,” Journal of Statistics Education, 18. DOI: 10.1080/10691898.2010.11889480.
- Wilson, S. (2013), “The Flipped Class: A Method to Address the Challenges of an Undergraduate Statistics Course,” Teaching of Psychology, 40, 193–199. DOI: 10.1177/0098628313487461.
- Winquist, J., and Carlson, K. (2014), “Flipped Statistics Class Results: Better Performance Than Lecture Over One Year Later,” Journal of Statistics Education, 22. 11889717. DOI: 10.1080/10691898.2014.
- Wise, S. (1985), “The Development and Validation of a Scale Measuring Attitudes Toward Statistics,” Educational and Psychological Measurement, 45, 401–405. DOI: 10.1177/001316448504500226.