
 ?Mathematical formulae have been encoded as MathML and are displayed in this HTML version using MathJax in order to improve their display. Uncheck the box to turn MathJax off. This feature requires Javascript. Click on a formula to zoom.
Abstract
Sample survey design is a topic usually taught to students undertaking a minor or major in statistics in the latter part of their bachelor’s degree. This article describes an assessment project that fosters active learning and helps to develop a set of essential skills for statistical practice. The project is completed in pairs and submitted in two parts. This allows feedback from the first part to be acted upon for the second part. Ideally, students would gain experience sampling from an actual population. However, the time involved in obtaining approval from the university’s ethics committee may not be feasible for a short course. An alternative is to use an online virtual population such as the Islands, which provides students with an experience in setting up a sampling frame, requesting consent from potential participants, and collecting data. Proficiency in written communication and teamwork are highly valued by employers of statistics graduates. This project encourages collaborative learning in the design of the sample survey, statistical analysis of data collected, and the development of a final written report. It can easily be adapted for first year students and also be extended to suit Honors or Masters level students.
1 Introduction
Higher education institutions offering a minor or major in applied statistics are responsible for preparing graduates to become trainee statisticians. To qualify with a minor or major in statistics, an undergraduate will study many mathematics and statistics courses (units) at different levels, each contributing to the overall curriculum and the desired graduate attributes. Employers prefer statistics graduates who are multi-skilled, as discussed in the American Statistical Association’s ‘Curriculum Guidelines for Undergraduate Programs in Statistical Science (CGUPSS)’ (ASA Citation2014). It states
Effective statisticians at any level need to master an integrated combination of skills built upon statistical theory, statistical application, data management and computation, mathematics and communication (ASA Citation2014, p. 9).
In an upper level statistics unit, there is potential to offer a more sophisticated assessment regime comprising a scaffolding of skills and concepts learned in preceding units. The aim is to incorporate a synthesis of critical lower and higher order skills into the learning objectives. A well designed assessment task will be appropriate to the level of study; be engaging for students; be well-timed for active learning to take place; and involve data manipulation and statistical computing to apply statistical theory. Other pedagogical considerations outlined in the CGUPSS (ASA Citation2014, p. 13) include presenting problems with a substantive context, offering opportunities to students for improving communication skills and working in teams, as well as providing authentic feedback.
Sample survey design is a topic usually offered as an upper level elective subsequent to a first year statistics unit. Typically, the focus is to introduce the theory and practice of sampling methods such as simple random sampling, systematic sampling, stratified sampling, and possibly cluster sampling. In addition, common estimation procedures for analyzing the data are included.
In this article, a survey sampling project is described which involves the sampling of an online virtual population called the Islands (Bulmer and Haladyn Citation2011). The project forms part of the assessment for a 6-week Survey Sampling component of a 13-week unit aimed at upper level undergraduate students; the remainder of the unit focuses on Experimental Design. The project is designed to be carried out in small groups, enabling students to practice a combination of critical statistical and communication skills, culminating in a written report. Each section of the assessment task is described in light of the recommendations from the Guidelines for Assessment and Instruction in Statistics Education (GAISE) College Report (ASA 2016) and the CGUPSS (ASA Citation2014). A summary of these recommendations is provided in Section 2, with a review of the relevant literature and an outline of the Islands environment. In Section 3, each part of the project is described with notes to teachers and the corresponding rationale; the assessment structure is outlined in Section 4 with a summary in Section 5.
2 Background
The GAISE Report features six recommendations (ASA 2016), which for convenience, are listed here. The first two address what to teach: (1) Teach statistical thinking; and (2) Focus on conceptual understanding. The next four address how to teach: (3) Integrate real data with a context and purpose; (4) Foster active learning; (5) Use technology to explore concepts and analyze data; and (6) Use assessments to improve and evaluate student learning. While the GAISE Report focuses on introductory statistics courses, the six recommendations may be applied beyond the introductory level (ASA 2016, p. 7).
A general undergraduate statistics curriculum has been discussed extensively in the literature; a list of key articles is given in Horton and Hardin (Citation2015). They emphasize the need for student engagement in the entire data analysis process. Programs should be creative in their curriculum by offering a mixture of theory, methods, computation, and applications (Horton and Hardin Citation2015, p. 260). One paper listed under “Second Courses,” relating to the teaching of survey sampling, is the panel discussion paper by Fecso et al. (Citation1996). It provides insights into approaches to teaching survey sampling and the content that should be included in the curriculum. Depending on the diversity of the student group in the class, and the aim of the course, the main challenge is balancing the theoretical with the practical. Each of the five panel members emphasize the importance of a hands-on practical experience (Fecso et al. Citation1996).
Ideally, a hands-on practical experience would involve the collection of data according to a particular sampling design; the data analysis using statistical software that incorporates the sampling design; and then the communication of the results produced into a report; thus, balancing the theoretical with the practical. In cases involving human participants, approval from the university’s ethics committee is required. Obtaining this approval can be time consuming and may not be feasible to carry out within the short period of an undergraduate unit. A solution is to supply the population data, thereby putting the emphasis of the assessment on the post data collection phases. The disadvantage of providing the population data is that students do not experience: the challenges and messiness often associated with creating a sampling frame; sampling individuals who may choose not to respond; the data collection process; and the subsequent data manipulation often required. For more discussion on the advantages and disadvantages of the use of artificial and reality-based datasets see Hulsizer and Woolf (Citation2008, chap. 7). An alternative is to use an online virtual population such as the Islands for which ethics approval from a university committee is not required.
2.1 The Islands
The Islands is a virtual online environment developed by Bulmer and Haladyn (Citation2011) comprising twenty-seven villages spread across three islands (https://islands.smp.uq.edu.au/). The Islanders live in houses within villages of various sizes; the villages have schools and other town buildings such as a bureau, a hall, a clinic, a museum, and three of the larger towns also have a university. There are many ways to locate the Islanders: a user may select a house which lists its residents; the local school lists the teachers and the students enrolled; the bureau gives the overall demography, a list of residents employed in certain occupations or belonging to recreational clubs; the hall provides lists of births, deaths and marriages; the university lists the faculty members and students; the clinic lists the staff and current patients. The Islanders can be contacted, asked to do certain tasks, or answer questions.
The opportunities for using the Islands for statistical projects are endless. At an undergraduate level, the Islands virtual environment is becoming popular among educators of introductory statistics courses to teach students about general statistics and experimental design (see, e.g., Baglin et al. Citation2013; Baglin, Bedford, and Bulmer Citation2013; Baglin, Reece, and Baker Citation2015; Linden, Baglin, and Bedford Citation2011).
One of the major strengths of the Island program is that it allows students to experience the entire process of statistical problem solving within an engaging context. (Huynh, Baglin, and Bedford Citation2014)
The use of the Islands is conducive to active learning (Prince Citation2004; Tirlea et al. Citation2016), as it provides students with an opportunity to engage in the learning process. A small pilot study showed that common misconceptions toward sampling can be corrected by implementing active learning—whether carried out with a virtual online simulation environment (such as the Islands) or an interactive classroom exercise (Tirlea et al. Citation2016). Focusing on an exploratory data investigation, the Islands was used in a problem solving activity in an Australian selective secondary school. The pilot study showed that students’ attitudes toward statistics improved significantly after the activity (Baglin and Huynh Citation2015; Huynh, Baglin, and Bedford Citation2014). Although undergraduate statistics students are a different target group to high achieving secondary students, using the Islands could also improve the engagement of university age students. This article adds to the growing literature of how the Islands can be utilized for statistical projects (instructors new to using the Islands can e-mail [email protected] to create a new account). In particular, the project described in the next section is designed for students enrolled in an upper level unit in survey sampling.
3 The Project
The learning outcomes associated with the project include the following:
design of sampling schemes;
critical evaluation of the methodology used in a survey and the reliability of the results;
use of statistical software to carry out appropriate analyses and interpretation of output;
communication of results and conclusions in a clear manner in a structured written report;
working collaboratively with other students.
A brief overview of the project’s aim and predetermined context is described below.
Overview
To gain a better understanding of the physiology of the Islands inhabitants, a large health survey is planned to obtain information about certain physiological measures including basic measures such as age, height, weight and gender as well as other clinical measures. A person’s lung volume can be quantified by the forced expiratory volume (FEV), measured in liters by a spirometer. The aim of this project is to carry out a pilot study using different sampling designs to recommend one to the survey designers. The focus is on estimating mean lung volume of the population of individuals aged at least 15 years.
The project is divided into two components and completed in pairs. Part A comprises three sections: Section 1—Variable and context; Section 2—Population and sampling frame; and Section 3A—Simple random sampling. Part B comprises a further three sections: Section 3B—Simple random sampling analysis; Section 4—Stratified random sampling; and Section 5—Summary and conclusions. The project assessment is 15% of the total marks in the unit.
3.1 Context
A statistician is faced with three initial issues in any study: understanding the problem, understanding the context, and understanding how the variable of interest is measured. In Section 1 of Part A, students are required to research general information about measuring lung volume or lung capacity (FEV) with a spirometer, such as, how FEV is measured and the approximate range of values for human adults. They are required to find two relevant studies that report estimated mean lung volume in the general healthy population; for example, for different age-groups, gender, occupations, or ethnic groups. For each study they need to summarize the aim, including the target population; the sampling design, including the sample size; the estimates reported and their standard errors or relative standard errors; and which auxiliary variables were used in the analysis.
Teacher’s Note: In practice, as students were working in pairs, each student was required to find one relevant study. Correct referencing was also expected.
Rationale: This section encourages students to research the literature for relevant previous studies, to think statistically in a domain specific area and be critical consumers of relevant reports (Goal 1) (ASA 2016, p. 9). Pedagogical considerations from CGUPSS include “presenting problems with a substantive context” (ASA Citation2014, p. 13).
3.2 Population and Creating the Sampling Frame
3.2.1 Target Population
In Section 2 of Part A, each pair of students needs to choose and define a target population, with a suggestion that the population size is at least 200. For example, the target population might be currently enrolled students at a particular university. To carry out any sampling of the defined target population, an administrative list is required.
3.2.2 Sampling Frame
A sampling frame is a list of sampling units from which the sample can be drawn (Lohr Citation1999, p. 3). Students are required to use the Islands administrative resources to create their sampling frame. For example, the Colmar University has 498 students listed (at time of writing) across different faculties.
Setting up the sampling frame using a spreadsheet tool (such as Microsoft Excel or Google Sheets) is the next task. Given the list of names, an ID variable can easily be created, then each person’s gender, age, town, and island in which they live can be collected by selecting each name listed. The About page provides a simple profile from which the additional information can be obtained ().
Fig. 1 Screenshot of a person’s profile living in the Islands.
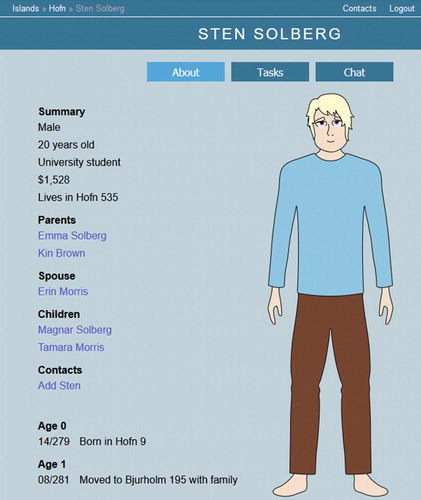
If a group chooses to study university students, for example, this page would hold information similar to what would be on any administrative list of students. At this stage, no one on the sampling frame has been contacted.
3.2.3 Data Manipulation
The final sampling frame is created by merging the separate spreadsheet files created by each student in the group. Some data cleaning may be required after the merge as each student may have used different cell formats or category codes in recording the data. Examples include the use of different numeric codes or the mixture of upper and lower cases when recording observations for nominal variables such as gender. Students are then required to import the data from a comma delimited file into SAS.
3.2.4 Population Information
The population can be described by creating appropriate summary tables and plots for the persons listed in the sampling frame. For example, the distribution of age by gender could be shown in a side-by-side boxplot.
Teacher’s Note: Students are not given explicit instructions here—the data manipulation and the choice of suitable tables and plots are part of the task. Creating the sampling frame is not a simple task in that there is no direct way to download the selected names; they have to be copied from the Islands webpage. If selecting university students, this can be done in a couple of different ways: all the names with the faculty headings can be copied and pasted into a text editor first, and then into a comma delimited file; or each set of names under each faculty can be copied and pasted. Any rows that comprise headings from the webpage can then be removed. As it takes time to record the data, it is suggested students within groups share this task and merge the separate files.
Some students encountered errors when importing the data from the spreadsheet file into SAS if there were empty cells or if certain cell formats had been set up. Another issue found by a group was that some students on their sampling frame graduated from the university in the middle of their data collection. The group managed the issue by taking a snapshot of the students on a particular date and explained what they did in their report. It is also possible for the age of some participants to change (as they could have a birthday) during the data collection phase. These unforeseen issues prompted discussion of issues that can arise over a long collection phase for a study and the need to define the scope of the target population.
Rationale: In Recommendation 1, suggestions include the “use of technology to effectively manage data, explore and visualize data” (ASA 2016, p. 16). Pedagogical considerations from CGUPSS include “experience with statistical computing and data-related skills” (ASA Citation2014, p. 13).
3.3 Simple Random Sample: Taking Measurements
The project states that the budget allows for a sample of n = 80 individuals in the pilot study. In Section 3A of the project, students are required to select a simple random sample (SRS) using SAS, and to report and interpret the resulting sampling weights ( where N is the population size, n is the sample size and
.
The next step requires obtaining consent from each Islander in their sample to participate in the study. For each sampled individual, selecting the Tasks page and then Spirometer under the topic of Physiology will request consent for FEV to be measured. If consent is granted, the FEV measurement will be taken. This takes time to complete: a white heart fills to show the progress, as shown in . The results of any tasks are recorded in the individual’s Tasks page.
Fig. 2 Screenshot of an Islander carrying out a task.
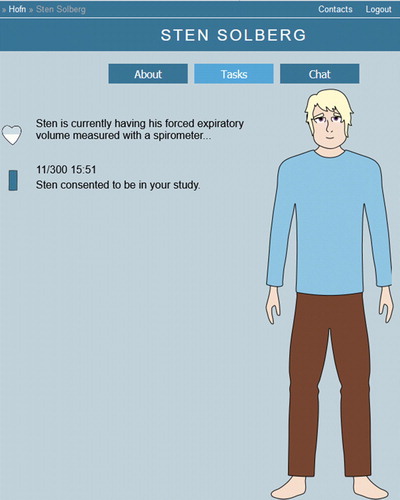
Students obtain experience with unit nonresponse if any individual does not grant consent. An adjustment to the sampling weights for any nonresponse can be made such that the sum of sampling weights for the responding sample participants is equal to the population size N. Students are required to report the response rate and describe their sample of individuals by creating appropriate summary tables and plots for any auxiliary variables.
Teacher’s Note: Choosing to set the same variable of interest for all students allows some comparability of submitted assessments for marking. The FEV measurement was chosen for a number of reasons: it is a continuous variable, relevant studies exist in the literature; and there is variability in the measurements between people. The concept of measurement may also be a point for class discussion. For example—are there different ways to measure FEV? For repeated observations, why would the maximum observation of FEV be the most appropriate in this context?
Students were provided with an example in class on how to make the adjustments to the sample weights.
Rationale: Using a physiological measure such as FEV encourages students to think statistically about appropriate statistical measures in context as in Recommendation 1 (ASA 2016, p. 12). The ability for the Islands inhabitants to give consent to performing a task such as measuring the FEV gives rise to a discussion of ethical issues which is stated in Goal 9 (ASA 2016, p. 11). The issues concerning missing data can also be a topic for class discussion.
3.4 Written Report—Part A
Part A of the project consists of a three page report for Sections 1, 2, and 3A to be submitted by each pair in pdf format by the end of the third week of the semester. Each student in the pair is expected to read, review and give feedback on each other’s contribution prior to submitting the report. In addition to the marking scheme, some suggestions for teamwork and some tips for writing reports are provided. Feedback is provided by way of written comments on the pdf document and a marking file (see Appendix B). For report style, only formative comments were provided in Part A, giving students the opportunity to make improvements in their written communication skills in Part B.
Teacher’s Note: At this stage of their degree, students may have had only limited experience in writing a statistical report. The author’s experience with students in this unit in previous years prompted the decision to split up the report into two parts for three main reasons: (1) to provide feedback on their choice of population which was especially helpful for correcting any misconceptions; (2) to provide feedback for their report writing style; and (3) to provide a deadline for Part A so that students engaged with the task early in the semester. Consultation times were well utilized by students asking very pertinent questions prior to the Part A deadline, showing timely engagement with the subject material.
Rationale: Recommendation 6 includes providing “useful and timely feedback” by way of formative assessment “to monitor and improve student learning.” Suggestions include assessments that are well coordinated with the topics as they are taught; written assignments that enable students to practice good communication skills; and encouraging students “to work in groups to promote learning from each other” (ASA 2016, pp. 21–22).
3.5 Simple Random Sample Analysis
Part B of the project comprises the analyses of the data collected from different sampling schemes. The focus of Section 3B is the analysis of the data from the simple random sample obtained in Section 3A.
3.5.1 Exploratory Data Analysis
Section 3B of the project involves using SAS to calculate summary statistics and create plots, for example, a histogram and a boxplot to describe the simple random sample for FEV. Students are required to comment on the magnitude of the population mean estimate and other summary statistics, such as the minimum and maximum values, with reference to the results found in the previous studies discussed in Part A.
3.5.2 Sampling Variance and Standard Error
Students calculate an estimate of the sampling variance and corresponding sampling standard error for the estimate of the population mean FEV. This requires an application of the appropriate formula using the (already calculated) sample variance obtained in SAS.
Teacher’s Note: Students soon realize that each time they take a sample, the result for the sample mean is different. This prompts discussion of the practical use of a random seed when taking samples using software. Further discussion could include: the concepts of a parameter; an estimator and its properties; and an estimate of that parameter (including notation). That is, for any one parameter, different samples will produce different estimates when samples are drawn using different random seeds. Although any one particular estimate of the mean may not coincide with the true mean value, overall the estimator is unbiased, as given in the sampling theory. Applying the formula for the sampling variance enables students to connect the sampling theory (applying the notation) with the SAS output from PROC SURVEYMEANS.
Rationale: The concept that different samples will produce different estimates of sample means and standard errors is an active learning outcome which applies to Goal 2: “understanding and applying the principles of representative sampling for an observational study” (ASA 2016, p. 9). Interpretation of the summary statistics and their graphical displays applies Goal 3 (ASA 2016, p. 9). Explaining the central role of variability is described in Goal 4 (ASA 2016, p. 10). Students compute and interpret various measures of variability, for example: the sample variance; the standard deviation; the range; and the interquartile range. Interpretation requires an understanding that these statistics are estimates of the corresponding finite population quantities. Students also need to understand the concepts of sampling variability as measured by the estimates of the sampling variance and sampling standard error, and the difference between a finite and an infinite population.
Goal 5 includes understanding the concept of “random,” the difference between a probabilistic and non-probabilistic sample, and the generalization of the results of an observational study to the population. Students are required to calculate the probability of selecting each individual in the sample, which is known and nonzero for a probability sample (Lohr Citation1999, p. 423). For a SRS, the n selection probabilities are equal for all sampled individuals. The sampling weights (wi, ), the reciprocal of the probability of selection, are reported in the output of the SAS Survey Means procedure. Interpretation of the weights is required, integrating the idea of generalizability. This section of the project reinforces the concepts that the sum of sampling weights is equal to the population size N; and that each sampled unit represents a certain number of units in the population (Lohr Citation1999, p. 103).
3.6 Stratified Random Sample—Preparation
In Section 4A of the project, students prepare to conduct a stratified random sample using their original sampling frame. Students need to propose and define two or more strata for the purposes of estimating the mean FEV in their target population, and justification for their choice. For example, if the target population is currently enrolled university students at Colmar University, then gender could be defined as the strata variable. Tasks include: determining the population size for each stratum (h) and analyzing their SRS sample from Section 3 by stratum. The report includes a comparison of the results between strata which involves tabulating basic summary statistics, creating histograms and side-by-side boxplots, and commenting on the results.
3.6.1 Proportional Allocation
Proportional allocation sets the sample size of stratum h to be proportional to the population size
. Students are required to determine the stratum sample sizes using proportional allocation given the total sample size (n = 80) and the population sizes particular to their study. The resulting sampling weight for each stratum can then be calculated and interpreted.
3.6.2 Optimal Allocation
Optimal allocation minimizes the variance of the population estimates according to a given constraint, commonly a fixed sample size or a fixed cost. In this section, students are required to calculate the stratum sample sizes using optimal allocation given a fixed sample size (n). The resulting sampling weight for each stratum can then be calculated and interpreted.
Teacher’s Note: This part of the project opens up discussion about defining the strata; to look for the variability of the sample means and variances in the sample summary statistics between strata; and the differences between proportional and optimal allocation. Discussion can also point to the results of the previous studies which were critiqued in Part A.
Rationale: Goals 2 to 5 are applied here similarly as in the previous section for SRS. However, in this section, to propose and define two or more appropriate strata, the students are required to describe and interpret the distribution of the FEV variable according to one or more other variables. This relates to the statistical thinking described in Goal 6 (ASA 2016, p. 10).
3.7 Stratified Random Sample—Statistical Analysis
Section 4B of the project involves using SAS to take two stratified random samples given their defined strata and stratum sample sizes, assuming both: (a) proportional allocation; and (b) optimal allocation. For each allocation, an estimate of the mean FEV and its associated sampling standard error may be computed using SAS.
Teacher’s Note: Discussion in class can include: why a stratified random sample might be taken rather than a SRS; and when different allocation methods might be applied. Students may need to create one new variable (using numeric codes) depending on their chosen strata. SAS requires the data to be sorted according to the stratum variable before stratified sampling occurs. SAS hints could be provided to alert students to these requirements. Some students chose to calculate the estimated sampling means and variances for each stratum first. They then showed how these are applied to obtain the overall estimates, thereby demonstrating conceptual understanding of the theory.
Rationale: Writing SAS code to analyse their data using a stratified sample; drawing conclusions and interpreting the output; understanding the theory behind the SAS procedures; are all principles and skills recommended in Goal 8 (ASA 2016, p. 11).
3.8 Summary and Conclusions
The final section of the project (Section 5) requires summarizing the results, and also making conclusions and recommendations in the context of the problem. This involves creating a summary table to report the results for the three sampling methods from the pilot study: SRS; stratified sampling with proportional allocation; and stratified sampling with optimal allocation. The design effect is a useful summary measure used to compare the efficiency of the sample estimate (a sample mean in this case) calculated by the complex (in this case stratified) sample design with that determined by SRS with the same number of observations. It is determined by calculating the ratio of the variances under each design, such that:
Students are required to calculate two design effects; one for each of the stratified allocation methods, and then discuss which sampling method they would recommend to the survey designers. Students are also asked to suggest an alternative definition for the strata that could be used, giving reasons for their suggestion; and to comment on the expected design effects.
Teacher’s Note: Some students had difficulty with summarising their results, which initiated some good discussion about report writing in general. Discussion included the interpretation of the calculated design effects. For the alternative strata definition, some students went beyond what was requested and performed further analysis.
Rationale: Being able to “write clearly,” and construct “compelling written summaries” as well as “effectively discuss results and conclusions” are important skills in statistical practice (ASA Citation2014, pp. 10–12).
3.9 Communicating Results in a Final Report
The final report for each pair of students is due in the 7th week of semester in pdf format and is limited to approximately seven pages (not counting references or appendices). It is expected to be read and agreed upon by each student before it is submitted. Marks are allocated for report clarity, relevance, and style. The use of section headings, well-constructed tables, appropriate visual displays, and appropriate use of appendices is required. SAS code is to be provided in an appendix. Correct referencing, both within text and in a reference section at the end of the report, of any relevant previous studies, websites or other resources is required.
In class, the importance of being able to demonstrate good written communication skills to future employers was emphasized. The report could be an item students upload to their e-portfolio or take to an interview.
Teacher’s Note: Some students chose to create their report in LaTeX, others in Word or Google Docs. The final reports were of a very high standard showing that students had made improvements to the report style given the formative feedback provided in Part A.
Rationale: The written report provides students with an experience of statistical practice: to “write clearly,” “construct effective visual displays and compelling written summaries.” The experience may also improve “the ability to communicate complex statistical methods in basic terms to managers and other audiences and visualize results in an accessible manner” (ASA Citation2014, p. 10).
3.10 Technology and Software
Students engaged with a virtual online environment called the Islands (described earlier in Section 2.1) to create their own sampling frame. Data collected from the Islands is imported into a spreadsheet file and then read into SAS for analysis. SAS (version 9.4, SAS Institute Inc., Cary, NC, USA) is the chosen software package for this unit of study, with particular focus on SAS procedures PROC MEANS, PROC SURVEYSELECT, and PROC SURVEYMEANS. The SAS code is to be submitted in the final report in an Appendix.
Teacher’s Note: Students may utilize SAS in certain labs on campus. They are encouraged to obtain the SAS University Edition which can be downloaded for free from http://www.sas.com/en_us/software/university-edition.html. Currently, SAS is used by several employers who recruit our graduates. This project could easily be adapted to use alternative software such as the Stata-Survey data suite of functions or the R-Survey package (Lumley Citation2010, Citation2020). Although SAS is used in this unit, other units utilize R software as the primary software package. A first year adaptation (Appendix A) utilizes SPSS.
Rationale: In Recommendation 1, suggestions include the “use of technology to effectively manage data, explore and visualize data” (ASA 2016, p. 16). Gaining experience with statistical software packages, including being able to interpret and draw conclusions from standard output is listed as Goal 8 (ASA 2016, p. 8). Recommendation 6 suggests the “use of technology to explore concepts and analyse data” (ASA 2016, p. 19). Under the “data management and computation” area, statistics programs should be developing students’ skills with professional statistical software and “should be able to manage and marshal data, joining data from different sources and formats and restructuring data into a form suitable for analysis” (ASA Citation2014, p. 10). This project enables those skills to be practised and further developed.
4 Assessment Structure
The project assessment is 15% of the total course marks: 5% for Part A and 10% for Part B. The sample surveys component is worth 50% of the course. See Appendix B for suggested marking guidelines.
4.1 Contribution Percentage
Each student is expected to contribute to each section of the report; guidelines are provided. Each student in the pair is required to provide two contribution percentages: one for themselves and one for their partner. A student receives 100% of marks awarded if their partner (and self) allocates 50% as the contribution. This strategy allows for the possibility of each student in the pair not contributing equally. If any of the contributions is less than 50%, the sum of the contributions (say X%) is calculated as (X% × mark awarded).
Teacher’s Note: On reflection and observation, the teamwork component motivates the students to communicate with each other and work in a timely manner to meet the deadlines as they do not want to disadvantage their partner. If any student allocates less than 50% to their partner, it is recommended the teacher discuss it with them to clarify any misunderstanding.
Rationale: The teamwork component of the project encourages collaborative learning where the emphasis is on students interacting to achieve a common goal, shown to reduce attrition in technical courses (Prince Citation2004). Developing skills in “teamwork and collaboration”—a critical component of statistical practice (ASA Citation2014, p. 13) is important to prospective employers.
5 Summary
This article is written to share an assessment item with other academics teaching in the statistics discipline (ASA Citation2014, p. 17). It describes a two-part project in sample survey design, developed especially for upper level undergraduate students. The project fosters an active learning approach, where theory and practice take place simultaneously, thereby enriching the curricula by addressing issues as they arise that may not have been formally included in lectures (Gomez-Blancarte and Ortega Citation2018). It allows a “synthesis of theory, methods, computation, and application” (ASA Citation2014, p. 13) and aligns with the GAISE recommendations (ASA 2016). The use of technology includes data collection from an online virtual population called the Islands (Bulmer and Haladyn Citation2011); data manipulation using spreadsheets; and statistical analyses using SAS.
The project provides an opportunity for students of statistics to work in pairs (or groups of three), where students are required to research and report on the relevant domain context. Students are encouraged to critique one another’s contribution and agree on their combined report. The teamwork provides a valuable and more realistic assessment in preparation for the workplace, which requires the “ability to collaborate in teams and to organize and manage projects” (ASA Citation2014, p. 10). The assessment is submitted in two stages, allowing authentic feedback on the first part, thereby offering an opportunity for students to refine their written communication skills (ASA Citation2014, p. 13) for the second part. The final report could be adopted as an example of a written piece of work to show to prospective employers.
Overall, this project enables the development and practice of many skills required of a graduate statistician in addition to developing statistical thinking and reasoning. The virtual population of the Islands provides a novel and engaging feature incorporated into an assessment task in survey sampling. The project can easily be adapted to first year students and also extended for students studying at Honors or Masters level (see Appendix A for more detail). The project is available as supplementary materials.
Supplemental Material
Download PDF (941.3 KB)Acknowledgments
Many thanks to Dr. Michael Bulmer for providing access to the Islands and for permission to include screenshots used in this article.
Supplementary Materials
The Sample Surveys Project Part A and Part B assessment task given to students
Orcid
Carole Louise Birrellhttp://orcid.org/0000-0003-3095-8191
References
- ASA (2014), “Curriculum Guidelines for Undergraduate Programs in Statistical Science,” American Statistical Association, available at https://www.amstat.org/asa/files/pdfs/EDU-guidelines2014-11-15.pdf.
- ASA (2016), “GAISE College Report ASA Revision Committee, ‘Guidelines for Assessment and Instruction in Statistics Education College Report 2016’,” available at http://www.amstat.org/education/gaise.
- Baglin, J., Bedford, A., and Bulmer, M. (2013), “Students’ Experiences and Perceptions of Using a Virtual Environment for Project-Based Assessment in an Introductory Online Statistics Course,” Technology Innovations in Statistics Education, 7, 1–15.
- Baglin, J., and Huynh, M. (2015), “Using the Island to Teach Statistics Through Data Investigations: A Pilot Project in Australian Secondary Schools,” in Proceedings of the Australian Conference on Science and Mathematics Education, Curtin University, September 30th to October 1st, 2015, pp. 87–92, available at https://openjournals.library.sydney.edu.au/index.php/IISME/article/view/8785/9039.
- Baglin, J., Reece, J., and Baker, J. (2015), “Virtualising the Quantitative Research Methods Course: An Island-Based Approach,” Statistics Education Research Journal, 14, 28–52.
- Baglin, J., Reece, J., Bulmer, M., and Di Benedetto, M. (2013), “Simulating the Data Investigative Cycle in Less Than Two Hours: Using a Virtual Human Population, Cloud Collaboration and a Statistical Package to Engage Students in a Quantitative Research Methods Course,” in Proceedings of the Joint IASE/IAOS Satellite Conference, Macao, China, August, 2013, available at http://iase-web.org/documents/papers/sat2013/IASE_IAOS_2013_Paper_2.1.3_Baglin_et_al.pdf.
- Bulmer, M., and Haladyn, J. K. (2011), “Life on an Island: A Simulated Population to Support Student Projects in Statistics,” Technology Innovations in Statistics Education, 5(1), available at https://escholarship.org/uc/item/2q0740hv
- Fecso, R., Kalsbeek, W., Lohr, S., Scheaffer, R., Scheuren, F., and Stasny, E. (1996), “Teaching Survey Sampling,” The American Statistician, 50, 328–340. DOI: 10.2307/2684930.
- Gomez-Blancarte, A., and Ortega, A. S. (2018), “Research on Statistical Projects: Looking for the Development of Statistical Literacy, Reasoning and Thinking,” in Proceedings of the International Conference on Teaching Statistics (ICOTS10), Kyoto, Japan, July 8–13, 2018, available at https://iase-web.org/icots/10/proceedings/pdfs/ICOTS10_1E3.pdf.
- Horton, N. J., and Hardin, J. S. (2015), “Teaching the Next Generation of Statistics Students to ‘Think With Data’: Special Issue on Statistics and the Undergraduate Curriculum,” The American Statistician, 69, 259–265. DOI: 10.1080/00031305.2015.1094283.
- Hulsizer, M. R., and Woolf, L. M. (2008), Guide to Teaching Statistics: Innovations and Best Practices, Hoboken, NJ: Wiley.
- Huynh, M., Baglin, J., and Bedford, A. (2014), “Improving the Attitudes of High School Students Towards Statistics: An Island-Based Approach,” in Proceedings of the International Conference on Teaching Statistics (ICOTS9), Flagstaff, AZ, USA, July 13–18, 2014, available at https://icots.info/9/proceedings/pdfs/ICOTS9_9G2_HUYNH.pdf.
- Linden, M., Baglin, J., and Bedford, A. (2011), “Teaching Clinical Trial Design and Management Using an Online Virtual Environment,” in Proceedings of the Australian Conference on Science & Mathematics Education, Melbourne, Australia, September 28th–30th, 2011, pp. 107–113, available at http://openjournals.library.usyd.edu.au/index.php/IISME/article/view/4812.
- Lohr, S. L. (1999), Sampling: Design and Analysis, Pacific Grove, CA: Brooks/Cole Publishing Company.
- Lumley, T. (2010), Complex Surveys: A Guide to Analysis Using R, Hoboken, NJ: Wiley.
- Lumley, T. (2020), “Survey: Analysis of Complex Survey Samples,” R Package Version 4.0, available at https://cran.r-project.org/web/packages/survey/index.html.
- Prince, M. (2004), “Does Active Learning Work? A Review of the Research,” Journal of Engineering Education, 93, 223–231. DOI: 10.1002/j.2168-9830.2004.tb00809.x.
- Tirlea, L., Baglin, J., Huynh, M., and Elphinstone, B. (2016), “A Pilot Experimental Study Comparing Different Active Learning Strategies for Understanding Sampling,” in OZCOTS 2016: Proceedings of the 9th Australian Conference on Teaching Statistics, Canberra, December 8–9, 2016, pp. 27–31, available at http://iase-web.org/documents/anzcots/OZCOTS_2016_Proceedings.pdf.
Appendix A
The author has already adapted this project for Honors and Masters level students and also for first year students. The main differences are summarized below.
A.1 Extension for Honors or Masters Level Students
This project has been adapted to suit Honors or Masters level students. This has been achieved by extending the project’s level and breadth (ASA Citation2014, p. 15) to include a section on cluster sampling which is only very briefly discussed in the six weeks of lectures. The extension comprises a separate 20-min audio-visual presentation in video format which is carried out individually. It includes a summary of the basic theory, including definitions of formula and notation for probability of selection; intraclass correlation; effective sample size; and design effect. An application of the theory using the Islands is to be demonstrated: to carry out sampling and analysis using SAS; and to explain the differences between cluster sampling and stratified random sampling.
Alternative extensions will be informed by the length of the unit and the topics included in the curriculum. For example, it could also include ratio or regression estimation.
A.2 An Adaptation for First Year Students
The Islands has also been used in a simplified assessment task for first year students. Students were required to work in pairs (or groups of three), could choose any variable of interest and were required to sample forty individuals from two different populations to give a total of 80 sampled individuals. They were required to provide context for their chosen variable. For example, if measuring blood glucose levels for a certain age-group, the context includes determining what the normal range might be for that age-group. The sampling frame can be built in a spreadsheet tool, then imported into SPSS to carry out the sampling and analysis. The assessment required a two-page written report (in pairs) which meaningfully compared their two samples, using tables of relevant summary statistics and plots and interpreting their results in light of the context of their variable. Each student had to write a peer review paragraph describing what they learned in collaborating with their partner.
To adapt to larger classes, the project could be carried out in groups of three or four students. Another adaptation would be to specify the variable of interest and to provide the sampling frame. These adaptations would reduce student workload and the marking workload for the teacher. In our experience, a teaching assistant helped with the marking at first year level. One final report was submitted only, which meant feedback on report style by the marker was only provided with the final mark. Instead, each student within each pair was asked to peer review the other’s work. To help reduce the possibility of plagiarism, we allocated students in different lab classes to focus on different people groups from the Islands. For example, students in Lab class 1 were instructed to obtain data from primary school students; other people groups allocated were high school students; university students; and employed individuals. Although students dealt with the instructions well, in retrospect it would have been more straightforward to set one variable of interest per lab class and supply the various sampling frames.
The issue with the participants’ changing ages and graduating students on the Islands was also experienced by some groups. First year students were unsure how to handle this compared with those in the upper level statistics unit, showing their inexperience in statistical problem solving.
Appendix B:
Marking Guidelines
A marking spreadsheet was set up and provided to students.
Table
Table