
 ?Mathematical formulae have been encoded as MathML and are displayed in this HTML version using MathJax in order to improve their display. Uncheck the box to turn MathJax off. This feature requires Javascript. Click on a formula to zoom.
Abstract
The aim of this study is to explore the judgments and reasoning in probabilistic tasks that require comparing two probabilities either with or without introducing an additional degree of uncertainty. The reasoning associated with the task having an additional condition of uncertainty has not been discussed in previous studies. The 66 undergraduate students, participants in this study, used an analytic process for the task without an additional condition of uncertainty and a heuristic for the task with it. The findings show that they focused on the most likely event and derived a prediction based on this event that, in some cases, led them to answer incorrectly. The educational implications include a gradual method for developing better intuition for the students to help them tackle similar problems in the future.
1 Introduction
Urn tasks have been used to represent a chance process and play an important role in probability. Already in the 18th century the French philosopher and mathematician Condorcet concluded that all questions in computing probabilities can be reduced to a single hypothesis regarding a certain quantity of balls of different colors mixed together from which different balls are drawn randomly in a certain order or in a certain proportion (Daston Citation1980). In this study, two urn tasks involving white and black balls were presented to the participants in a computerized test. The first task required the participants to compare probabilities of randomly drawing a black ball from Urns A and B containing white and black balls each. The second task was to determine how the probability of drawing a random ball from Urn B would change after transferring a random ball from Urn A to Urn B. These two tasks differ in their content but can be solved analytically in the same way by comparing probabilities.
The aim of this study is to explore the judgments and reasoning in probabilistic tasks that require comparing two probabilities either with or without introducing an additional degree of uncertainty. To the best of our knowledge, there is no research exploring the probabilistic reasoning in urn tasks that involve an additional condition of uncertainty as described in this paper. An exploration of the difference between the accuracy of responses in the two tasks and a comparison of reaction times provides an opportunity to understand the reasoning processes associated with these two kinds of tasks.
2 Theoretical Background
2.1 Intuitive Beliefs and Misconceptions in Probability
A large body of research exists about intuitive beliefs and misconceptions in probability for students of different ages, beginning from elementary, middle, and high school to college, university, and prospective teachers (e.g., Batanero and Sanchez Citation2005; Giuliano et al. Citation2006; Rubel Citation2007; Chernoff Citation2012; English and Watson Citation2016). Misconceptions in different topics of probability among college students are common (e.g., Giuliano et al. Citation2006; Khazanov Citation2008), including the conditional probability topic relevant to this study (Jones, Langrall, and Mooney Citation2007).
Many studies have documented that probability is a domain known to elicit intuitive probability-based inferences, faulty heuristics, biases, schemas, and misconceptions that often conflict with mathematical theory and lead to incorrect responses (Fischbein and Schnarch Citation1997; Kahneman Kahneman Citation2011; Wedell Citation2011; Meder and Gigerenzer Citation2014; Kapon et al. Citation2015).
Probabilistic reasoning consists of drawing conclusions about the likelihood of uncertain events. Of particular relevance to the present article are studies that have suggested different kinds of probabilistic reasoning under uncertainty (Kahneman, Slovic, and Tversky Citation1982; Konold et al. Citation1993; Watson and Kelly Citation2009). Tversky and Kahneman (Citation1983) conducted landmark studies on human understanding of probability; they investigated the ways that humans use, or fail to use, normative probabilistic reasoning when faced with situations involving chance and uncertainty. For example, people use the availability heuristic to estimate the likelihood of events on the basis of how easy it is for them to call to mind particular instances of the event (Kahneman and Tversky Citation1973).
Konold (Citation1989) first introduced the terminology of outcome approach to describe a model of probability that leads students to make yes or no decisions when faced with uncertain events. He argued that students interpret a statement about the probability of an event as a prediction that the event will occur (i.e., students’ predictions were often based on a deterministic model of the situation). Specifically, a probability of less than 0.5 would imply that the event will not happen, a probability of over 0.5 would imply that the event will happen, and a probability of 0.5 would imply that it is impossible to predict whether the event will happen. The outcome approach derives from a failure to understand that probability depicts a sample space rather than a single outcome. Other studies of students’ reasoning documented that when students had to make predictions from sample data that involve uncertainty they tended to articulate strong deterministic statements. Before intervention students tended to express either extreme confidence in their conclusion or decided that they cannot make any conclusion. They rarely performed an accurate probabilistic analysis (Ben-Zvi et al. Citation2012).
2.2 Dual-Process Theory
Dual-process theorists (e.g., Kahneman and Frederick Citation2005; Evans Citation2006) suggest that reasoning occurs through two distinct types of processing. They characterize the intuitive/heuristic process (System 1) as fast, automatic, with little cognitive effort; the analytical process (System 2) is considered as slower, controlled, deliberate, and effortful. The two general types of reasoning processes tend to be used in making probabilistic judgments (Tversky and Kahneman Citation1983; Klaczynski Citation2001; Kahneman and Frederick Citation2002; Bonner and Newell Citation2010). On the one hand, people use analytic processes, for example, when calculating the probability of a particular event in a sample space with equally likely outcomes (e.g., the number of outcomes favorable to that event divided by the total number of all outcomes). On the other hand, people develop individual heuristics, that is, intuitive rules for analyzing the probabilities of real-world events. In some cases, judgments based on heuristics match those made with analytic probability theory; in other cases, the decisions are different and inconsistent.
2.3 Intuitive Rules Theory
According to the intuitive rules theory, people of different ages use a small number of intuitive rules that influence their solutions to a wide variety of conceptually non-related tasks that share some common features. Many alternative conceptions related to different domains are inspired by the use of these rules (Stavy and Tirosh Citation1996). The theoretical framework for developing these rules is Fischbein’s (Citation1987) theoretical model of intuitions. These rules are considered to be intuitive (Stavy et al. Citation2006) because the learners see such explanations as sufficient in addition to being self-evident and use them with great confidence. Furthermore, responses in line with them are considered absolute to the learners and alternatives are excluded as unacceptable (Fischbein Citation1987; Stavy and Tirosh Citation2000). The idea of intuitive rules has been supported by reaction time research and brain imaging research (Stavy et al. Citation2006; Babai et al. Citation2010).
2.4 Reaction Time
The reaction time technique is widely used in cognitive science; it measures the time interval between stimulus presentation (e.g., visual or auditory) and response execution (typically, pressing a button). Generally, the longer the reaction time, the more complex the reasoning process (Denes and Pizzamiglio Citation1999; Spieler Citation2000). One of the claims made in the dual-process theory is that the heuristic process (System 1) is faster than the analytical process (System 2). Comparing the reaction time between the two tasks helps to identify whether a response is the result of a heuristic or an analytic process.
3 Description of the Computerized Tasks
Urn tasks in probability transform real-life problems into drawing balls of two or more different colors. Drawing balls from urns is a visual mechanism to conceptualize the principles of discrete probability. A famous urn problem is the Pólya urn model where a ball is added to the urn, depending on the color of the previous ball drawn from the urn (e.g., DasGupta Citation2010).
Inspired by many studies of understanding probability, we used urn tasks of binary comparisons (Babai et al. Citation2006; Falk, Yudilevich-Assouline, and Elstein Citation2012; Stavy, Babai, and Kallai Citation2016). A typical probabilistic task presents the participants with two containers (e.g., urns, boxes, jars, etc.) of elements (e.g., balls, marbles, beads, etc.) in two different colors; participants are then asked to compare the probabilities of drawing randomly an element of a specific color from the two containers. Ansari et al. (Citation2007) found that subjects respond to symbolic number comparisons (e.g., 3 vs. 4) faster and more accurately than to nonsymbolic comparisons (e.g., drawing of dots). This study’s and other studies’ methods were used to devise two tasks; both tasks used symbolic numbers. Each symbolic number represented the number of balls in the corresponding color.
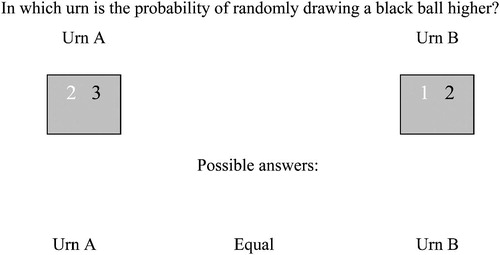
The first task of our computerized test, a comparison of probabilities (CP), asked participants to compare probabilities of randomly drawing a black ball from two different urns ().
Fig. 1 Example for a trial in the comparison of probabilities task.
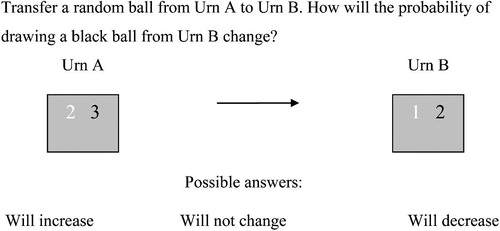
The second task of our computerized test, an additional condition of uncertainty (ACU), asked participants to decide how the probability of randomly drawing a black ball from Urn B would change after transferring a randomly selected ball from Urn A to Urn B (). This task involved not only the uncertainty of the color drawn from Urn B at the second stage of the experiment, but also an additional uncertainty condition about the color of the ball that was transferred from Urn A to Urn B on the first stage.
Fig. 2 Example of a trial in the additional condition of uncertainty task.
In our experiment Urn A was displayed on the right side of the screen and Urn B on the left, since the tasks were given in a right-to-left language. These two tasks differ in their content and question but can be solved analytically in the same way as explained below. The ACU task can be solved by comparing the probabilities of drawing a black ball from the two urns. For example, if the probability of randomly drawing a black ball is higher in Urn A than in Urn B, transferring a random ball from Urn A to B will increase the probability of randomly drawing a black ball in Urn B. The intuitive understanding of why this is the solution to the problem can be illustrated by considering an analogous task with two containers that contain sugar solutions. The black balls are analogous to teaspoons of sugar and the white balls are analogous to cups of water. The sweetness of the solution is analogous to the probability of drawing randomly a black ball. Deciding how the sweetness in container B would change after pouring a cup of solution from container A into container B depends on the relative sweetness of the cup of solution being transferred that requires a comparison of the proportions of sugar in the two original solutions. Analogously to the solution task, the selection and transfer of a colored ball require comparing the probability of drawing a black ball in both urns to solve the ACU task. If the probability is higher for Urn A than Urn B, the transfer will increase the probability of Urn B; if the probability is less for Urn A than Urn B, the transfer will decrease the probability of Urn B.
The mathematical logic and reasoning are shown in the following analysis. Let b and w be the number of black and white balls in Urn B, respectively; both b and w represent natural numbers. B0 represents Urn B before the transfer while B1 represents Urn B after the transfer. The probability of drawing a black ball from Urn B before the transfer is . Let us denote by
the probability of randomly drawing a black ball from Urn A, which is equivalent to the probability of transferring a black ball from Urn A to Urn B.
According to the total probability formula , where Ai .. are pairwise disjoint events whose union is the entire sample space, the probability of randomly drawing a black ball from Urn B after transferring randomly a ball from Urn A to Urn B is
The probability of drawing a black ball in Urn B after the transfer is calculated by combining the probability of each event (i.e., transferring a black or a white ball from Urn A) with the probability of the prediction given that event. The probability of randomly drawing a black ball will increase if . This condition is equivalent to
.
Put differently, the probability of randomly drawing a black ball after the transfer will increase if the is higher than the initial probability of drawing a black ball in Urn B. Similarly, the probability of randomly drawing a black ball after the transfer will decrease if
is lower than the probability in Urn B. The probability of randomly drawing a black ball after the transfer will not change if
is equal to the probability in Urn B.
4 Approach and Aim of the Study
In this study, we focused on the reasoning processes of participants in probabilistic tasks with and without an additional condition of uncertainty. When participants are faced with a problem that includes an occurrence of uncertain events, will their prediction rely on the occurrence of the most likely event? That is, will participants overweight the most likely event and act as if this event will happen with absolute certainty while ignoring the effects of other possible events? Although it might seem strange to ignore other possible events, previous research (Kahneman, Slovic, and Tversky Citation1982; Eshach and Schwartz Citation2002) suggests that people of different ages do not always use all available information in making a decision.
The novelty of this research is in exploring the probabilistic reasoning in tasks that involve an additional condition of uncertainty. Specifically, we refer to the context of the additional condition of uncertainty task used in this study in which the color of the ball that will be transferred from Urn A is an uncertain event. In trials where there are more black balls than white balls (i.e., the probability of drawing a black ball is greater than 0.5) in Urn A, the likely event is that a black ball will be transferred from Urn A to Urn B. If participants judge as though this likely event does occur, namely, that a black ball will be transferred from Urn A to Urn B, they will determine that the probability of drawing a black ball from Urn B will increase. Likewise, when there are more white balls than black balls in Urn A, they will likely determine that the probability of drawing a black ball from Urn B will decrease. Since this heuristic does not take into account the less likely event and the ratio between the urns’ proportions, it is not generally applicable; in some tasks, it will lead to incorrect judgments. Unlike the ACU task, in the CP task there is no additional uncertain event involved. Participants were expected to use their analytic reasoning in this task by calculating and comparing two probabilities. This type of reasoning is expected to lead to a high accuracy of judgments.
The following research questions were addressed:
Is there any difference in the accuracy of responses for each task between the two groups of participants: the group that started with the CP task and the group that started with the ACU task?
Is there any difference in the accuracy of responses between the CP task and the ACU task?
How does
, the probability of transferring a black ball from Urn A to Urn B, influence participant responses?
Is there any difference in the response times between the CP and ACU tasks for different values of
5 Method
The experimental design used in this study documented the performance and reaction time of volunteer college participants. The tasks and sequence of presentation were balanced across the participants.
5.1 Participants
The participants were 66 undergraduate Hebrew-speaking students (29 males and 37 females) who had previously studied a course in probability (probability axioms, conditional probabilities, determining probabilities using tree diagrams, Bayes’ rule) in college in central Israel. All participants participated in classes that aimed to help them develop the required formal knowledge on probability to solve both tasks. During these classes, our students got exposed to a few examples in the context of balls and urns but most of the problem they faced was presented in a different context. Most (>90%) of the participants were business management students. Their mean age was 24.5 years (SD = 2.1). Only students who were not eligible for extended time in tests (or specifically, who had not been diagnosed with attention deficit hyperactivity disorder, dyscalculia, dyslexia, or motor problems) participated. This deselection was made since students with attention or learning disorders are typically less accurate, slower, and have more variable reaction times compared with other (Leth-Steensen, Elbaz, and Douglas Citation2000; Metin et al. Citation2013; Peters et al. Citation2018).
5.2 Materials
The participants were presented with two computerized tasks that can easily and quickly measure their reaction time. Each task included 80 experimental trials. Each trial presented two urns, each containing white and black numbers representing the quantity of balls of the two colors. The trials in both tasks had the same urn composition and the same order as was used in Stavy, Babai, and Kallai (Citation2016). The trials were classified into nine categories based on three ranges of :
and
and the three possible formal correct judgments ().
Table 1 Description of the trials classified according to and the formal correct judgment.
The preliminary analysis obtained an equal number of trials across all categories by selecting 45 trials out of the 80 original trials: five trials from each of the nine categories. In the original test, the distribution of trials in categories was such that the minimum number of trials across the nine categories was five. For those specific categories, the entire five trials were chosen. To counter-balance the effect of total numbers of balls, the trials were chosen in a way so that for each trial there is a counter-trial, where in each urn the colors of the balls are exchanged. For example, the trial [2/3 1/2] has a counter-trial [3/2 2/1]. Trials where the number of black and white balls is equal in both urns serve as their own counterbalance. The results and analysis reported in this article are based on these 45 trials distributed across the following types:
Type-A trials—The formal correct judgment is the probability is higher in Urn A in the CP task, and the formal correct judgment is the probability will increase in the ACU task.
Type-B trials—The formal correct judgment is the probability is higher in Urn B in the CP task, and the formal correct judgment is the probability will decrease in the ACU task.
Type-E trials—The formal correct judgment is the probability is equal in the CP task, and the formal correct judgment is the probability will not change in the ACU task.
5.3 Procedure
The experiment was run individually in a computer laboratory where the participants were randomly assigned to two groups that differed in the order of task presentation. The participants in the first group (Group I) were first presented with the CP task. After completing it and taking several minutes of recess, they were presented with the ACU task. The purpose of the recess was to allow participants to rest after completing a relatively lengthy trial. Moreover, as the two trials resembled each other, the recess served as a separator to reduce any confusion that might occur if the two trials were given one after the other. The second group (Group II) responded to the same tasks but started with the ACU task. The trials were presented on a computer screen, using SuperLab 5 Pro© software (http://www.superlab.com). The experiment was divided into three principal parts.
5.3.1 Part 1: Instructions
Instructions were presented to participants on a computer screen and included a description of the task and the way to choose among the possible responses. To encourage participants to respond intuitively rather than making computations, they were asked to respond correctly and as fast as they could; they were not informed of the number of tasks ahead of them. However, they were not limited in time for each task or for the whole session. In the CP task, participants were asked to compare the probabilities of randomly drawing a black ball between the two urns, that is, to judge whether the probability is higher in Urn A or Urn B, or the two probabilities are equal. Each trial was presented on the screen until the participant responded. The orientation of the keys matched the layout of the urns on the screen; In the ACU task, participants were asked to judge whether the probability of drawing a black ball from Urn B will increase, decrease, or not change after transferring a random ball from Urn A to Urn B. Each trial was presented on the screen until the participant responded: will increase, will decrease, or will not change.
5.3.2 Part 2: Practice Set
Participants were presented with a practice set of eight trials (different from the experimental ones) to familiarize them with the task and the experimental setting.
5.3.3 Part 3: Experimental Setting
Participants were presented with the experimental setting of 80 trials. Their responses and reactions time were recorded. Finally, a slide that indicated the end of the test was presented.
6 Results
This section consists of four subsections: comparison of the accuracy of responses between the two different groups of participants; comparison of the accuracy of responses and the typical responses between the two tasks; the influence of , (the probability of transferring a black ball from Urn A to Urn B), in each task on the participants’ responses; and the comparison of reaction times between the two tasks.
6.1 Comparing the Accuracy of Responses Between the Two Groups
An independent samples t-test was used to compare the accuracy of responses for each task between the two different groups of participants: Group I (n = 34) that started with the CP task and Group II (n = 32) that started with the ACU task. Results showed no discernible differences in the accuracy of responses between these two groups. Consequently, further statistical analyses were performed for all participants.
6.2 Comparing the Accuracy of Responses Between the Two Tasks
A paired samples t-test was used to explore the difference in the accuracy of responses between the CP and ACU tasks. summarizes the accuracy of responses indicating a discernibly (significantly) higher accuracy in the CP task in two of the three types of trials. The only case where there was no discernible difference was the Type-A case in which , where the accuracy of the ACU task was relatively high in comparison to other performances of this task. A possible explanation for this is that the participants’ intuitive reasoning (i.e., more black balls than white balls in Urn A will increase the probability of drawing a black ball in Urn B) matched the formal correct judgment. Surprisingly, in the Type-B case where
and intuitive reasoning matched the correct judgment, there was still a discernible difference between the two tasks favoring the CP task. A possible explanation for this is that the participants were asked about the probability of a black ball while the likely event, in this case, is that a white ball was transferred to Urn B. This might have confused them and decreased the accuracy of their responses in the ACU task.
Table 2 Comparison of the accuracy of responses between the two tasks (N = 66).
In each probability range , there are three possible formal correct judgments; the correct judgment depends on the relation between the probabilities of drawing a black ball from the two urns.
6.3 The Influence of on Participants’ Responses
The main hypothesis was that the probability range for drawing a black ball from Urn A would predict the participant’s response in the ACU task. In other words, those trials where would be more likely to respond will increase while those trials where
would be more likely to respond will decrease. In contrast, for the CP task, the hypothesis was that the correct judgment of each trial would predict the participant’s response.
Multinomial logit models with random effects (using generalized linear model SPSS software version 22) were employed to predict the participants’ responses. These models are used when subjects respond to several related multiple-choice questions in which the response categories are nominal/ordinal with more than two categories (Hartzel, Agresti, and Caffo Citation2001). In this study, these models were used to analyze the association of , the formal correct judgment (type of trial), and their interactions with the Group (I, II) and with the participant’s response. In these models, subjects were considered as random effects while the
, the correct judgment and their interactions with the Groups (I, II) were considered as fixed effects. The models were analyzed separately for each task.
6.3.1 Results for the Comparison of Probabilities Task
The multinomial logit model with random effect revealed a discernible interaction between the correct judgment and the group, F(2, 2950) = 7.91, p < 0.001, and a marginally discernible interaction between and group, F(2,2950) = 2.29, p = 0.06. Therefore, the models were analyzed separately for each group.
The multinomial logit model produces Exp(β), coefficients called odds ratios (OR) that can be interpreted as how a particular independent variable affects the odds of an outcome’s occurrence. The OR evaluates whether the odds of a certain event or outcome is the same for two groups. Specifically, the OR measures the ratio of the odds that an event or result will occur to the odds of the event not happening. An OR = 1 indicates that the event is equally likely to occur in both groups. An OR > 1 indicates that the event is more likely to occur in the comparison group. summarizes the ORs of the participants’ responses between two ranges of and two types of trials. For instance, regarding the CP task, Type-A trials are more likely than Type-E trials to be responded Urn A (i.e., the odds for Type-A trials in Group I are 202.92 times the odds for Type-E trials). In other words, when the probability of drawing a black ball is higher in Urn A, the participant’s response Urn A is more likely than the response equal. Unsurprisingly, in this task, there is a strong association between those two variables, which explains the large OR’s in the results.
Table 3 Associations of and the correct judgment with participants’ responses in each task.
Monson (Citation1980) suggested an interpretation of the values for OR’s such that 1.2 < OR 1.5 indicates a weak association, 1.5 < OR
3 indicates a moderate association, and OR > 3 indicates a strong association. Other researchers (e.g., Taubes Taubes Citation1995; Oleckno Citation2008) have adopted Monson’s rule as a guideline for judging the strength of the OR effect. Following this rule, shows that (a) within the CP task, the OR’s of trial-types greater than 3 in both groups indicates that trial-types have a strong association with participants’ responses and (b)
had no association with participants’ responses in group I (i.e., the ORs are not discernibly different). However,
had a moderate association with participants’ responses in Group II.
6.3.2 Results for the Preceding Condition of Uncertainty Task
The multinomial logit model with random effects indicated that had the highest effect in predicting the participants’ responses, F(4, 2950) = 95.25, p < 0.001. The correct judgment also had a discernible effect in predicting participants’ responses, F(4, 2958) = 5.95, p < 0.001. This model revealed no discernible interactions between the correct judgment and the group, F(2, 2950) = 0.81, p = 0.52, and between
and group, F(2, 2950) = 1.72, p = 0.14.
shows that most of the ORs of are greater than 3, which indicates that
has a strong to infinite association with participants’ responses. For instance, trials where
are more likely than trials where
to be responded will increase (the odds for trials where
are 10.87 times the odds for trials where
). Moreover, shows that the correct judgment has a weak to moderate association with the participants’ responses.
Table 4 Distribution of participants’ responses in the additional condition of uncertainty task according to two specific compositions of Urn A, with several different compositions of Urn B (for the same Urn-A composition) and the formal correct judgment.
To illustrate the influence of the probability of drawing a black ball in Urn A on the participants’ responses in the ACU task, more detailed results for two representative compositions of Urn A with several different compositions of Urn B are depicted in . To reach the formal correct judgment, participants have to compare the probabilities of drawing a black ball between the two urns. However, participants’ responses are affected by the composition of Urn A, regardless of the composition of Urn B. When , the probability of transferring a black ball from Urn A to Urn B is less than a half; the most frequent response is that the probability of drawing a black ball from Urn B will decrease regardless of the initial composition of Urn B and the formal correct judgment. Similarly, when
, the most frequent response is that the probability of drawing a black ball from Urn B will increase regardless of the initial composition of Urn B and the formal correct judgment. These setups illustrate that not only are most responses according to the probability of drawing a black ball but also most of the participants judge according to the composition of Urn A.
6.4 Comparing the Reaction Times Between the Two Tasks
Another way to learn about the reasoning processes involved in solving these tasks is to compare participants’ reaction times between the two tasks. depicts this comparison (N = 66) according to the probability range and the formal correct judgment.
Table 5 Comparison of the reaction times in milliseconds between the two tasks.
When , the reaction time in the CP task is discernibly longer than in the ACU task. However, when
, reaction times revealed different results that can be distinguished as two subcases. When the probability of drawing a black ball is 0.5 in both urns, the reaction time in the CP task is discernibly shorter than in the ACU task. When the probability of drawing a black ball is not equal in the two urns (i.e.,
and
), the results show no discernible difference between the reaction times.
7 Discussion
7.1 General Discussion
The processes associated with responding to two tasks requiring different levels of probabilistic reasoning were explored. These tasks have different content and questions but can be solved in the same analytic way by comparing probabilities. Overall, the study revealed that the reasoning processes used by participants (that who do not represent a random sample of students) in the comparison of probabilities task are different from those used in the additional condition of uncertainty task.
Unsurprisingly, the results show that the accuracy of responses in the CP task is substantially higher than in the ACU task. In the CP task, 70% (n = 46) of the participants responded correctly to above 60% of the trials; in the ACU task, only 3% (n = 2) responded correctly to above 60% of the trials. In the CP task, the typical response of participants was according the formal correct computation; in , for example, for trials where the correct judgment was Urn A, the odds to respond Urn A for Group I were 5.92 times the odds of those where the correct judgments were Urn B. In this task, the number of balls in each color is known in both urns and there is no additional uncertainty; it seems that the participants used their formal probabilistic knowledge. In the ACU task, the number of balls in each color in Urn B after randomly transferring a ball from Urn A is unknown and the analytical computation is more difficult. As the results show, participants responded based on the likely event that may occur. That is, when the probability of drawing a black ball in Urn A was greater than 0.5—or the likely event was that a black ball will be transferred from Urn A to Urn B—the frequent response was will increase. It was also revealed that the odds in trials where were 10.87 times those in trials where
and 1.86 times those where
to be responded will increase (). Similarly, when
—or the likely event is that a white ball will be transferred from Urn A to Urn B—the frequent response was will decrease. It was also revealed that the odds in trials where
and the response would be will decrease were 14.55 times those in trials where
and 6.29 times those trials where
().
Participants’ typical responses were according to the reasoning described above, even for a set of tasks with an identical composition of Urn A and several different compositions of Urn B. The different compositions of Urn B affected the formal correct judgment but did not change the participants’ responses. When , a typical response cannot be ascertained. In this case, there is not a higher probability of drawing a black ball from Urn A. In this study, participants were faced with an uncertainty that manifested itself in the unknown ball color to be transferred from Urn A to Urn B. When faced with uncertainty, the participants’ judgments were based on the likely event. Specifically, the participants solved the problem as if the more probable ball color in Urn A will be transferred to Urn B.
With regard to reaction times, interesting results were found when (i.e., when there is a majority color in Urn A). In these cases, the reaction times in the ACU task were discernibly shorter than those in the CP task. As previously mentioned, studies have shown that the longer the reaction time, the more complex the reasoning process is (Denes and Pizzamiglio Citation1999; Spieler Citation2000). At first glance, this finding may seem puzzling and inconsistent with the above analysis that suggests the CP task is simpler than the ACU task. However, the shorter reaction time is in line with the erroneous heuristic that participants may use in the ACU task. A strategy that assumes their reasoning depends only on the probability of drawing a black ball from Urn A requires the respondent to compare the number of black and white balls only in Urn A. It is certainly easier than comparing two probabilities as required in the CP task. These findings are congruent with the theory of Kahneman and Frederick (Citation2002) who explain that, sometimes when individuals have to make a judgment that is complex, they substitute instead a more easily calculated heuristic. Kahneman (Citation2000) argued that the difference in processing time—heuristic processing is faster than analytic processing—serves as a basis to identify whether a response is the result of a heuristic or an analytic process (Stupple, Ball, and Ellis Citation2013).
The present study supports the conclusions of other studies (Evans and Curtis-Holmes Citation2005; Leron and Hazzan Citation2009; Evans Citation2010; Banks and Hope Citation2014) that documented people’s use of analytic and heuristic processes. This study presents two different levels of tasks that can be solved in the same analytic way; however, participants solved one task analytically (System 2 process) and the other task heuristically (System 1 process). In the simpler task, where the number of balls in each color in both urns is known, people used an analytic process; in the more complex task that was not previously investigated, where the composition of the second urn depends on an additional uncertain event, people solved it heuristically. When people are confronted with uncertainty about the urn’s content, their judgment relies on the majority color instead of a probabilistic outcome. More specifically, this study demonstrates that these participants used a heuristic in which they assumed that the most likely event occurs, thereby greatly reducing the complexity of the task at hand.
7.2 Educational Implications
In probability, Urn problems serve as an instrument of translating realistic problems into mathematical ones; some objects of real interest (e.g., responses, people, characteristics, etc.) are represented as colored balls in an urn or another container. Usually, the goal in these problems is to determine the probability of drawing one color or another. Urn problems are continuously used in probability and statistics courses as didactic tools (Johnson and Kotz Citation1977; Batanero, Henry, and Parzysz Citation2005). Understanding school and college students’ reasoning in these kinds of problems, like the ACU task, is essential to building methods to overcome their intuitions, which may lead to incorrect responses.
Specifically, in the ACU task described in this paper, the students tended to rely on the most probable event and seemed to ignore all possible outcomes. To overcome this bias toward a deterministic thinking, we suggest a gradual method that would build better intuition for the students to help them approach similar problems in the future. As a first stage, we suggest that educators present the ACU task to students with emphasis on the counter-intuitive urn configurations (e.g., Type-B trials where ) that, when solving it heuristically, leads to incorrect judgment).
Once the students choose the erroneous answer, it will be effective to point out that this answer is incorrect and to promote a discussion to understand their reasoning. Counter-intuitive problems trigger students’ curiosity and raise their motivation to dive deeper into the analytical parts of the problem. One aspect of instruction is to elicit in learners an awareness of the possible conflict between their primary intuition and the analytical structures of probability (Fischbein and Schnarch Citation1997).
Next, it will be helpful to present an analogous problem with which the students are more familiar, such as the sugar solution task where teaspoons of sugar replace the black balls and cups of water replace the white balls (described in Section 3). This can illustrate the correct answer for the ACU task without the element of probability. The use of a physical analogy is enormously helpful in developing good statistical intuition (Martin Citation2003). Another interesting analogy is to ask students how the probability of drawing a black ball from Urn B will change after transferring the entire content of Urn A into Urn B—instead of transferring only one random ball as described in the ACU task. Both of these suggested analogies eliminate the additional uncertainty of which ball color is transferred. Yet, these analogies demonstrate that one should consider all possible outcomes (e.g., pouring some of a solution or pouring the entire content is similar to considering all the events at once) and may help students avoid wrong intuition, which is based on the most likely event. Using these analogies in the instruction can provide experiences for building an understanding of probabilistic reasoning and develop more normative intuitions that can reduce students’ limiting primary intuitions. It is essential for learners to develop an ability for recognizing when to ignore a primary intuition or, as Fischbein (Citation1987) described it, to create an “intuition for the non-intuitive” (p. 96).
As the last stage of the gradual method, we suggest solving analytically the ACU task and showing the analogic solutions (using the total probability formula) to the CP task (described in Section 3). Optionally, the educator may start with an analytic solution for a specific counter-intuitive Urn configuration and then generalize it. This follows the approach of Gigerenzer, Todd, and ABC Research Group (1999) that presents a simple solution to this complex problem instead of an expected complex solution.
This method can develop a conceptual understanding needed to construct a qualitative representation of the ACU task before using mathematical calculation. We believe that looking at this problem in several perspectives may enrich and deepen students’ understanding of probability and uncertainty.
Misconceptions of college students in probability do not always disappear after formal learning (Khazanov Citation2008). According to Vosniadou et al. (Citation2001), “Instructional interventions need to be designed to make students aware of their implicit representations, as well as of the beliefs and presuppositions that constrain them” (p. 392). Effective learning environments aiming specifically to eliminate students’ misconceptions are essential in this situation (e.g., Hirsch and O’Donnell Citation2001; Pratt Citation2005).
According to Heyvaert et al. (Citation2018), insights into the specific motivation for a learner’s choice among different alternatives could provide important knowledge for educational practice. In addition, a brain-imaging research study (Babai, Shalev, and Stavy Citation2015) showed that it is possible to improve students’ problem-solving abilities using effective instruction that includes explicit warning from intuitive solutions.
Future research could benefit from including qualitative and quantitative research approaches (mixed methods). Interviews with subjects where they explain their choice can help pinpoint students’ reasoning. Indeed, according to Clement (Citation2000), interviews enable researchers to collect and analyze data on mental processes at the level of a subject’s ideas and meanings and help to expose the processes in the subject’s thinking. Comparison of the subject’s answers with their grades in the probability course is another possible direction for future research. In addition, it would be interesting to examine the instructional effectiveness of the described gradual method, including each suggested stage. We hope that using these counter-intuitive tasks in class can be very useful tools to motivate and challenge students to think beyond superficial paradigms (Sowey Citation2001) and to explore statistical concepts at a deeper level.
References
- Ansari, D., Lyons, I. M., van Eimeren, L., and Xu, F. (2007), “Linking Visual Attention and Number Processing in the Brain: The Role of the Temporo-Parietal Junction in Small and Large Symbolic and Nonsymbolic Number Comparison,” Journal of Cognitive Neuroscience, 19, 1845–1853. DOI: 10.1162/jocn.2007.19.11.1845.
- Babai, R., Brecher, T., Stavy, R., and Tirosh, D. (2006), “Intuitive Interference in Probabilistic Reasoning,” International Journal of Science and Mathematics Education, 4, 627–639. DOI: 10.1007/s10763-006-9031-1.
- Babai, R., Shalev, E., and Stavy, R. (2015), “A Warning Intervention Improves Students’ Ability to Overcome Intuitive Interference,” ZDM, 47, 735–745. DOI: 10.1007/s11858-015-0670-y.
- Babai, R., Zilber, H., Stavy, R., and Tirosh, D. (2010), “The Effect of Intervention on Accuracy of Students’ Responses and Reaction Times to Geometry Problems,” International Journal of Science and Mathematics Education, 8, 185–201. DOI: 10.1007/s10763-009-9169-8.
- Banks, A. P., and Hope, C. (2014), “Heuristic and Analytic Processes in Reasoning: An Event-Related Potential Study of Belief Bias,” Psychophysiology, 51, 290–297. DOI: 10.1111/psyp.12169.
- Batanero, C., Henry, M., and Parzysz, B. (2005), “The Nature of Chance and Probability,” in Exploring Probability in School: Challenges for Teaching and Learning, ed. G. A. Jones, Dordrecht, The Netherlands: Kluwer, pp. 15–37.
- Batanero, C., and Sanchez, E. (2005), “What Is the Nature of High School Students’ Conception and Misconceptions About Probability?,” in Exploring Probability in School: Challenges for Teaching and Learning, ed. G. A. Jones, New York, NY: Springer, pp. 241–266.
- Ben-Zvi, D., Aridor, K., Makar, K., and Bakker, A. (2012), “Students’ Emergent Articulations of Uncertainty While Making Informal Statistical Inferences,” ZDM, 44, 913–925.
- Bonner, C., and Newell, B. R. (2010), “In Conflict With Ourselves? An Investigation of Heuristic and Analytic Processes in Decision Making,” Memory & Cognition, 38, 186–196.
- Chernoff, E. J. (2012), “Recognizing Revisitation of the Representativeness Heuristic: An Analysis of Answer Key Attributes,” ZDM, 44, 941–952, DOI: 10.1007/s11858-012-0435-9.
- Clement, J. (2000), “Analysis of Clinical Interviews: Foundations and Model Viability,” in Handbook of Research Methodologies for Science and Mathematics Education, eds. R. Lesh and A. Kelly, Hillsdale, NJ: Lawrence Erlbaum, pp. 341–385.
- DasGupta, A. (2010), “Urn Models in Physics and Genetics,” in Fundamentals of Probability: A First Course, ed. A. DasGupta, New York, NY: Springer, pp. 379–407.
- Daston, L. (1980), “Probabilistic Expectation and Rationality in Classical Probability Theory,” Historia Mathematica, 7, 234–260. DOI: 10.1016/0315-0860(80)90025-7.
- Denes, G., and Pizzamiglio, L. (1999), Handbook of Clinical and Experimental Neuropsychology, Hove, England: Psychology Press.
- English, L. D., and Watson, J. M. (2016), “Development of Probabilistic Understanding in Fourth Grade,” Journal for Research in Mathematics Education, 47, 27–61.
- Eshach, H., and Schwartz, J. (2002), “Understanding Children’s Comprehension of Visual Displays of Complex Information,” Journal of Science Education and Technology, 11, 333–346. DOI: 10.1023/A:1020690201324.
- Evans, J. S. B. T. (2006), “The Heuristic-Analytic Theory of Reasoning: Extension and Evaluation,” Psychonomic Bulletin & Review, 13, 378–395. DOI: 10.3758/BF03193858.
- Evans, J. S. B. T. (2010), “Intuition and Reasoning: A Dual-Process Perspective,” Psychological Inquiry, 21, 313–326.
- Evans, J. S. B. T., and Curtis-Holmes, J. (2005), “Rapid Responding Increases Belief Bias: Evidence for the Dual-Process Theory of Reasoning,” Thinking & Reasoning, 11, 382–389. DOI: 10.1080/13546780542000005.
- Falk, R., Yudilevich-Assouline, P., and Elstein, A. (2012), “Children’s Concept of Probability as Inferred From Their Binary Choices—Revisited,” Educational Studies in Mathematics, 81, 207–233. DOI: 10.1007/s10649-012-9402-1.
- Fischbein, E. (1987), Intuition in Science and Mathematics, Dordrecht, The Netherlands: Reidel.
- Fischbein, E., and Schnarch, D. (1997), “The Evolution With Age of Probabilistic Intuitively Based Misconceptions,” Journal for Research in Mathematics Education, 28, 96–105. DOI: 10.2307/749665.
- Gigerenzer, G., Todd, P., and ABC Research Group (1999), Simple Heuristics That Make Us Smart, New York. NY: Oxford University Press.
- Giuliano, M. G., Nemirovsky, I., Concari, S., Pérez, S., Alvarez, M., Sacerdoti, A., and Pereziano, M. (2006), “Conceptions About Probability and Accuracy in Argentine Students Who Start a Career in Engineering,” Paper Presented at the 7th International Conference on Teaching Statistics, Salvador, Bahia, Brazil.
- Hartzel, J., Agresti, A., and Caffo, B. (2001), “Multinomial Logit Random Effects Models,” Statistical Modelling, 1, 81–102. DOI: 10.1177/1471082X0100100201.
- Heyvaert, M., Deleye, M., Saenen, L., Van Dooren, W., and Onghena, P. (2018), “How Do High School Students Solve Probability Problems? A Mixed Methods Study on Probabilistic Reasoning,” International Journal of Research & Method in Education, 41, 184–206. DOI: 10.1080/1743727X.2017.1279138.
- Hirsch, L. S., and O’Donnell, A. M. (2001), “Representativeness in Statistical Reasoning: Identifying and Assessing Misconceptions,” Journal of Statistics Education, 9, 61–82. DOI: 10.1080/10691898.2001.11910655.
- Johnson, N. L., and Kotz, S. (1977), Urn Models and Their Application, New York, NY: Wiley.
- Jones, G., Langrall, C., and Mooney, E. (2007), “Research in Probability: Responding to Classroom Realities,” in The Second Handbook of Research on Mathematics, ed. F. Lester, Reston, VA: National Council of Teachers of Mathematics, pp. 909–956.
- Kahneman, D. (2000), “A Psychological Point of View: Violations of Rational Rules as a Diagnostic of Mental Processes,” Behavioral and Brain Sciences, 23, 681–683. DOI: 10.1017/S0140525X00403432.
- Kahneman, D. (2011), Thinking, Fast and Slow, New York, N: Farrar, Straus and Giroux.
- Kahneman, D., and Frederick, S. (2002), “Representativeness Revisited: Attribute Substitution in Intuitive Judgment,” in Heuristics and Biases: The Psychology of Intuitive Judgment, eds. T. Gilovich, D. Griffin, and D. Kahneman, New York, NY: Cambridge University Press, pp. 49–81.
- Kahneman, D., and Frederick, S. (2005), “A Model of Heuristic Judgment,” in The Cambridge Handbook of Thinking and Reasoning, eds. K. J. Holyoak and R. G. Morrison, New York, NY: Cambridge University Press, pp. 93–267.
- Kahneman, D., Slovic, P., and Tversky, A. (1982), Judgments Under Uncertainty: Heuristics and Biases, Cambridge, England: Cambridge University Press.
- Kahneman, D., and Tversky, A. (1973), “Availability: A Heuristic for Judging Frequency and Probability,” Cognitive Psychology, 5, 207–232. DOI: 10.1016/0010-0285(73)90033-9.
- Kapon, S., Ron, G., Hershkowitz, R., and Dreyfus, T. (2015), “Perceiving Permutations as Distinct Outcomes: The Accommodation of a Complex Knowledge System,” Educational Studies in Mathematics, 88, 43–64. DOI: 10.1007/s10649-014-9570-2.
- Khazanov, L. (2008), “Addressing Students’ Misconceptions About Probability During the First Years of College,” Mathematics and Computer Education, 42, 180–192.
- Klaczynski, P. A. (2001), “Analytic and Heuristic Processing Influences on Adolescent Reasoning and Decision-Making,” Child Development, 72, 844–861. DOI: 10.1111/1467-8624.00319.
- Konold, C. (1989), “Informal Conceptions of Probability,” Cognition and Instruction, 6, 59–98. DOI: 10.1207/s1532690xci0601_3.
- Konold, C., Pollatsek, A., Well, A., Lohmeier, J., and Lipson, L. (1993), “Inconsistencies in Students’ Reasoning About Probability,” Journal for Research in Mathematics Education, 24, 392–414. DOI: 10.2307/749150.
- Leron, U., and Hazzan, O. (2009), “Intuitive Vs Analytical Thinking: Four Perspectives,” Educational Studies in Mathematics, 71, 263–278. DOI: 10.1007/s10649-008-9175-8.
- Leth-Steensen, C., Elbaz, Z. K., and Douglas, V. I. (2000), “Mean Response Times, Variability and Skew in the Responding of ADHD Children: A Response Time Distributional Approach,” Acta Psychologica, 104, 167–190. DOI: 10.1016/S0001-6918(00)00019-6.
- Martin, M. A. (2003), “‘It’s Like … You Know’: The Use of Analogies and Heuristics in Teaching Introductory Statistical Methods,” Journal of Statistics Education, 11.
- Meder, B., and Gigerenzer, G. (2014), “Statistical Thinking: No One Left Behind,” in Probabilistic Thinking: Presenting Plural Perspectives, eds. E. J. Chernoff and B. Sriraman, Dordrecht, The Netherlands: Springer, pp. 127–148.
- Metin, B., Roeyers, H., Wiersema, J. R., van der Meere, J. J., Thompson, M., and Sonuga-Barke, E. (2013), “ADHD Performance Reflects Inefficient But Not Impulsive Information Processing: A Diffusion Model Analysis,” Neuropsychology, 27, 193–200. DOI: 10.1037/a0031533.
- Monson, R. (1980), Occupational Epidemiology, Boca Raton, FL: CRC Press.
- Oleckno, W. A. (2008), Epidemiology: Concepts and Methods, Long Grove, IL: Waveland Press.
- Peters, L., Bulthé, J., Daniels, N., de Beeck, H. O., and De Smedt, B. (2018), “Dyscalculia and Dyslexia: Different Behavioral, Yet Similar Brain Activity Profiles During Arithmetic,” NeuroImage: Clinical, 18, 663–674. DOI: 10.1016/j.nicl.2018.03.003.
- Pratt, D. (2005), “How Do Teachers Foster Understanding of Probability?,” in Exploring Probability in School: Challenges for Teaching and Learning, ed. G. A. Jones, New York, NY: Springer, pp. 171–190.
- Rubel, L. H. (2007), “Middle School and High School Students’ Probabilistic Reasoning on Coin Tasks,” Journal for Research in Mathematics Education, 38, 531–556.
- Sowey, E. R. (2001), “Striking Demonstrations in Teaching Statistics,” Journal of Statistics Education, 9. DOI: 10.1080/10691898.2001.11910647.
- Spieler, D. H. (2000), “Reaction Time,” in Encyclopedia of Psychology (Vol. 7), ed. A. E. Kazdin, Washington, DC: American Psychological Association, pp. 12–14.
- Stavy, R., Babai, R., and Kallai, A. (2016), “The Role of Congruity and Salience—Behavioral and Imaging Research,” Zeitschrift Für Psychologie, 224, 266–276. DOI: 10.1027/2151-2604/a000262.
- Stavy, R., Babai, R., Tsamir, D., Tirosh, D., Lin, F. L., and McRobbie, C. (2006), “Are Intuitive Rules Universal?,” International Journal of Science and Mathematics Education, 4, 417–436. DOI: 10.1007/s10763-005-9012-9.
- Stavy, R., and Tirosh, D. (1996), “Intuitive Rules in Science and Mathematics: The Case of ‘More of A-More of B,” International Journal of Science Education, 18, 653–667. DOI: 10.1080/0950069960180602.
- Stavy, R., and Tirosh, D. (2000), How Students (Mis-)Understand Science and Mathematics, Intuitive Rules, New York: Teachers College Press.
- Stupple, E. J. N., Ball, L. J., and Ellis, D. (2013), “Matching Bias in Syllogistic Reasoning: Evidence for a Dual-Process Account From Response Times and Confidence Ratings,” Thinking & Reasoning, 19, 54–77. DOI: 10.1080/13546783.2012.735622.
- Taubes, G. (1995), “Epidemiology Faces Its Limits,” Science, 269, 164–169. DOI: 10.1126/science.7618077.
- Tversky, A., and Kahneman, D. (1983), “Extensional Versus Intuitive Reasoning: The Conjunctive Fallacy in Probability Judgment,” Psychological Review, 90, 293–315. DOI: 10.1037/0033-295X.90.4.293.
- Vosniadou, S., Ioannides, C., Dimitrakopoulou, A., and Papademetriou, E. (2001), “Designing Learning Environments to Promote Conceptual Change in Science,” Learning and Instruction, 11, 381–419. DOI: 10.1016/S0959-4752(00)00038-4.
- Watson, J. M., and Kelly, B. A. (2009), “Development of Student Understanding of Outcomes Involving Two or More Dice,” International Journal of Science and Mathematics Education, 7, 25–54. DOI: 10.1007/s10763-007-9071-1.
- Wedell, D. H. (2011), “Probabilistic Reasoning in Prediction and Diagnosis: Effects of Problem Type, Response Mode, and Individual Differences,” Journal of Behavioral Decision Making, 24, 157–179. DOI: 10.1002/bdm.686.