
 ?Mathematical formulae have been encoded as MathML and are displayed in this HTML version using MathJax in order to improve their display. Uncheck the box to turn MathJax off. This feature requires Javascript. Click on a formula to zoom.
Abstract
In the first years of their economics degree programs, students will face many problems successfully dealing with a range of subjects with quantitative content. Specifically, in the field of statistics, difficulties to reach some basic academic achievements have been observed. Hence, a continuing challenge for statistics teachers is how to make this subject more appealing for students through the design and implementation of new teaching methodologies. The latter tend to follow two main approaches. On the one hand, it is useful for the learning process to propose practical activities that can connect theoretical concepts with real applications in the economic context. On the other hand, we should design multidisciplinary activities that link concepts from different subjects. With this goal in mind, in this article we propose a complete activity for first year students in business administration and economics degree programs, aimed to reinforce some basic statistical and economic concepts, while other basic transversal skills are also practiced, all within the subject of statistics.
1 Introduction
Traditionally, subjects with quantitative content have had little appeal for students enrolled in business administration and economics degrees. Comparing marks obtained by students in statistics with the results they obtained in other subjects, we often realized that statistics presents one of the highest failure rates for undergraduates. As a growing amount of literature in mathematics education indicates, students face many problems in mathematics and quantitative subjects especially during their first year in university (Cárcamo, Fortuny, and Fuentealba Citation2018; Feudel and Dietz Citation2019).
There are two main reasons for this. On the one hand, especially in the first year of an economics degree, there is heterogeneity in the students’ previous training during high school (Feudel and Dietz Citation2019). These different backgrounds and diverse prior knowledge make it difficult for some students to successfully address subjects with quantitative contents.
On the other hand, statistics has been traditionally taught from a theoretical point of view (Watts and Becker Citation2008), where the teacher used to focus on the calculation and sequence of procedures more than on encouraging students’ reasoning and interpreting results. However, especially in economics degree courses, showing the application of statistical analysis with real data is clearly a basic requirement to understand real economic processes and dynamics and to enable students to think as economists (Becker Citation2000). It is crucial to work on cases within a known context that stimulates a critical interpretation of results and procedures, which in turn allows students to acquire statistical literacy.
In addition, one of the basic academic achievements on statistics courses in economics degree programs is to make students feel comfortable in the rational process of posing questions, finding and analyzing the right data, and reaching conclusions (Wild et al. Citation2011). Different to mathematics, within the statistics learning process the role of context is indeed crucial to provide additional justification or support for a claim (Langrall et al. Citation2011).
Consequently, we actively search for new teaching methodologies that help to improve students’ academic achievements and decrease failure rates in exams.
In line with the approach of the Bologna process,1 that implied a rethinking of traditional teaching methods as well as a transition to a more student-centered teaching approach (Elias Citation2010), the application of new learning methodologies requires students’ active participation in the learning process. Learners should be encouraged to reach their own conclusions from the analysis of data and information. Therefore, we should apply teaching methodologies in the classroom that encourage students to learn by doing, taking as a starting point the theoretical concepts provided by the teacher or teaching strategies based on problem-solving (Becker and Watts Citation2001). Hence, activities inspired in inquiry-guided learning and practice-based learning, as the one that we propose in this article, are most advisable in modern academic training, aiming to connect theoretical knowledge with the real world (Lee et al. Citation2004).
A good precedent of this way of teaching statistics that inspired the activity presented in this article is the Erasmus + ProCivicStat project. On its website, this project provides useful materials for teaching statistics based on the idea of creating a somehow statistical literacy that allows students interpret economic phenomenon and problems grounded in the evidence of well-interpreted data (ProCivicStat 2019). Specifically, following the core of the project, Ridgway et al. (Citation2018) proposed some basic facets of statistical literacy that should be dealt with in the classroom to train students’ ability to engage with data related with social issues. This approach was integrated in the design of our activity.
Within this context, in this article we propose an activity structured in seven steps aimed at achieving a double goal. First, the activity allows us to teach some basic statistical and economic concepts from the approach of its application in a real economic context. Second, the activity was designed to promote the acquisition of basic transversal skills such as dealing with real data and managing and analyzing it with statistics software to correctly interpret the available information (Becker and Watts Citation2001). With basic transversal skills, we refer to those skills that favor the development of statistical thinking. For instance, the ability to critically think about statistical and economic issues, to be capable of understanding statistically based results reported in the media, recognize the analysis conducted, and recognize the need for data in daily life decisions. Nowadays developing statistically literate and critical thinking about procedures and analysis conducted to obtain results is a key skill both for becoming a competent professional and a responsible citizen.
The core of this activity is based on two key points from the Guidelines for Undergraduate Programs in Statistical Science by the American Statistical Association. Such key points are “increased importance of data science” and “real applications” (ASA Citation2014). Specifically, with “increased importance of data science,” ASA wants to highlight the importance of computing skills for students. Real data analysis requires students to become familiar with professional statistical analysis software, to learn how to access and manipulate data in various ways aimed at real problem solving.
The key point of “real applications” is to focus on the importance of achieving competencies in analyzing and interpreting complex real data rather than merely working with textbook data. It is widely held that working with case studies that contain rich background information really helps students embrace and develop the theoretical material, especially in the field of statistics in economics degree programs (Nolan and Speed Citation1999).
Within this context, we designed an activity inspired in the context knowledge approach proposed by Langrall et al. (Citation2011), for students to face a real-world problem and then select, analyze, and interpret all relevant data. The goal of the article is to provide practical material to be implemented within the classroom to contribute to creating habits of mind as well as encouraging a willingness to engage with real data.
The article is structured as follow. In Section 2, we present the theoretical background of the activity where the theoretical concepts involved in the activity were defined. In Section 3, we detail the methods used to design the activity as well the activity itself. Section 4 is devoted to the activity assessment from the students’ point of view. Results are presented in Section 5. Finally, Section 6 provides some conclusions and discussion.
2 Theoretical Background
One of the general academic aims for graduate students in degrees in business administration and economics is to be capable of connecting concepts and factors involved in economics processes. Therefore, already during their university years, connecting knowledge from different subjects is a useful exercise to enrich their capacity to solve problems and easily understand the applicability and interrelation of the theoretical contents. In fact, cognitive load theory (CLT) findings recommend that students should not be overloaded with new concepts. Nevertheless, activities involving concepts already being studied coupled with new ones, help to maximize learning and reinforce long-term learning.
Interdisciplinary teaching, through activities based on genuine problems from the real world, enhances motivation and interest in the learning process (Brante and Brunosson Citation2014). As a result, the activity proposed in this article combines concepts from basic statistics and economics. The purpose of the activity is to create a learning environment where students can develop a deep and meaningful understanding of statistics, and therefore be encouraged to foster more analytical reasoning and critical thinking (Garfield et al. Citation2008).
On the statistics side, the activity underlines the difference between population and sample, the importance of the sampling methodology and the applicability of the raising factor. On the economics side, the activity is based on analyzed variables from the labor market; consequently, some basic concepts already learnt within the economics introduction subject should be reviewed.
At the end of the activity, students should be capable of establishing clear links between those concepts and new ones as well as applying logical reasoning strategies regarding the real context problem proposed by the teacher. The theoretical concepts reviewed and introduced in this activity are detailed below.
2.1 Statistics Concepts
2.1.1 Types of Sampling
One of the basic and introductory points of the statistics subject is the distinction between sample and population and the importance of good and representative sampling for any inferential analysis. Hence, before running the activity, the following sampling methodologies were introduced (Barnett Citation2002):
Simple random sampling: A simple random sample (SRS) of size n is produced by a scheme that ensures that each subgroup of the population of size n has an equal probability of being chosen as the sample.
Stratified random sampling: Divide the population into homogenous strata in terms of the variable that we want to study, in other words, we cluster the populations in homogeneous groups regarding a specific characteristic. There may be any number of these. Then choose a SRS from each stratum. Combine these into the overall sample. This then constitutes a stratified random sample
Multi-stage sampling: Sometimes the population is too large and scattered for it to be practical to make a list of the entire population from which to draw a SRS. At each stage, they might create a stratified random sample based on sex, race, income level, or any other useful variable which they could get information about before sampling.
In addition, as it is known, to check the reliability of the sample to provide a proper estimate, it is useful to calculate the raising factor. As a result, we also introduced this concept in class.
2.1.2 Raising Factor
Once a representative sample is selected, the next step is to apply the raising factor. This concept is rarely taught in statistics on undergraduate or postgraduate programs. Indeed, many researchers in the economics field fail to provide a clear definition and are unaware of its practical applications.
The raising factor is the reweighting technical improvement of the survey to properly reflect the weight that each sample group has in the population.
Specifically, the International Statistical Institute (Citation1990) provides the following definition:
The coefficients of a linear function of the values of the sample units used to estimate population, stratum, or higher stage unit totals are called raising, multiplying, weighting or inflation factors of the corresponding sample units. If the raising factors of all the sample units are equal, the common raising factor is called the raising factor of the sample, and the sample itself is called self-weighting.
Expression (1) shows the raising factor equation.(1)
(1) where N refers to population size and n to sample size.
Therefore, the raising factor represents the number of elements existing in the population for each element of the sample.
For instance, the Spanish Statistical Office Instituto Nacional de Estadística (INE) applies the raising factor for its estimation in the Economically Active Population Survey (EPAS). People, who participate in the survey, represent the whole population. Then a “raising factor” is assigned to each surveyed person, and it indicates the number of people from the population that it represents.
To calculate the raising factor, INE divides the population into generally homogenous population groups called “strata” in each region. For any of these strata, the estimation of an EPAS characteristic (e.g., number of employed people) is calculated as expression (2) (INE Citation2002) shows:(2)
(2)
Therefore, if the total population provided by the INE forecast increases, figures for all EPAS forecasts also increase, as do the number of employed, unemployed, or active people among others.
In addition, the raising factor can be used for subsequent improvements of the sample through a reweighted sample by specific characteristics.
For instance, coming back again to the EPAS case, EPAS is a survey performed in households. However, it is common to encounter difficulties when surveying some specific households, in particular those households composed of one-person homes or where both partners are working will make it more difficult to find occupants at home. Even if some measures are taken to correct this problem, the survey tends to be over-represented by the older population, where occupants are easier to contact and thus be included in the survey.
To better reflect the representativeness of age groups in the sample, INE introduced the methodological improvement called raising factors reweighted.
By applying the raising factor reweighted, results supplied in the survey by gender and age group in each region coincide with real population figures.
Specifically, within this activity students must compare the results in newly published newspapers (Clemente and Gutiérrez Citation2017) with the results they obtain by analyzing the data from the official source (EPAS). When students compare the two results, they find that they do not match. The reason is that the raising factor must be applied to the data downloaded from the EPA, to obtain the final result show in the news. The professor then explains that it is necessary to apply the raising factor, so that the sample data (the data offered by the EPAS are sample data since they come from a survey, not from the total population) represent the whole population. If students analyze the data without weighting them by the raising factor, all the figures they obtain regarding the unemployment rate, activity rate, and so on, will correspond only to the sample that has answered the survey (EPAS) and will not refer to the entire population.
After understanding and applying the concept of raising factor, students check that the results provided by the media are indeed correct.
The role of raising factor in this activity then, is to provide a good example for students to get closer to a real data analysis and to provide an environment favorable to a statistical reasoning learning.
Even if official statistics produce the major source of evidence about social issues, they usually receive little attention in traditional statistics courses, and important aspects such as survey design (and associated problems such as nonresponse or respondent bias), measurement issues (reliability and validity), techniques such as moving averages, seasonal adjustment, and case weighting, are not frequently addressed in regular statistics classes (ProCivicStat Project 2019).
2.2 Labor Market Concepts
As mentioned before, in this activity we combined concepts from statistics with those of other fields related to the field of economics. Specifically, in this activity we work within the labor market field. Therefore, to clarify some basic concepts, before we ran the activity the following concepts already known by students were reviewed:
EPAS: Economically Active Population Survey
INE: Spanish Statistical Office
Employed: These are people aged 16 or over who during the reference week have been working for at least one hour in exchange for remuneration in cash or in kind, or those who work but have been temporarily absent through illness, holidays, etc.
Unemployed: These are people aged 16 and over, who during the reference week have been without work, available to work and actively seeking work.
Active persons: People aged 16 and over who, during the reference week (previous to that in which the interview is carried out), supply labor for the production of goods and services or are available and in conditions to be incorporated into said production. They are subdivided into employed and unemployed.
Inactive population: Population of 16 or over who are not included in any of the previous categories.
Unemployment rate: Unemployment rate is the percentage of the labor force that is unemployed, where the labor force consists of the unemployed plus those in paid- or self-employment (OECD Data Citation2020).
3 Methods
In this article, we propose an activity addressed to first-year students enrolled in statistics courses as part of their degree programs in economics. Our activity combines the application of real data and statistical techniques with some economic concepts, to develop students’ skills in analyzing and interpreting information in a real context. Specifically, our activity aims to interpret the situation of the labor market in different Spanish provinces and regions through an analytical interpretation of the results. The idea is to propose an activity in which students can acquire new concepts and at the same time to train some basic statistical literacy skills.
The activity that we propose here is included in the subject of inferential statistics as a part of the continuous assessment component, aimed at linking theoretical knowledge with the interpretation of real data.
At the University of Valencia, students enrolled in degree courses from the School of Economics should take two compulsory statistics subjects (courses). Basic statistics and inference statistics should be taken in the first and second years, respectively.
The Bologna process set some guidelines for subject evaluation; these included sharing the assessment between a final exam and a continuous assessment module, carried out both in the classroom and from each student’s individual course work. In the case of statistics, 30% of the final score depends on continuous assessment. This activity was designed as a part of that continuous assessment component.
To implement this activity in the classroom, students should have taken the subject “basic statistics,” in which they learnt the fundamentals about sampling issues. Specifically, at this point of the degree students should be familiar with samples, population and different types of sampling. In addition, within the subject “basic statistics” students already started to use R software in their practical classes, which is essential for this activity.
At this point of the degree, students also have taken the subject “Introduction to Economics;” therefore, they should be familiar with the economic concepts outlined in the activity.
3.1 R Software
Nowadays, “real applications” are inevitably linked with the management of large data bases. Therefore, students should be trained in the analysis and management of larger data bases than the ones commonly used in text books to learn how to use data effectively in a work context.
Consequently, working with large data bases implies fluent competencies in the use of suitable software. As a result, we introduce our students to the use of R software as a tool to analyze real data bases. The main reason we choose R is because it is free software. Thus, students can download the software on their own personal computers, and the expertise that they achieve during the academic period can later be used in any other context. By using free software, we avoid any entrance barrier in providing students with a useful and work-related qualification. As outlined by Ben-Zvi and Garfield (Citation2004) on the one hand, using technologies for learning statistics reduces the gap between learning statistics and using statistics methods professionally. On the other hand, using technology helps to make statistics visual, interactive, and dynamic and helps to focus on concepts rather than computation (Cobb and McClain Citation2004). Within this context, the role of R in this activity is to provide an easier and faster path toward statistical reasoning (Biehler et al. Citation2013).
During the last five years, the Department of Applied Economics (quantitative methods area) of the University of Valencia has been trying to progressively introduce R software in their teaching. We firmly think that a university graduate should be familiar with the use of software to manage data. Then, computer skills should be trained from a student’s first year at university to the finish of their degree with a complete skill-set suitable for current labor market demands.
When we use this hands-on approach for teaching statistics, the subject becomes more engaging for students and helps them to focus on concepts rather than computation. In addition, introducing R software for teaching statistics allows students to develop an understanding of abstract concepts and it offers students the opportunity to experiment with data (Garfield et al. Citation2008).
3.2 The Activity
We agree with the literature (Cobb et al. Citation2003; Warburton Citation2003; Langrall et al. Citation2011) that the best way to internalize new concepts is through the analysis and reflection of real cases.
In this line, the CLT provides us with the theoretical framework to design our activity-based learning. This theory explores how human brains learn most effectively to propose teaching approaches that better fit with human cognitive architecture and therefore maximize long term learning (Kirschner, Sweller, and Clark Citation2006). According to this theory, students should be encouraged to construct their own ideas and to engage in activities that allow them to connect knowledge and understand its context of application (Tarmizi and Bayat Citation2012). This whole learning process requires the teacher to provide some explicit guidance accompanied by practice and feedback to be more effective. Evidence from empirical studies suggests that practice-based learning (PBL) activities are more effective and efficient when accompanied by clear instruction and guidance by the teacher (Kirschner, Sweller, and Clark Citation2006).
According to the literature, the CLT approach is especially suitable for dealing with the challenges of teaching quantitative skills to novice undergraduate students, as for instance, to introduce programming software or facing data-heavy methods (Guzman et al. Citation2019).
In the case of statistics, it is fundamental to work with real data to fully understand the applicability of the subject. Teaching primarily from the textbook makes it more difficult for students to understand the interrelation of concepts, and as a result they tend to merely focus on a sequential set of tools and procedures. We try to avoid students learning statistics as a mechanical procedure exempt of reasoning but instead we aim to encourage their training in statistical literacy skills. Therefore, for designing this activity, we adopt the main principles for creating a “Statistical Reasoning Learning Environment” (SRLE) proposed by Garfield et al. (Citation2008).
Specifically, we designed an activity with seven steps based on the core of the following five principles:
Focuses on developing central statistical ideas rather than on presenting a set of tools and procedures. (Preliminary step)
Uses real datasets to engage students in making conjectures. (Learning goal 1)
Integrates the use of appropriate technological tools that allow students to test their conjectures and develop their statistical reasoning. (Learning goal 2)
Uses activities to support the development of students’ reasoning. (Learning goal 3 and 5)
Focuses on developing central statistical ideas rather than on presenting a set of tools and procedures. (Learning goal 4)
Following the theoretical framework provided by the CLT, we identify such specific skills and knowledge we want students to learn. Then we expose the relations and links with the concepts already acquired by students in other subjects to avoid any overload of new information, and finally, through the teacher’s guided instructions, students practice and further acquire reasoning skills from the analysis of a real context problem (Lovett and Greenhouse Citation2000). All steps of our activity follow the above mentioned CLT methodology to maximize long term learning. In addition, the design of these steps is based on principles for creating a “Statistical Reasoning Learning Environment” within the classroom, which is the goal of this activity.
To summarize our activity-design process, shows the relationship between the learning goals we want to achieve and the principles for creating a “Statistical Reasoning Learning Environment” on which they are based. In addition, we point out for every step of the activity how each learning goal is worked on.
Table 1 Activity design.
This activity encourages students to properly analyze and interpret unemployment rates. Even if the activity is implemented during a statistics class, a brief review of some concepts introduced in the economics subject is necessary. For instance, we provided students with a glossary of terms with some important definitions within the labor market field such as work force, manpower supply, survey on active population, economic activity rate, and labor force participation rate.
The activity consists of asking students to check a set of employment figures provided by the media by analyzing the real data from the official source and applying their statistics knowledge. Therefore, the activity proposed combines two elements that should be essential in the daily work of a professional in the economics field, and that is, to both understand clearly and reason logically when faced with facts from the media as well as from official sources.
The whole activity takes place in a collaborative environment where students help each other, and the teacher interacts with them to guide them in the process of knowledge creation. The teacher presents the activity and corrects students’ errors in real time. In addition, throughout the task students must combine new knowledge along with their existing knowledge, as the CLT recommends (Lovett and Greenhouse Citation2000).
The whole activity is divided into seven steps within the classroom and a final phase outside the classroom, in which students have to carry out some assignments to consolidate knowledge and practice skills outlined in the activity.
Step 1: The teacher provides the students with some news from the economics section of the newspaper. Specifically, we chose a news item entitled “In which province is there more unemployment? Keys to the labor market 2016” (El Pais 2016)2.
After students have read the article, the teacher highlights the most important aspects of the news, regarding both the methodological and the informative content.
Regarding methodological aspects, the teacher explains basic economic concepts to carry out this practical activity. These are concepts that students should already know, and they have to refresh them to successfully complete the activity.
With regard to the informative content, certain aspects were highlighted to make students reflect on the real meaning of that information. For instance, the teacher underlined the fact that in Spain there are 413,600 more employed people and 541,700 unemployed in 2016, and the unemployed rate was 18.63% for that year. From this input, the teacher guides students in their reasoning process about the meaning and calculation procedures of these figures. In this preliminary step, we already introduce students into the state of mind of statistical literacy. In accord with the facets of statistical literacy identified by Ridgway et al. (Citation2018), we focus on developing central statistical ideas, rather than on presenting a set of tools and procedures, by associating statistics with everyday life. This creates a positive disposition of students toward working with real data and at the same time it encourages them to apply appropriate reasoning processes while addressing statistics problems. In other words, the activity aims to encourage students’ willingness to engage further in evidence-based arguments.
Then, this preliminary step is a necessary warming up to achieve the expected learning goals. Within this first step we already apply recommendations of the CLT, namely to combine previous knowledge with new concepts in a real context problem, and guide students in a reasoning learning process.
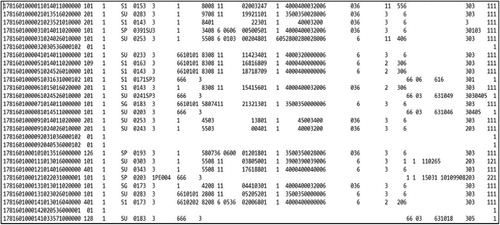
Step 2: To check the information provided by the news item, guided by the teacher, students may look up data on the INE webpage. Specifically, the file with micro-data for the fourth term of 2016 was downloaded.3 The downloaded data are in ASCII format file (EPAWEBT0416). shows its content, where each row is a survey respondent.
Fig. 1 A data section. This figure just shows a piece of data as an example of the data base structure. We did not include the whole data base for a more reader-friendly approach.
It is also necessary to download an Excel file with the register design and valid values (disereg_epa0516.xls). This file contains information for identifying each variable, its possible values, and its position. During the entire activity, the teacher interacts with students providing them with feedback in real time and clarifying any issues that may be more complicated. In this case, the teacher guides students when downloading data and dealing with any format related issues. In this step we also try to cover one of the basic facets of statistics literacy, and that is to base the activity on official statistics. Official statistics producers are a major source of evidence regarding social issues. However, many of the core ideas they use receive little attention in traditional statistics courses. Knowing how to manage official data bases such as this is basic to acquiring statistical literacy. In addition, it is useful to stimulate the positive disposition students have toward real context problems, such as the fact-check activity we propose in this article.
Learning goal 1: Students become familiar with an official data base and realize that even if data are available, key skills are required to manage the data and extract and understand the available information.
Step 3: Having downloaded the relevant data, the teacher sets an easy question: What is the unemployment rate in Spain in 2016? Is it really 18.63% as the news item pointed out?
At this point, students realize that even if they have all the data they do not know how to manage it to answer such an easy question. At this point, the teacher takes part again providing new input that can help students to find the answer. In addition, students collaborate among themselves to solve the problem outlined above. Once the teacher has guided students on the official data base managing, she tries to engage them by proposing a fact-check activity encouraging them to make logical conjectures. Within this step we follow one of the pedagogical methods provided by the CLT, which is the completion effect, in which we required students to complete partially solved problems for understanding data from realistic contexts. Thus, this brings us to the first learning result.
Learning goal 1: Students become familiar with an official data base and realize that even if data are available, skills to manage that data are required to extract and understand the information.
Step 4: Therefore, the next logical step is to extract the micro-data file to select the relevant variables, which allows us to calculate the number of employees, unemployed people, the unemployment rate, and all the necessary information to verify the validity of the information provided in the media and to answer the questions set by the teacher.
To extract and manage data, we propose the use of R Studio software. Students have a template with an R incomplete script. Throughout the activity the teacher provides the necessary commands to complete the R script and obtain results. In addition, the teacher explains the meaning of the commands, so that students can use them for solving similar problems just modifying some aspects. The goal of this step of the activity is for students to become familiar using basic functions of the R software, such as importing data or completing scripts under the teacher’s guidance.
Once again, following the guidelines of the CLT, we use the pedagogical method of the completion effect, in which we required students to complete partially solved problems or questions. In this case, students should complete the R commands after a short explanation by the teacher. We aim to make students familiar with R use in a friendly way, using it as a tool to help them in their reasoning learning process, reducing the need to compute and at the same time allowing for easy management of real data.
Therefore, the teacher guides students in the following sequence:
To extract data from the compressed files and read the content of the micro-data file (EPAWEBT0416).
To open the file that contains the register design and comment on its structure (see ).
To identify the key variables for solving this activity. Specifically, we extract CCAA (Region), age, gender (1: male, 6: female), AOI,4 and the raising factor.
The variable AOI registers the working situation for each respondent and it can take the following values:
03 Employees on low hour contracts
04 Other employees
05 Unemployed people searching for their first job
06 Unemployed people who have worked before
07 Inactive 1 (the disheartened)
08 Inactive 2 (together with the disheartened make up those not actively seeking employment)
09 Inactive 3 (for other reasons)
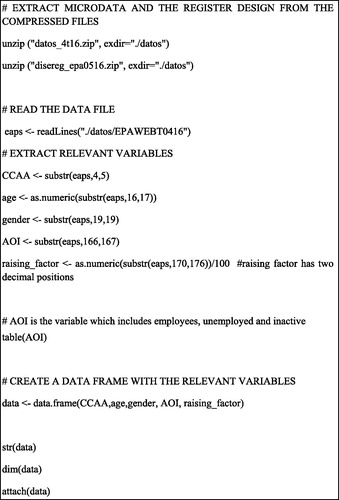
To create a new data frame with the selected variables. shows the R script to create the data frame
Fig. 2 R script to create data frame.
The advantage of using R (or any programmable software) is that learners and teachers can adapt these tools to the specific needs of the activity or the research project. In addition, attention to key statistical concepts seems to be easier if the cognitive load required for computation is allocated to the R software (Biehler et al. Citation2013).
The use of R lightens the burden of computing and helps to weave an understanding of context. The teacher acts in the same way as a tailor who composes the students’ skills and knowledge and allows them to reason, taking real statistical problems as a starting point.
By providing R commands we avoid overloading cognitive requirements, and students can focus on discerning the necessary variables to compose their data base. In addition, by introducing the use of R in successive activities, students become progressively familiar with the tool and discern the changes they have to make to obtain the desired information.
We believe that this way of introducing the use of R in the classroom helps students to become gradually exposed to new data formats and new tools for analysis to achieve learning goal 2.
Learning goal 2: Students learn to extract the required information from an official database and compose their own data frame with the required variables. They also become exposed to the use of R software.
Step 5: When students have their own data frame with the required variables, students can then calculate the number of employees, unemployed, and inactive population. Before starting any calculation, the teacher reviews the following key concepts and definitions from EPAS that were presented in Section 2.2.
Once the theoretical concepts have been explained and the data are available (Step 4), it seems that students can answer the following question proposed by the teacher: According to the definition of EPAS, what is the population of Spain?
The answer to this question is not immediate. At this point of the activity we observe that a large number of the students struggle to link the different concepts just studied. These concepts seem to be clear when they are approached separately but some questions arise when they need to be connected. Therefore, the professor should remind the students of the meaning of the raising factor, and illustrate it with a concrete example from EAPS data. It is necessary to point to the fact that the raising factor for each individual is equivalent to the number of individuals of the total population that they represent.
After this clarification, the teacher then asks the following questions: How many employees, unemployed, active and inactive people are there in the EPAS? And in Spain?
Here the students’ responses are usually satisfactory. The concept of the raising factor and how to apply it has been assimilated. To answer these questions, students have to run line by line, with the teacher, the script shown in . As in the previous step, the teacher explains the meaning of each command so that students are able to make small changes on their own and answer similar questions. Again, we apply the pedagogical methods from the completion effect proposed by the CLT.
Fig. 3 R Script. Mean calculation.
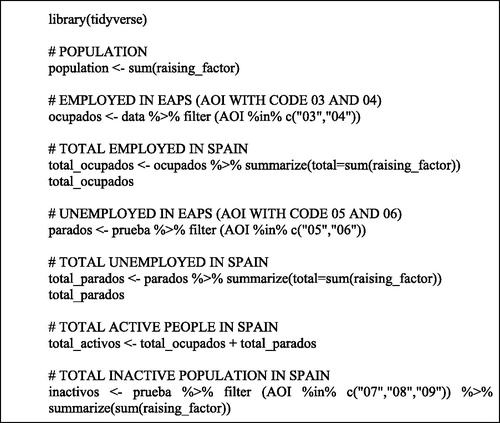
Therefore, following the guide provided by the teacher, students were able to complete the R commands to obtain the following findings:
In the fourth term of 2016 the number of workers in Spain was 18,508,095 and the number of unemployed people was 4,237,799. Therefore, the total number of active people (employees plus unemployed) in Spain for that term was 22,745,894.
Consequently, the unemployment rate (unemployed divided by active people) in the fourth term of 2016 was 18.63%. This finding is in line with the information displayed in the news item.
Quantitative skills underpin all aspects of statistical literacy, and some of the basic components include number sense, ratio, percentages, rates, and fractions. Within this step students work on this statistical literacy facet to develop a sense of numbers. This is the starting point to practice critical evaluation and reflection as a habit of mind that requires a conscious effort (Ridgway et al. Citation2018). We try to get students to go beyond answering a series of routine questions out of context and instead to relate concepts to solve problems critically. Within this step, students are encouraged to achieve learning goal 3.
Learning goal 3: Students match the theoretical concepts with their own data analysis to obtain their own conclusions.
Step 6: Once students have obtained their own results, the teacher asks them to share their conclusions. Then a discussion about the analysis conducted by students and the importance of interpreting these results based on critical reasoning is explored. This step is basic for students to practice their reasoning and critical thinking. In addition, at this point of the activity it becomes evident that solving real problems is not a mere sequence of calculations as was previously taught in more traditional textbooks.
Within this step, we encourage students to practice a habit of mind that involves a willingness to engage with data and the ability to reason with numerical evidence. In this way, we focus on developing central statistically ideas instead of teaching mere techniques or procedures without context. Thus, we encourage students to practice their statistical literacy.
Learning goal 4: Solving real cases implies a deep understanding of matter and the ability to relate concepts to obtain conclusions.
Step 7: Finally, the teacher sets out some additional questions as homework, to promote reflection on the topic and provide autonomous work.
Specifically, the teacher uses the information displayed in the media as a guide for formulating the following questions: What is the unemployment rate by gender? What is the unemployment rate by age? Which regions have a higher unemployment rate?
Following the explanations regarding R commands by the teacher in the classroom, at this step of the activity students should be able to make the proper changes to obtain their answers.
The assignments are addressed to reinforce the acquisition of new knowledge and train new skills within the classroom. At the same time, these tasks allow the teacher to test the ability of students to apply the statistical concepts in R and conclude their own reasoning learning process.
Learning goal 5: Students reflect on the topic addressed in the activity and are provided with some useful autonomous work.
This activity was designed following a clear structure. First, the teacher introduces and clarifies the theoretical concepts. Second, students work at the computer in an individual activity and finally the teacher and learners discuss the students’ analyses (Cobb et al. Citation2003). This structure helps to create a statistical reasoning environment and is addressed to maximize learning following the CLT approach. Specifically, the guidance and the real time feed-back provided by the teacher, plus the collaborative atmosphere in the classroom, had a positive impact on the learning process because all students could follow and complete the activity. In this way, students are gradually introduced in an instructional sequence that allows then to further develop their reasoning skills. In addition, the real-world problem helps to emphasize the connection between knowledge and the contexts of its application. In this line, this activity connects one concept to another step by step, and as a result students can explain the statistical processes and interpret their statistical results. The whole activity was designed following a series of steps guided by the teacher with the goal of decreasing extraneous cognitive load. In line with the CLT, the design of the activity tries to take advantage of three pedagogical methods. Specifically, we use the worked-example effect, proposing a real context problem. The completion effect was specially applied to facilitate the R management, and finally, the split-attention effect allows us to integrate teaching of multiple concepts to improve learning (Van Merrienboer and Sweller Citation2005).
The achievement of the learning goals was not directly assessed. However, having corrected students’ assignments, the teacher was able to realize to what extent students had acquired the concepts and skills proposed by the activity. Therefore, the last step of the activity played the role both of reinforcing the acquisition of concepts and skills and acting as a proxy of the learning goal achievement.
We followed the literature in the field and designed an activity aimed to engage students in a process of acquiring a more analytical state of mind that allows them to actively reason when dealing with statistics problems. We believe that the students’ perception and opinion about the activity was a useful assessment to carry out future improvements.
4 Activity Assessment
During the whole activity we embrace a student-centered approach to learning statistics, therefore we want to stay in this line for the assessment of the activity. Even if traditionally it is the teacher who assesses the results of a new activity, we believe that students’ opinions or perceptions about the learning process provide useful feedback, which can further help to implement improvements in the new activity. With this goal in mind, at the end of term students answer a questionnaire about their preferences or experiences with different teaching approaches and about this specific activity. The questionnaire was filled in by 79 students.
We report below the most relevant answers. First, we were interested in knowing which approach students prefer when studying statistics, then students answered the following question: What do you find most useful to help improve your knowledge of statistics? Rate from 1 to 7 the following options, 1 being nothing useful and 7 very useful.
ranks the different teaching approaches from highest to lowest students rating.
Table 2 Students’ favorite teaching approaches.
As shown in , the second most highly ranked approach is “Practical lessons, solving real cases with real data.” According to this assessment, students seems to appreciate a more active-learning approach based on real cases to help better understand statistics concepts. However, completing regular exercises on the blackboard and attending theoretical lessons were considered to be the first and third most highly ranked methodologies. This we consider to be an indicator that students are not yet familiar with a more practical approach within the quantitative subjects.
Focusing on our activity, we asked students to which extent they had used programmable software or read news items related to economics. shows students’ responses:
Table 3 Use of R and economics in the media.
As indicated by students’ responses, this activity introduces some important novelties regarding these students’ learning processes. With this activity, students start to make contact with the R software as well as become exposed to media coverage with economics related news items. These two elements used to be missing in previous teaching approaches based solely on the textbook.
Additionally, we asked students about their perception concerning the skills developed through this activity. The specific question was: Rate from 1 to 7, to what extent the activity you have just done has been useful for the following aspects, 1 being nothing useful and 7 very useful.
Students had to score ten statements. Results are shown in .
Table 4 Skills developed during the activity.
We asked students to score the above-mentioned skills to assess their subjective achievement of the learning goals defined in the design of the activity. The better ranked ones were skills 1 and 2 which correspond to learning goals 1 and 3, respectively. Thus, according to students’ perceptions the learning goals best achieved with this activity were “Students become familiar with an official data base and realize that even if data are available, skills to manage that data are required to extract and understand the information” and “Students match the theoretical concepts with their own data analysis in order to obtain their own conclusions.”
Answers from give us clues about what aspects of the activity we need to reinforce in further implementations to better achieve the five learning goals proposed. The answers provided by students, seems to be in line with learning goal 4 (skill 3) and learning goal 5 (skill 4).
We also ask students to provide a general assessment of the activity through the question: In general terms, did you find this activity useful to increase your knowledge and skills? Rate from 1 to 7, 1 being nothing useful and 7 very useful.
Students rated the activity 4.9 out of 7, with a standard deviation of 1.4.
Finally, to find out if the students consider it useful to do more activities of this type, we ask them: Would you have liked to do more activities of this kind throughout the semester? shows students’ opinion about the appropriateness of the activity.
Fig. 4 Students’ opinion about the activity.
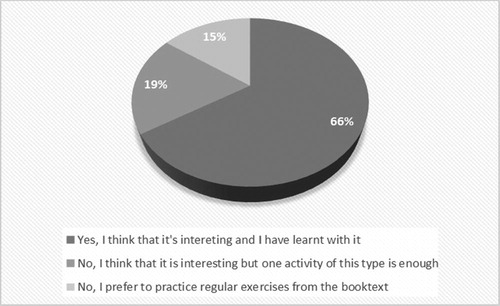
More than half of the students declare to have learnt with this activity and they would like to complete more activities like this during the term.
In general terms, answers provided by students shows a positive acceptance of the activity by the students. In addition, they perceived an improvement on their statistical knowledge and transversal skills as a result of this activity.
Results from the post-activity survey shown above do not measure the activity’s effectiveness in terms of cognitive gains, but allow us to consider the students’ point of view as a reference for improving the learning process.
However, before the deadline set by the teacher, students should hand in a report with contents and procedures of the whole activity (both questions and procedures solved in class and questions answered as homework). The teacher should integrate the results obtained in this activity as part of the continuous assessment and, therefore, as part of the final grade for this subject. Furthermore, the correction of the activity could give the teacher a rough idea about the achievement of the learning goals pursued by the activity.
5 Results
The complete design of this activity based on SRLE principles is addressed to reach learning results defined in Section 3. We introduce some basic elements for the training of an economist and the acquisition of statistical literacy.
First, students become familiar with an official data base and realize that even if data are available, skills to manage that data are required to extract and understand the given information.
Second, students learn how to extract the required information from an official database and compose their own data frame with the required variables. They also are exposed to R software to manage large data bases.
Third, students match theoretical concepts with their own data analysis to obtain their own conclusions. They also link knowledge from different subject areas and realize that the problems outlined come from the real world.
And finally, students reflect on the topic addressed in the activity and are provided with useful autonomous work. From the guidelines provided by the teacher, they have adequate time to answer the homework questions to autonomously reflect on the topic worked on in class.
Additionally, derived from students’ responses, we observed that these types of activities are in line with their preferences, since our activity, “Practical lessons solving real cases with real data,” was in fact the second most highly ranked teaching approach for that year.
We also observe that students are not used to working with R software nor with reading news stories related to economics, a clear indication that such techniques are not followed in other subjects. However, students positively assess this activity, remarking the fact that they were able to develop some basic skills, often forgotten by traditional teaching styles based on the textbook.
6 Discussion and Conclusion
In this article, we propose a complete activity as part of the continuous assessment component on their inference statistics course as part of their Economics degree at the Faculty of Economics, University of Valencia, Spain.
This activity tries to reinforce some essential skills for a university student, as in the autonomous work they develop their computing skills and their ability to deal with real problems, while at the same time they are not introduced to key statistical and economical concepts.
Thus, we intended to create a reasoning learning environment within the classroom to train students in statistical literacy by making statistical concepts and techniques more relevant for them.
Specially in the “post-truth” and “alternative facts” era, decision-making based on a reasoning interpretation of official data is crucial both in a work and civic context. As can be seen in the activity proposed in this article, even resorting to official data requires a deep understanding of the procedures and interpretation of the information (ProCivicStat 2019).
We integrate concepts from different subject areas, taking as a starting point an interesting and engaging news article from the press to motivate learners. We propose a fact-checking activity that involves concepts studied in both statistics and economics subject areas, using students’ existing knowledge and skills to easily introduce new concepts as recommend by the CLT. Furthermore, this approach helps students to realize that the topics they are studying are not mere theoretical speculation but are indeed part and parcel of the real world. Following the teacher’s instructions, students are guided through the activity where they learn to manipulate real and large databases and to use of statistics software, as well as to connect theoretical concepts with real problems and practice a reasoning thinking to obtain conclusions.
Further extensions of this activity can be applied by managing other surveys to study a variety of economic concepts such as salary structure. The salary structure survey is a useful tool for work on issues such wages distribution (total and by gender), average wage by regions, the most usual salary, and so on.
Gender salary gap or wages distribution by regions can be appealing topics for students to discuss in class, following the context knowledge approach proposed by Langrall et al. (Citation2011). From the students’ point of view, they should easily be engaged and motivated to reason critically and reflect on these present-day topics. From the teacher’s point of view, it is easy to find press stories about these topics to complete the activity.
As the literature suggests, such active-learning activities may be useful for enhancing learning because concepts can be established more efficiently in students’ memory when more levels of experience are included in the learning process (Hakeem Citation2001).
We did not directly assess the effectiveness of this specific activity because we wanted to offer alternative learning opportunities for all students; therefore, we did not consider setting up a control group. However, for further research, it would be interesting to implement this activity again and compare scores for at least two academic years. In this way, we would be able to compare the learning achievements for a specific topic using traditional teaching methods with a more active-learning approach following SRLE principles.
ORCID
María Caballer-Tarazona http://orcid.org/0000-0001-9242-0464 Vicente Coll-Serrano http://orcid.org/0000-0002-7813-7379
References
- American Statistical Association (ASA) (2014), “Guidelines for Undergraduate Programs in Statistical Science.”
- Barnett, V. (2002), Sample Survey Principles and Methods. Oxford, UK: Oxford University Press.
- Becker, W. E. (2000), “Teaching Economics in the 21st Century,” Journal of Economic Perspectives, 14, 109–119. DOI: 10.1257/jep.14.1.109.
- Becker, W. E., and Watts, M. (2001), “Teaching Methods in U.S. Undergraduate Economics Courses,” The Journal of Economic Education, 32, 269–279. DOI: 10.1080/00220480109596108.
- Ben-Zvi, D., and Garfield, J. B. (2004), The Challenge of Developing Statistical Literacy, Reasoning and Thinking. Dordrecht, The Netherlands: Kluwer Academic Publishers.
- Biehler, R., Ben-Zvi, D., Bakker, A., and Makar, K. (2013), “Technology for Enhancing Statistical Reasoning at the School Level,” in Third International Handbook of Mathematics Education, eds. M. Clements, A. Bishop, C. Keitel, J. Kilpatrick, and F. Leung, New York: Springer, pp. 643–689.
- Brante, G., and Brunosson, A. (2014), “To Double a Recipe—Interdisciplinary Teaching and Learning of Mathematical Content Knowledge in a Home Economics Setting,” Education Inquiry, 5, 23925.
- Cárcamo, A., Fortuny, J., and Fuentealba, C. (2018), “The Emergent Models in Linear Algebra: An Example With Spanning Set and Span,” Teaching Mathematics and Its Applications: An International Journal of the IMA, 37, 202–217. DOI: 10.1093/teamat/hrx015.
- Clemente, Y., and Gutiérrez, H. (2017), “¿En qué provincias hay más paro? Claves del mercado laboral de 2016,” El Pais, available at https://elpais.com/elpais/2017/01/26/media/1485444218_695832.html.
- Cobb, P., Confrey, J., diSessa, A., Lehrer, R., and Schauble, L. (2003), “Design Experiments in Educational Research,” Educational Researcher, 32, 9–13. DOI: 10.3102/0013189X032001009.
- Cobb, P., and McClain, K. (2004), “Principles of Instructional Design for Supporting the Development of Students Statistical Reasoning” (Chapter 16), in The Challenge of Developing Statistical Literacy, Reasoning and Thinking, eds. D. Ben-Zvi and J. Garfield, Dordrecht: Kluwer Academic Publishers, pp. 375–395.
- Elias, M. (2010), “Impact of the Bologna Process on Spanish Students’ Expectations,” International Journal of Iberian Studies, 23, 53–62. DOI: 10.1386/ijis.23.1.53_3.
- Feudel, F., and Dietz, H. M. (2019), “Teaching Study Skills in Mathematics Service Courses—How to Cope With Students’ Refusal?,” Teaching Mathematics and Its Applications: An International Journal of the IMA, 38, 20–42. DOI: 10.1093/teamat/hrx016.
- Garfield, J., Ben-Zvi, D., Chance, B., Medina, E., Roseth, C., and Zieffler, A. (2008), “Creating a Statistical Reasoning Learning Environment” (Chapter 3), in Developing Students’ Statistical Reasoning. Connecting Research and Teaching Practice, Dordrecht: Springer, pp. 45–63.
- Guzman, L. M., Pennell, M. W., Nikelski, E., and Srivastava, D. S. (2019), “Successful Integration of Data Science in Undergraduate Biostatistics Courses Using Cognitive Load Theory,” CBE—Life Sciences Education, 18, ar49. DOI: 10.1187/cbe.19-02-0041.
- Hakeem, S. A. (2001), “Effect of Experiential Learning in Business Statistics,” Journal of Education for Business, 77, 95–98. DOI: 10.1080/08832320109599056.
- INE (2002), “Cambios Metodológicos EPA-2002, Boletín Informativo del Instituto Nacional de Estadística.”
- INE (2017), “Economically Active Population Survey.”
- International Statistical Institute (1990), A Dictionary of Statistical Terms (5th ed.), F. H. C. Marriott. Published for the International Statistical Institute by Longman Scientific and Technical.
- Kirschner, P. A., Sweller, J., and Clark, R. E. (2006), “Why Minimal Guidance During Instruction Does Not Work: An Analysis of the Failure of Constructivist, Discovery, Problem-Based, Experiential, and Inquiry-Based Teaching,” Educational Psychologist, 41, 75–86. DOI: 10.1207/s15326985ep4102_1.
- Langrall, C., Nisbet, S., Mooney, E., and Jansem, S. (2011), “The Role of Context Expertise When Comparing Data,” Mathematical Thinking and Learning, 13, 47–67. DOI: 10.1080/10986065.2011.538620.
- Lee, V. S., Greene, D. B., Odom, J., Schechter, E., and Slatta, R. W. (2004), “What Is Inquiry-Guided Learning?,” in Teaching and Learning Through Inquiry: A Guidebook for Institutions and Instructors, ed. V. S. Lee, Sterling, VA: Stylus, pp. 3–16.
- Lovett, M. C., and Greenhouse, J. B. (2000), “Applying Cognitive Theory to Statistics Instruction,” The American Statistician, 54, 196–206.
- Nolan, D., and Speed, T. P. (1999), “Teaching Statistics Theory Through Applications,” The American Statistician, 53, 370–375.
- OECD Data (2020), “Unemployment rate,” available at https://data.oecd.org/unemp/unemployment-rate.htm.
- ProCivicStat (2019), “Promoting Civic Engagement via Explorations of Evidence,” available at http://iase-web.org/islp/pcs/.
- Ridgway, R., Nicholson, J., Gal, I., and Ridgway, J. (2018), “Understanding Statistics About Society: A Brief Framework of Knowledge and Skills Needed to Engage With Civic Statistics. A Product of the ProCivicStat Project,” available at http://IASEweb.org/ISLP/PCS.
- Tarmizi, R. A., and Bayat, S. (2012), “Collaborative Problem-Based Learning in Mathematics: A Cognitive Load Perspective,” Procedia—Social and Behavioral Sciences, 32, 344–350. DOI: 10.1016/j.sbspro.2012.01.051.
- Van Merrienboer, J. J., and Sweller, J. (2005), “Cognitive Load Theory and Complex Learning: Recent Developments and Future Directions,” Educational Psychology Review, 17, 147–177. DOI: 10.1007/s10648-005-3951-0.
- Warburton, K. (2003), “Deep Learning and Education for Sustainability,” International Journal of Sustainability in Higher Education, 4, 44–56, DOI: 10.1108/14676370310455332.
- Watts, M., and Becker, W. E. (2008), “A Little More Than Chalk and Talk: Results From a Third National Survey of Teaching Methods in Undergraduate Economics Courses,” The Journal of Economic Education, 39, 273–286. DOI: 10.3200/JECE.39.3.273-286.
- Wild, C. J., Pfannkuch, M., Regan, M., and Horton, N. J. (2011), “Towards More Accessible Conceptions of Statistical Inference,” Journal of the Royal Statistical Society, Series A, 174, 247–295. DOI: 10.1111/j.1467-985X.2010.00678.x.