
 ?Mathematical formulae have been encoded as MathML and are displayed in this HTML version using MathJax in order to improve their display. Uncheck the box to turn MathJax off. This feature requires Javascript. Click on a formula to zoom.
Abstract
The flipped classroom (FC) inverts the traditional classroom by having students participate in passive aspects of learning at home and active aspects of learning in class with the guide of an instructor. The introductory statistics course for nonmath majors may be especially suited to the FC model given its unique challenges as a required course for students with varying mathematical skills and background. For example, these students often have low interest and high statistics-related anxiety. Recent studies suggest the FC for introductory statistics courses leads to increased performance relative to a traditional lecture-based classroom (LC). This meta-analysis compared the academic performance of students in introductory statistics courses for nonmath majors who were taught in a FC versus those taught in a LC. Results indicate that students in the FC had statistically discernibly higher final performance outcomes compared to the LC delivery with an average difference of 6.9% in performance (Hedge’s g = 0.43), though there was evidence of moderation by the presence of weekly in-class quizzes. These findings suggest that implementing the FC within the introductory statistics classroom at the undergraduate level may improve learning achievement, but more research is needed to explore the role of regular class quizzes. Supplementary materials for this article are available online.
1 Introduction
The trendiest pedagogical approach in post-secondary educational research is the flipped classroom (FC), a blended learning model that reverses the paradigm where traditional homework and lectures take place. Students engage in the relatively passive content learning prior to class (typically by viewing lectures online at their leisure and ideally reflecting on content), allowing for in-class time to be dedicated to the active learning of content (i.e., problem solving, assignments, group work, quizzes, etc.) with peer mentor and instructor support available. Though the FC still relies on the lecture as its principal building block, in assigning it as self-paced homework, the lecture is reduced to more digestible chunks, preventing cognitive overload (Karaca and Ocak Citation2017). Proponents of the FC model argue that as an active learning theory centered around the student (Bishop and Verleger Citation2013), proactive engagement and class participation is maximized, thereby increasing learner autonomy and enjoyment (Dove Citation2013). The instructor’s role also “flips” from “Sage on the Stage” to “Guide on the Side” (King Citation1993), whose job is to provide individualized instruction and scaffold student learning. This facilitates more opportunities to directly assess comprehension levels.
The FC began appearing within the post-secondary educational literature about a decade ago (Stone Citation2012), gaining popularity across a variety of educational fields as a hybrid model that utilizes technology for learning. Challenges for students include a perception of online lectures as disengaging, dissatisfaction with not being able to ask questions when viewing lectures, and heavier workloads (Lape et al. Citation2014). Moreover, the success of the FC relies on the notion that students are motivated enough to “self-pace” their lecture viewing; many students benefit from fixed lecture schedules that prevent “binge-watching” of lectures ahead of important deadlines (Beatty, Merchant, and Albert Citation2017).
One class that may be a suitable candidate for the FC pedagogy is the introductory statistics course for nonmath majors at the undergraduate level (e.g., social science, health, etc.). Content within this course can vary considerably, but typically covers effect sizes, basic inferential statistics, including normal probability distributions and random variables, measures of central tendency/variability, the central limit theorem, sampling, hypothesis testing of one and two sample means and proportions, chi-square tests of contingencies, confidence intervals, correlation, ANOVA, and/or regression.
There are ample reasons why “students frequently view statistics as the worst course taken in college” (Hogg Citation1991, p. 342). Introductory statistics is required for many majors, but often perceived as a stumbling block with little practical value (Slootmaeckers, Kerremans, and Adriaensen Citation2014). Many students are unmotivated, anxious (Onwuegbuzie and Wilson Citation2003), apprehensive (Emmioglu and Capa-Aydin Citation2012), and have a fixed mindset that they are poor in math, compounding problems succeeding in this course (Boaler Citation2013). Students also struggle to prepare and feel that extra class time for practice would be useful (Wilson Citation2013). As class preparation may vary widely among statistics students (Hudak and Anderson Citation1990), instructors may be challenged to lecture at the right tempo and keep content suitable. However, the FC allows students to self-pace (Fulton Citation2012), while in-class activities may increase statistical literacy and decrease perceptions of instructors as unapproachable (Chiou,Wang, and Lee Citation2014; Waples Citation2016), which in combination, may alleviate lecture-related challenges.
Nonetheless, flipping an introductory statistics class can present considerable challenges for instructors. The unfamiliar territory of the FC often results in instructor learning curves (Van den Bergh, Ros, and Beijaard Citation2014) and substantial front-end work creating prerecorded lectures and planning in-class activities, while freshly freed-up class time can seem ominous and training is often required for new instructors (Niemi Citation2002). Other drawbacks are a dependence on IT support and multiple technologies, and the need to convince students to take initiative (Vaughan Citation2014). Moreover, for instructors who already incorporate active learning components into their lecture or include lab time, as is often the case in introductory statistics, the idea of the FC may not seem innovative. To ease the burden of flipping an entire introductory statistics class course, Burgoyne and Eaton (Citation2018) recommended flipping only the most challenging content of the course.
A handful of studies comparing the efficacy of the FC to the traditional lecture class (LC) in undergraduate introductory statistics for nonmath majors suggests the FC increases cooperative learning and classroom innovation (Strayer Citation2012) and can lead to statistically discernible (significant) learning gains even for inexperienced “flippers” (Wilson Citation2013). The FC may also improve long-term retention. Winquist and Carlson (Citation2014) found that a year after completing an introductory statistics course delivered in the FC format, FC students outperformed LC students on the statistics section of a standardized test by 0.43 standard deviations, on average, but not on other nonstatistics portions of the standardized test that were not subjected to the FC delivery. This suggests that the flipped format resulted in more meaningful, long-term learning. Studies assessing the FC for introductory statistics solely among math majors seem to be sparse, suggesting that LCs among math majors may be more commonly used and that there has been minimal evaluation of FC in this context. Strayer (Citation2012) examined the FC in statistics classes among students from a variety of majors (including math), however, variability in effects across different majors was not examined.
Although the literature on the FC in introductory statistics classes generally shows an advantage over the LC delivery with respect to learning-related outcomes, several of the quasi-experimental studies exploring learning outcomes appear under-powered due to small class sizes. Moreover, this early research lacks strong causal claims for the effectiveness of the FC; although controls are typically implemented (same day/time of class, semester, etc.), the few randomized studies within introductory statistics have concluded little benefits of the FC (Bowen et al. Citation2012; Briggs et al. Citation2019). Though several meta-analyses demonstrate that the FC may be a promising alternative to the LC for undergraduate students (Chen et al. Citation2018; Gillette et al. Citation2018; Cheng, Ritzhaupt, and Antonenko Citation2019; Låg and Saele Citation2019; van Alten et al. Citation2019), no meta-analyses have been conducted on undergraduates enrolled in introductory statistics courses. Given the pedagogical hurdles of introductory statistics, we aim to explore whether the FC boosts performance outcomes among nonmath majors, those most likely to struggle in this course.
This meta-analysis aggregated current research studying the performance benefits of the FC in introductory statistics classes. We also conducted a meta-regression to explore whether class size, weekly quizzes, and the field of study for which the FC is designed (social science classes versus classes that require previous mathematical and/or statistical prerequisites) were moderators of the effect of the FC on performance outcomes. Our two overarching research questions were: (1) Do nonmath majors enrolled in an introductory statistics class perform better on final exams or overall course grades when enrolled in the FC compared to a LC class? and (2) Is the FC effect moderated by class size, weekly quizzes, or field of study?
2 Methods
2.1 Search Strategy
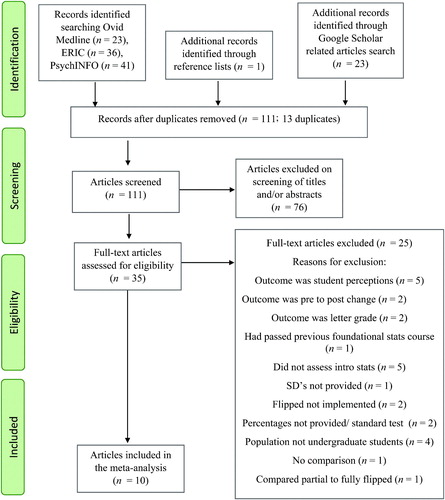
Following the Preferred Reporting Items for Systematic Reviews and Meta-Analyses guidelines (PRISMA; Moher et al. 2009), academic literature databases (Ovid Medline, ERIC, and PsychINFO) were searched using key terms “flipped class*” AND “statistics” up until March 2020, with articles restricted to English. Reference lists were also scanned to find further appropriate articles. Details for the literature search are presented in .
Fig. 1 Flowchart of the selection of studies included in the meta-analysis. Note. Reasons for exclusion are not mutually exclusive.
2.2 Inclusion Criteria
Study inclusion criteria are as follows: (1) the target population was nonmathematics and nonstatistics undergraduate majors of any age; (2) the FC was implemented in an introductory statistics class (not intermediate statistics or any other research methods course); (3) experimental or quasi-experimental between-subjects study designs were used; (4) the exposure of interest was the FC and the comparison group was the LC; (5) the outcome of interest was final grade or final exam performance as a percentage (or data were available to calculate a percentage); (6) raw unstandardized difference in means for final exams or final grades in percentage points or adjusted (i.e., standardized) difference in means for final grade or final exams were provided for the FC and LC groups; and (7) standard deviations or standard errors were provided for the FC and LC groups. We excluded nonempirical studies or those assessing attitudes toward the FC.
2.3 Data Extraction
The following data were extracted from each study meeting inclusion criteria: (1) citation details; (2) study design; (3) class size for the FC, and if studies aggregated two or more classes for analysis, total sample size for the FC; (4) class size for the LC, and if studies aggregated two or more classes for analysis, total sample size for the LC; (5) performance outcome type; (6) mean for the FC; (7) mean for the LC; (8) SD for the FC; (9) SD for the LC; (10) adjusted difference in means on final exam scores or final grades for studies reporting regression-based results; (11) standard error if an adjusted difference in means was provided; (12) field of study; (13) p-values for mean difference; and (14) whether quizzes were implemented in the FC, LC, or both (see ). Further details on study characteristics are available in SupplementalTable∼1.
Table 1 Descriptive statistics of meta-analytic studies.
2.4 Statistical Analysis
We could not assume that all the studies were estimating a single treatment effect size for the FC (Borenstein et al. Citation2009), so a random effects model (REM) was used. This allows for the observed estimate of treatment effects to vary between studies based on real differences in the treatment effect (in addition to random sampling variability). A fixed-effects model would be inappropriate as it assumes the true effect does not vary between studies and the differences between studies are due only to differences in power and random sampling variation (Riley, Higgins, and Leeks 2011). The pooled effect size was computed as a weighted simple difference in means in final exam percentage or final grade percentage between the FC and LC formats (with 95% CI). We included an effect size measure of the simple difference in means in percentage as these units are the simplest way to interpret and directly answer the primary research question about whether flipping introductory statistics works. The standard error of the difference in means was computed for each study using the formula:where
and
are the variances of the LC and FC scores, respectively, and n1 and n2 are the total sample sizes of the LC and FC, respectively. Though the unstandardized difference in means is the easiest way to interpret effects, we also calculated Hedge’s g (Hedges and Olkin Citation1985) estimates to facilitate comparison with other meta-analyses on the FC (results reported in the Appendix). The I2 statistic is reported as a measure of heterogeneity, and a meta-regression was performed to explore prespecified sources of between-study heterogeneity; in particular whether class size (small vs. large), use of quizzes, and field of study moderated the effect of the FC. To assess whether the pooled estimate was influenced by any single study, an influence analysis was conducted (i.e., leave-one-out). We examined publication bias through a funnel plot and trim-and-fill analyses. All statistical analyses were performed using statistical software R Version 3.5.3 (R Core Team Citation2017) and the metaforpackage (Viechtbauer Citation2010). A two-sided nominal Type I error rate of α =.05 was used.
3 Results
3.1 Study Selection
An initial search of Medline, ERIC, and PsycINFO found 100 articles. Reference lists and a search of related articles through Google Scholar yielded an additional 24 articles. After removing duplicates (n = 13), 111 articles were screened, with 76 articles removed based on titles and abstracts. Thirty-five full articles were reviewed, with 25 excluded for various reasons (detailed in ), leaving 10 articles meeting full inclusion criteria. Khan and Watson (Citation2018) compared the FC to the LC over four semesters (two spring and two fall) and these were treated as two studies (spring, fall), resulting in N = 11 studies on 7209 participants across ten articles. Outcome measures were 3-fold: final exam score (n = 8), final grade (n = 2), and posttest score not included in students’ course grades (n = 1), which were reported as a percentage or were converted to a percentage by the authors. All studies used a quasi-experimental design.
3.2 Study Characteristics
Total sample sizes in the FC ranged between 20 and 1466, and between 20 and 1485 in the LC. FC class size did not exceed 483 students. The median percentage for outcomes was 71.5 in the FC and 64.1 in the LC. Standardized mean differences ranged between small (-0.16) and large (1.14) effect sizes, respectively. Ten studies found a higher average performance for the FC compared to the LC; six studies showed statistically discernibly higher performance for the FC (p < 0.05), while five studies did not report p-values for the comparisons of interest. However, when we calculated p-values based on the means, SDs, and sample sizes, nine studies showed a statistically discernible difference at , while two did not (). In terms of simple differences in means between class formats, one study (Gundlach et al. Citation2015) observed a benefit of the traditional LC class; two studies found a difference in mean final outcome percentage less than 5% (Nielsen, Bean, and Larsen Citation2018; Khan and Watson Citation2018, Study 2); four studies found a difference in mean final outcome percentage greater than 5% but less than 10% (Wilson Citation2013; Shinaberger Citation2017; Khan and Watson Citation2018, Study 1; Reyneke, Fletcher, and Harding Citation2018), and four found a difference in mean final outcomes greater than 10% (Cilli-Turner Citation2015; Peterson Citation2016; Heuett Citation2017; Maldonado and Morales Citation2019). Shinaberger (Citation2017) reported a covariate-adjusted simple difference in means between the FC and LC, while the rest of the effects were unadjusted simple difference in mean performance.
3.3 Meta-Analytic Findings
The pooled difference in means in percentage for the 11 studies was 6.9% (95% CI [3.7, 10.1]). The forest plot depicts the overall mean in the FC as 6.9% higher () than the LC class ( depicts a forest plot using Hedge’s g effect size). Estimated heterogeneity was substantial, with , suggesting that studies varied in terms of the magnitude and direction of the effect sizes, and a large proportion of variability in the effect of the FC is due to differences between studies beyond that which would be expected due to sampling error alone (Borenstein et al. Citation2009; Israel and Richter Citation2011). All analyses are reproduced using Hedge’s g effect size units in SupplementalTable∼2.
Fig. 2 Forest plot for the simple difference in mean final outcome percentage (MD) between the flipped classroom and lecture classroom among n = 11 studies included in the meta-analysis. Weights are those given to the observed effects during the random effects model estimation.
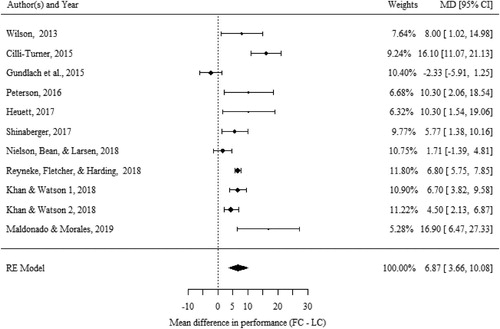
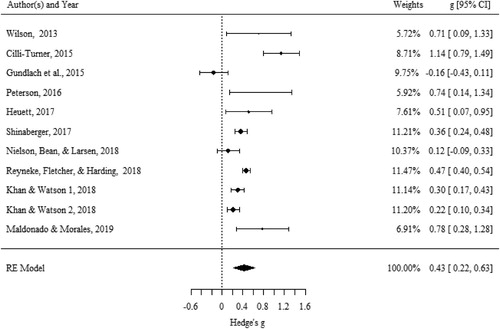
Fig. 3 Forest plot for Hedge’s g standardized mean difference between the flipped classroom and lecture classroom among n = 11 studies included in the meta-analysis. The overall mean in the FC is 0.43 standard deviations higher than the LC class. Weights are those given to the observed effects during the random effects model estimation.
3.4 Sensitivity Analysis
An influence analysis suggested that one study (Cilli-Turner Citation2015) had excessive influence over the pooled estimate (Cook’s distance = 0.59). Removing this study decreased the pooled estimate of the difference in means to 5.6% (95% CI [2.9, 8.3]) and reduced I2 to 83%.
Though all studies used a common metric (mean class percentage), a potential concern was that not all studies used final exam as the primary outcome. To address this, we removed two studies with final grade as outcome (Reyneke, Fletcher, and Harding Citation2018; Maldonado and Morales Citation2019), and one study that used a noncredit posttest evaluation (Wilson Citation2013). Our analysis of these eight studies with a final exam score outcome resulted in a slight decrease to the pooled difference in mean final exam percentage, 6.1% (95% CI [2.2, 10.1]), though heterogeneity remained high , suggesting that the different performance outcomes among the three excluded studies did not meaningfully impact the variability in effects across studies, thus providing rationale for combining the 11 studies in our primary analysis.
3.5 Publication Bias
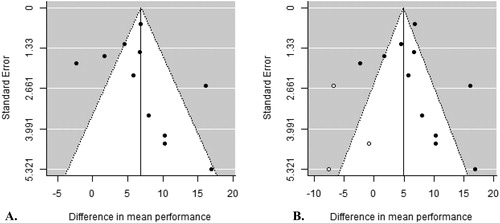
Publication bias may artificially exaggerate meta-analytic effects by suppressing studies showing unfavorable effects. In the absence of publication bias, a funnel plot should be symmetrical as studies with high precision should cluster close to the pooled estimate, while studies with low precision should disperse widely and evenly on both sides of the pooled estimate. The funnel plot of our studies (panel A of ) appears asymmetrical, with the lower left area of the funnel plot missing studies, an area corresponding to smaller studies that favor the LC, suggesting that studies may be missing due to publication bias. Due to the small number of studies, a test of funnel plot asymmetry is just statistically discernible with p = 0.05.
Fig. 4 Funnel plot for final n = 11 studies included in the meta-analysis. Before applying trim-and-fill (panel A), and after applying trim-and fill (panel B). Closed points are the 11 observed studies, while open points represent 3 missing studies imputed from the trim-and-fill analysis. Dashed lines represent 95% confidence limits, and the vertical line represents the overall pooled difference in mean final exam percentage (6.9% in panel A and 4.9% in panel B).
Trim-and-fill removes studies that cause funnel plot asymmetry, then iteratively re-estimates the pooled effect and number of missing studies based on the remaining studies minimally affected by publication bias (Duval and Tweedie Citation2000). Terrin et al. (Citation2003) found that trim-and-fill may spuriously adjust for nonexistent publication bias if heterogeneity is high and results in precisely estimated studies with effects far from the pooled effect, and if there is an inverse association between treatment effects and sample size introduced by a priori power calculations. None of our studies conducted power analysis, and some of our most precise effects are moderately far from the overall mean, thus we also include results from a trim-and-fill analysis to ensure our results are robust.
Trim-and-fill estimated that three studies were missing (SE = 2.23; see , panel B), and a bias-adjusted pooled estimate of 4.9% (95% CI [1.3, 8.5]). Compared to the original effect, the pooled estimate is closer to zero. The CI became slightly wider and heterogeneity increased to I2 = 91%, likely because the new studies had large standard errors and extended the range of effects observed. Shi and Lin (Citation2019) recommend reporting each algorithmic estimator as they may diverge. Both the linear and quadratic estimators concluded 3 missing studies, while the run method concluded no missing studies.
3.6 Meta-Regression
Potential sources of heterogeneity were explored using meta-regression with field of study, FC classroom size, and quizzes as moderators. Field of study was dichotomized into nonsocial science (NSS = 0; n = 5), which were classes for business or engineering students that often required some mathematics course as prerequisite versus social science (SS = 1; n = 6). Class size was included as a dichotomous moderator, with classes greater than 100 considered large (large = 0, n = 4; small = 1, n = 7). Among studies that employed weekly quizzes within the FC (n = 10), quizzes were dichotomized as whether a quiz was also employed in the LC (no = 0; yes = 1).
In two separate models examining the unadjusted effect of class size and field of study as moderators of the FC effect (N = 11), neither were statistically discernible, B = 3.3 (95% CI [-2.6, 9.2]) and 0.5 (95% CI [-6.6, 5.5]), respectively. Furthermore, these moderators accounted for very little heterogeneity (8% and 0.6%, respectively). Simultaneously entering class size and field as moderators also did not reveal statistically discernible adjusted meta-regressive effects, but adjusted effects were larger in magnitude than unadjusted effects, suggesting mutual suppression (Conger Citation1974). The average mean difference between the FC and LC, controlling for field, was 4.6% higher for small classes compared to large classes, B = 4.6 (95% CI [-1.95, 11.2]), and the average adjusted mean difference between the FC and LC, controlling for class size, was 2.8% lower for social science classes compared to nonsocial science classes,
2.8 (95% CI [-9.3, 3.7]), see . This can be explained by the relationship between field of study and class size. The largest class sizes were observed for nonsocial science classes, thus adjusting both variables simultaneously allows for more precise estimates of the effect of class size and field of study, respectively. That is, the effect of class size is adjusted by its association with field of study, and vice versa. Furthermore, heterogeneity accounted for by the two moderators was larger than the sum of each individual moderator at 15%. Estimated heterogeneity for the meta-regression model remained high,
, suggesting that class size and field do not explain the observed heterogeneity in these studies.
Table 2 Unadjusted and adjusted effect estimates from meta-regression models of class size and field predicting differences in mean final exam percentage or final grade percentage between flipped and traditional classrooms teaching methods.
Another potential source of heterogeneity we explored was weekly quizzes, and whether the presence of a quiz in the LC attenuated the observed advantage of the FC. Out of the ten studies that employed weekly quizzes within the FC, four provided the LC with a weekly quiz, while six did not. The average difference in mean final exam percentage between the FC and LC was discernibly higher for studies that included a quiz for the FC but not for the LC (when compared to studies that had a quiz in both the LC and FC), B = 6.8 (95% CI [2.1, 11.5]). The estimated difference in mean final exam percentage among studies with quizzes in both sections was B = 2.8 (95% CI [-0.5, 6.1]), while among studies with quizzes only in the FC, B = 9.6 (95% CI [6.3, 12.9]). Heterogeneity also was reduced to I2 = 72%, and quizzes accounted for 55% of the heterogeneity. The effect of quizzes remained after adjusting for field and class size, B = 7.0 (95% CI [1.3, 12.6], I2 = 68%). The effects of class size and field reduced substantially after controlling for quizzes with 0.5 (95% CI [-6.9, 5.9]) and
0.5 (95% CI [-6.2, 5.2]), respectively. Taken together, these exploratory results suggest a potential role of weekly quizzes as a driver of the effectiveness of the FC.
4 Discussion
The FC facilitates collaboration between students and active learning components. Hours in the classroom typically reserved for lecturing content are outsourced to online videos, freeing up class time to allow for hands-on learning and teamwork. This meta-analysis sought to aggregate the potential evidence of the superiority of the FC over the LC class for introductory statistics classes for nonmath majors. To our knowledge, this is the first comprehensive meta-analysis on this topic to date.
Our primary finding is that the FC has the potential to increase performance in introductory statistics for nonmath majors. Our most common outcome was final exams, which are a good comparative tool between classes implementing different teaching methods, particularly when assessments and instructors are kept consistent across sections (Emmioglu and Capa-Aydin Citation2012). Of our pool of 11 studies, nine used the same instructor across class formats, and all instructors tested their outcomes using the same grading format. A statistically discernible pooled difference in mean final exam percentage or final grade percentage favoring the FC was found, and this difference is estimated to be about seven percentage points. The confidence interval around that estimate is fairly narrow (95% CI [3.7, 10.9]), indicating a moderate degree of certainty in the magnitude of the effectiveness of the FC compared to LC delivery for introductory statistics. Our standardized mean difference estimate of g = 0.40 falls on the higher end of the range of effect sizes obtained in other meta-analyses comparing the FC to the LC. For example, a recent interdisciplinary review by Cheng, Ritzhaupt, and Antonenko (Citation2019) reported an effect of g = 0.21 among undergraduate classes on cognitive learning outcomes.
We also explored potential sources of heterogeneity across our sample using meta-regression. Field of study and class size were not statistically discernible moderators of the FC effect, though the advantage of the FC appeared to be function of weekly quizzes, which accounted for a large proportion of total study heterogeneity (55%), and suggested that there was no statistically discernible difference on performance between studies that employed quizzes in both the LC and FC classes. Short pre-lecture quizzes have been found to improve exam and overall course performance in traditional introductory statistics courses (Brown and Tallon Citation2015) as students feel more prepared and less anxious about testing. Quizzes have also been found to moderate FC effects on learning outcomes in other meta-analyses (Hew and Lo Citation2018; van Alten et al. Citation2019). Given that the FC for introductory statistics requires a relatively large investment by instructors relative to an LC (Peterson Citation2016), as well as school administrators’ accepting the potential strain that flipping has on research productivity and other duties, we recommend further research to explore the role of regular class quizzes in traditional introductory statistics courses.
Remaining between-study heterogeneity unaccounted for by our moderators (I2 = 56%) may stem from methodological diversity of in-class activities, test content and formats, instructor expertise in teaching statistics, and experience in implementing the FC. Like other meta-analyses comparing the FC to the LC, high heterogeneity has been consistently reported (Chen et al. Citation2018; Gillette et al. Citation2018; Cheng, Ritzhaupt, and Antonenko Citation2019; van Alten et al. Citation2019, among others), along with moderation effects of structural features such as in-class time, lecture-like components, and quizzes (van Alten et al. Citation2019). Within introductory statistics classes implementing an FC, even differences in video content impact performance (van der Meij and Dunkel Citation2020). Though a standard method to flip classes has not been established, consistency in delivery is needed to ensure that future comparisons between the FC and LC are indeed “apples to apples” (for guides on flipping introductory statistics courses, see Hussey, Richmond, and Fleck Citation2015; Kraut Citation2015; Kuiper et al. Citation2015).
Differences between the use of active learning components in the LC are another plausible source of heterogeneity. For instance, Gundlach et al. (Citation2015) was the single study with a small advantage of the LC over the FC, which could be explained by less face-to-face class time in the FC relative to the LC (1 hr vs. 3 hr, respectively), or by the instructor’s greater experience teaching traditional lectures. A more plausible explanation is that the LC was a “super” lecture, whereby LC students were given access to the same online lectures provided to FC students, and despite the large LC size (n = 331), content-based Clicker questions were utilized, as well as quizzes in the form of weekly recitations that included problem-solving and other active learning based activities. Other research suggests that going beyond “chalk-and-talk” to include active components minimizes differences between LCs and FCs (Jensen, Kummer, and Godoy Citation2015). In Gillette et al.’s (Citation2018) review of pharmacy courses, most LCs utilized some form of active learning, and no statistically discernible advantages on course grade scores and final exam scores were reported for the FC.
Study quality and risk of bias was not formally assessed as information to aid decisions was often lacking, though we discuss indicators loosely based on guidelines set out by Goldstein, Lackey, and Schneider (Citation2014) and Higgins and Green (Citation2011). Although the quasi-experimental nature of the studies reduced bias by keeping many important features of the FC and LC consistent (same day/time of class, semester, instructor, etc.), the overall risk of bias is likely elevated due to a combination of nonrandomization to class sections (FC vs. LC), self-selection, grader bias, and the same/self nature of researchers and instructors. To our knowledge, no randomized controlled trials (RCTs) have compared the impact of the FC to LC for statistics courses for nonmath majors. While two large multi-institution RCTs have explored the impact of online adaptive machine-learning or textbook replacement strategies compared to standard LC (Bowen et al. Citation2012; Briggs et al. Citation2019), both found no evidence of statistically discernible effects of performance outcomes, such as exam scores and pass rates.
The quasi-experimental nature of the studies in this meta-analysis means that self-selection of students into their preferred class section cannot be ruled out as a source of bias. Based on scheduling needs or preference, self-selection could lead to inequities between FC and LC sections that confound the effect of the FC (e.g., one section may have a higher mean GPA, lower levels of statistics anxiety, etc.). To circumvent self-selection, Nielsen, Bean, and Larsen (Citation2018) made the FC and LC class formats appear similar during student registration, and Cilli-Turner (Citation2015) informed students of the format during the first class, but it was unclear whether other studies used similar strategies (even so, obscuring the format would not prevent drop-outs after the course started, but dropout rates were not made clear across studies). Ideally, individual students from a single cohort should be allocated at random to either the FC or LC format, which ensures that any differences in performance after intervention can be attributed to differences in pedagogies. However, ethics approval for this design is challenging as students must consent to randomization. An alternative is to administer pretests measuring potential confounders. While Peterson (Citation2016) and Gundlach et al. (Citation2015) report that GPA at pretest was not discernibly different between the classes, other studies did not report baseline characteristics between groups.
Another probable source of bias is the introduction of experimenter bias, or observer-expectancy effects (Rosenthal and Fode Citation2007) due to the authors playing dual roles as principal investigator and instructor for both the FC and LC. Typically, having the same instructor for both classes mitigates the confounding effects of teaching style, experience, and ability. Yet this can introduce new confounders, such as greater experience and preference for teaching one format, and divergent expectations for student performance. Particularly when the instructor expects or hopes the FC will be more fruitful than the LC, they may teach the flipped class with more ardor, increasing class engagement and learning. Many authors acknowledged a personal preference and teaching philosophy in favor of the FC, which likely lead them to publish their research in the first place. Future research should strive to minimize experimenter bias by keeping instructors and primary researchers distinct.
A third source of bias is the lack of blinding of exam graders to students’ class sections, which can lead to an influence of upgrading for FC students on written exam components that are graded subjectively (e.g., short answer questions). Out of the eight studies with an exam outcome, six did not describe the structure (e.g., multiple choice, true/false, short answer), and only two studies made clear that test graders were blinded to student class section when exams were marked. For instance, Heuett (Citation2017) stated that “completed exams from all sections were de-identified by folding over the cover page, placed into one stack, randomly ordered by shuffling the stack, and graded by cycling through the stack one page at a time” (p. 892). It is not clear if other studies followed a similar blinding method. Another option to reduce subjectivity from grading is to use only MC exams across both sections. However, this may be undesirable, given that men tend to outperform women on MC tests (Williams, Waldauer, and Duggal Citation1992), and nonnative English speakers and those with learning disabilities tend to perform poorly with MC items (Bresnock, Graves, and White Citation1989). Future research may use course grade as outcome, which is more valuable to students and less impacted by grading bias, though it’s important that course components are weighted equally across sections.
Publication bias poses a concern that there may be additional unpublished studies finding weak effects of the FC or effects favoring the LC for introductory statistics. Though we did not identify any unpublished works, almost all of our studies obtained substantial effects favoring the FC. Our funnel plot and trim-and-fill analysis suggest potential publication bias, such that many effect sizes were larger than expected in a situation absent of publication bias. However, with only 11 studies it is difficult to make any strong conclusions about publication bias in this area. An interdisciplinary meta-analysis on the FC by Låg and Saele (Citation2019) also reported evidence of publication bias for learning outcomes and reduced performance effects among studies with sufficient power (g = 0.24; k = 90). As the FC pedagogy gains traction in introductory statistics, a future meta-analysis comparing the FC to the LC may provide more precise results.
Although there are weaknesses and risks of bias that discourage strong causal claims on the benefits of the FC for performance outcomes, the strength of the study is the pooled estimate on a large sample that is likely to be externally valid, and may generalize to other studies on introductory statistics courses for undergraduate nonmath majors.
Future studies should aim to improve reporting of study quality to facilitate risk of bias assessment. These results from various educational disciplines spanning several regions show some promising effects of the FC, although studies conducted with larger classes, randomized cohorts, and exploring the role of active learning and quizzes in the LC are warranted before the flipped pedagogy is widely adopted as the “best” approach to teaching introductory statistics classes.
Supplemental Material
Download Zip (27.9 KB)Supplementary Materials
includes details on meta-analysis study characteristics and reproduces main meta-analytic findings in Hedge’s g effect size units.
ORCID
Linda Farmushttp://orcid.org/0000-0002-5303-6408
Robert A. Cribbiehttp://orcid.org/0000-0002-9247-497X
Michael A. Rotondihttp://orcid.org/0000-0003-0895-5752
References
- Beatty, B. J., Merchant, Z., and Albert, M. (2017), “Analysis of Student Use of Video in a Flipped Classroom,” TechTrends, 63, 376–385, DOI: 10.1007/s11528-017-0169-1.
- Bishop, J. L., and Verleger, M. A. (2013), “The Flipped Classroom: A Survey of the Research,” in 120th ASEE Annual Conference and Exposition, Atlanta, GA.
- Boaler, J. (2013), “Ability and Mathematics: The Mindset Revolution that is Reshaping Education,” Forum, 55, 143–152, DOI: 10.2304/forum.2013.55.1.143.
- Borenstein, M., Hedges, L. V., Higgins, J. P. T., and Rothstein, H. R. (2009), Introduction to Meta-Analysis, Chichester: Wiley.
- Bowen, W. G., Chingos, M., Lack, K. A., and Nygren, T. I. (2012), “Interactive Learning Online at Public Universities: Evidence From Randomized Trials,” Ithaka S + R, DOI: 10.18665/sr.22464.
- Bresnock, A. E., Graves, P., and White, N. E. (1989), “Multiple-Choice Testing: Question and Response Position,” The Journal of Economic Education, 20, 239–145, DOI: 10.1080/00220485.1989.10844626.
- Briggs, A., Anderson, T., Gebrekristos, S., Simon, A., and Mei, A. (2019), “Evaluation of Adaptive Learning in Statistics (ALiS),” Urban Institute, available at https://www.urban.org/research/publication/evaluation-adaptive-learning-statistics-alis.
- Brown, M. J., and Tallon, J. (2015), “The Effects of Pre-Lecture Quizzes on Test Anxiety and Performance in a Statistics Course,” Education, 135, 346–350.
- Burgoyne, S., and Eaton, J. (2018), “The Partially Flipped Classroom: The Effects of Flipping a Module on ‘Junk Science’ in a Large Methods Course,” Teaching of Psychology, 45, 154–157, DOI: 10.1177/0098628318762894.
- Chen, K. S., Monrouxe, L., Lu, Y., Jenq, C., Chang, Y., Chang, Y., and Chai, P. (2018), “Academic Outcomes of Flipped Classroom Learning: A Meta-Analysis,” Medical Education, 52, 910–924, DOI: 10.1111/medu.13616.
- Cheng, L., Ritzhaupt, A. D., and Antonenko, P. (2019), “Effects of the Flipped Classroom Instructional Strategy on Students’ Learning Outcomes: A Meta-Analysis,” Educational Technology Research and Development, 67, 793–824, DOI: 10.1007/s11423-018-9633-7.
- Chiou, C., Wang, Y., and Lee, L. (2014), “Reducing Statistics Anxiety and Enhancing Statistics Learning Achievement: Effectiveness of a One-Minute Strategy,” Psychological Reports, 115, 297–310, DOI: 10.2466/11.04.PR0.115c12z3.
- *Cilli-Turner, E. (2015), “Measuring Learning Outcomes and Attitudes in a Flipped Introductory Statistics Course,” PRIMUS, 25, 833–846, DOI: 10.1080/10511970.2015.1046004.
- Conger, A. J. (1974), “A Revised Definition for Suppressor Variables: A Guide to Their Identification and Interpretation,” Educational and Psychological Measurement, 34, 35–46, DOI: 10.1177/001316447403400105.
- Dove, A. (2013), “Students Perceptions of Learning in a Flipped Statistics Class,” in Proceedings of the Society for Information Technology & Teacher Education International Conference 2013, eds. R. McBride and M. Searson, Chesapeake, VA: AACE, pp. 393–398.
- Duval, S. J., and Tweedie, R. L. (2000), “Trim and Fill: A Simple Funnel-Plot-Based Method of Testing and Adjusting for Publication Bias in Meta-Analysis,” Biometrics, 56, 455–463, DOI: 10.1111/j.0006-341x.2000.00455.x.
- Emmioglu, E., and Capa-Aydin, Y. (2012), “Attitudes and Achievement in Statistics: A Meta-Analysis Study,” Statistics Education Research Journal, 11, 95–102.
- Fulton, K. (2012), “Upside Down and Inside Out: Flip Your Classroom to Improve Student Learning,” Learning & Leading With Technology, 39, 12–17.
- Gillette, C., Rudolph, M., Kimble, C., Rockich-Winston, N., Smith, L., and Broedel-Zaugg, K. (2018), “A Meta-Analysis of Outcomes Comparing Flipped Classroom and Lecture,” American Journal of Pharmaceutical Education, 82, 6898–6440. DOI: 10.5688/ajpe6898.
- Goldstein, H., Lackey, K. C., and Schneider, N. J. B. (2014), “A New Framework for Systematic Reviews: Application to Social Skills Interventions for Preschoolers With Autism,” Exceptional Children, 80, 262–286, DOI: 10.1177/0014402914522423.
- *Gundlach, E. K., Richards, A. R., Nelson, D., and Levesque-Bristol, C. (2015), “A Comparison of Student Attitudes, Statistical Reasoning, Performance, and Perceptions for Web-Augmented Traditional, Fully Online, and Flipped Sections of a Statistical Literacy Class,” Journal of Statistics Education, 23, 1–33, DOI: 10.1080/10691898.2015.11889723.
- Hedges, L. V., and Olkin, I. (1985), Statistical Methods for Meta-Analysis, San Diego, CA: Academic Press.
- *Heuett, W. J. (2017), “Flipping the Math Classroom for Non-Math Majors to Enrich Their Learning Experience,” PRIMUS, 27, 889–907, DOI: 10.1080/10511970.2016.1256925.
- Hew, K. F., and Lo, C. K. (2018), “Flipped Classroom Improves Student Learning in Health Professions Education: A Meta-Analysis,” BMC Medical Education, 18, 1–12, DOI: 10.1186/s12909-018-1144-z.
- Higgins, J. P. T., and Green, S., eds. (2011), “Guide to the Contents of a Cochrane Protocol and Review,” in The Cochrane Handbook for Systematic Reviews of Interventions, Chichester: Wiley-Blackwell.
- Hogg, R. V. (1991), “Statistical Education: Improvements Are Badly Needed,” The American Statistician, 45, 342–343, DOI: 10.1080/00031305.1991.10475832.
- Hudak, M. A., and Anderson, D. E. (1990), “Formal Operations and Learning Style Predict Success in Statistics and Computer Science Courses,” Teaching in Psychology, 17, 231–234, DOI: 10.1207/s15328023top1704_4.
- Hussey, H. D., Richmond, A. S., and Fleck, B. (2015), “A Primer for Creating a Flipped Psychology Course,” Psychology Learning & Teaching, 14, 169–185, DOI: 10.1177/1475725715592830.
- Israel, H., and Richter, R. R. (2011), “A Guide to Understanding Meta-Analysis,” The Journal of Orthopaedic and Sports Physical Therapy, 41, 496–504, DOI: 10.2519/jospt.2011.3333.
- Jensen, J. L., Kummer, T. A., and Godoy, P. D. M. (2015), “Improvements From a Flipped Classroom May Simply Be the Fruits of Active Learning,” CBE—Life Sciences Education, 14, ar5,DOI: 10.1187/cbe.14-08-0129.
- Karaca, C., and Ocak, M. A. (2017), “Effect of Flipped Learning on Cognitive Load: A Higher Education Research,” Journal of Learning and Teaching in Digital Age, 2, 20–27, DOI: 10.15345/iojes.2017.02.017.
- *Khan, R. N., and Watson, R. (2018), “The Flipped Classroom With Tutor Support: An Experience in a Level One Statistics Unit,” Journal of University Teaching & Learning Practice, 15, 1–19.
- King, A. (1993), “From Sage on the Stage to Guide on the Side,” College Teaching, 41, 30–35. DOI: 10.1080/87567555.1993.9926781.
- Kraut, G. L. (2015), “Inverting an Introductory Statistics Classroom,” PRIMUS, 25, 683–693, DOI: 10.1080/10511970.2015.1045574.
- Kuiper, S. R., Carver, R. H., Posner, M. A., and Everson, M. G. (2015), “Four Perspectives on Flipping the Statistics Classroom: Changing Pedagogy to Enhance Student-Centered Learning,” PRIMUS, 25, 655–682, DOI: 10.1080/10511970.2015.1045573.
- Låg, T., and Saele, R. G. (2019), “Does the Flipped Classroom Improve Student Learning and Satisfaction? A Systematic Review and Meta-Analysis,” AERA Open, 5, 233285841987048. DOI: 10.1177/2332858419870489.
- Lape, N. K., Levy, R., Yong, D. H., Haushalter, K. A., Eddy, R., and Hankel, N. (2014), “Probing the Inverted Classroom: A Controlled Study of Teaching and Learning Outcomes in Undergraduate Engineering and Mathematics,” in Proceedings of 121st ASEE Annual Conference & Exhibition: 360 Degrees of Engineering Education, Indianapolis (Paper ID #9475), Washington, DC: American Society for Engineering Education.
- *Maldonado, A. D., and Morales, M. (2019), “Modelling Dependency Structures Produced by the Introduction of a Flipped Classroom,” Mathematics, 8, 19–13, DOI: 10.3390/math8010019.
- Moher, D., Liberati, A., Tetzlaff, J., Altman, D. G, and PRISMA Group (2009), “Preferred Reporting Items for Systematic Reviews and Meta-Analyses: The PRISMA Statement,” PLOS ONE, 6, 1–6, DOI: 10.1371/journal.pmed.1000097.
- *Nielsen, P. L., Bean, N. W., and Larsen, R. A. (2018), “The Impact of a Flipped Classroom Model of Learning on a Large Undergraduate Statistics Class,” Statistics Education Research Journal, 17, 121–140.
- Niemi, H. (2002), “Active Learning—A Cultural Change Needed in Teacher Education and Schools,” Teaching and Teacher Education, 18, 763–780, DOI: 10.1016/S0742-051X(02)00042-2.
- Onwuegbuzie, A. J., and Wilson, V. A. (2003), “Statistics Anxiety: Nature, Etiology, Antecedents, Effects, and Treatments—A Comprehensive Review of the Literature,” Teaching in Higher Education, 8, 195–209, 52447. DOI: 10.1080/13562510320000.
- *Peterson, D. J. (2016), “The Flipped Classroom Improves Student Achievement and Course Satisfaction in a Statistics Course: A Quasi-Experimental Study,” Teaching of Psychology, 43, 10–15, DOI: 10.1177/00986283156200637.
- R Core Team (2017), R: A Language and Environment for Statistical Computing, Vienna, Austria: R Foundation for Statistical Computing, available at https://www.R-project.org/.
- *Reyneke, F., Fletcher, L., and Harding, A. (2018), “The Effect of Technology-Based Interventions on the Performance of First Year University Statistics Students,” African Journal of Research in Mathematics, Science and Technology Education, 22, 231–242, DOI: 10.1080/18117295.2018.1477557.
- Riley, R. D., Higgins, J. P., and Deeks, J. J. (2011), “Interpretation of Random Effects Meta-Analyses,” British Medical Journal, 342, d549,DOI: 10.1136/bmj.d549.
- Rosenthal, R., and Fode, K. L. (2007), “The Effect of Experimenter Bias on the Performance of the Albino Rat,” Behavioral Science, 8, 183–189, DOI: 10.1002/bs.3830080302.
- Shi, L., and Lin, L. (2019), “The Trim-and-Fill Method for Publication Bias: Practical Guidelines and Recommendations Based on a Large Database of Meta-Analyses,” Medicine, 98, e15987, DOI: 10.1097/MD.00000000000015987.
- *Shinaberger, L. (2017), “Components of a Flipped Classroom Influencing Student Success in an Undergraduate Business Statistics Course,” Journal of Statistics Education, 25, 122–130, DOI: 10.1080/10691898.2017.1381056.
- Slootmaeckers, K., Kerremans, B., and Adriaensen, J. (2014), “Too Afraid to Learn: Attitudes Towards Statistics as a Barrier to Learning Statistics and to Acquiring Quantitative Skills,” Politics, 34, 191–200, DOI: 10.1111/1467-9256.12042.
- Terrin, N., Schmid, C. H., Lau, J., and Olkin, I. (2003), “Adjusting for Publication Bias in the Presence of Heterogeneity,” Statistics in Medicine, 22, 2113–2126, DOI: 10.1002/sim.1461.
- van Alten, D. C. D., Phielix, C., Janssen, J., and Kester, L. (2019), “Effects of Flipping the Classroom on Learning Outcomes and Satisfaction: A Meta-Analysis,” Educational Research Review, 28, 100281, DOI: 10.1016/j.edurev.2019.05.003.
- Vaughan, M. (2014), “Flipping the Learning: An Investigation Into the Use of the Flipped Classroom Model in an Introductory Teaching Course,” Education Research and Perspectives, 41, 25–41.
- Stone, B. B. (2012), “Flip Your Classroom to Increase Active Learning and Student Engagement,” in Proceedings From 28th Annual Conference on Distance Teaching & Learning, Madison, WI, USA.
- Strayer, J. F. (2012), “How Learning in an Inverted Classroom Influences Cooperation, Innovation and Task Orientation,” Learning Environments Research, 15, 171–193, DOI: 10.1007/s10984-012-9108-4.
- Van den Bergh, L., Ros, A., and Beijaard, D. (2014), “Improving Teacher Feedback During Active Learning: Effects of a Professional Development Program,” American Educational Research Journal, 51, 772–809, DOI: 10.3102/0002831214531322.
- van der Meij, H., and Dunkel, P. (2020), “Effects of a Review Video and Practice in Video-Based Statistics Training,” Computers & Education, 143, 103665–103614, DOI: 10.1016/j.compedu.2019.103665.
- Viechtbauer, W. (2010), “Conducting Meta-Analyses in R With the metafor Package,” Journal of Statistical Software, 36, 1–48, DOI: 10.18637/jss.v036.i03.
- Waples, J. A. (2016), “Building Emotional Rapport With Students in Statistics Courses,” Scholarship of Teaching and Learning in Psychology, 2, 285–293, DOI: 10.1037/stl0000071.
- Williams, M. L., Waldauer, C., and Duggal, V. G. (1992), “Gender Differences in Economic Knowledge: An Extension of the Analysis,” The Journal of Economic Education, 23, 219–231, DOI: 10.1080/00220485.1992.10844756.
- *Wilson, S. G. (2013), “The Flipped Class: A Method to Address the Challenges of an Undergraduate Statistics Course,” Teaching of Psychology, 40, 193–199, DOI: 10.1177/0098628313487461.
- Winquist, J. R., and Carlson, K. A. (2014), “Flipped Statistics Class Results: Better Performance Than Lecture Over One Year Later,” Journal of Statistics Education, 22, 1–10, DOI: 10.1080/10691898.2014.11889717.