
Allan Rossman (AR): As part of the special cluster of articles about teaching Bayesian statistics, JSE editor Jeff Witmer asked me to organize and moderate a panel discussion with a goal of providing information and advice about teaching a course in Bayesian statistics for undergraduates. I am delighted that these panelists agreed to participate:
Alicia Johnson, from the Department of Mathematics, Statistics, and Computer Science at Macalester College in Minnesota;
Colin Rundel, from the Department of Statistical Science at Duke University in North Carolina and the School of Mathematics at University of Edinburgh in Scotland;
Jingchen (Monika) Hu, from the Department of Mathematics and Statistics at Vassar College in New York; and
Kevin Ross, from the Department of Statistics at Cal Poly—San Luis Obispo in California
I will ask these panelists a series of questions, and then I will give them a chance to ask questions of each other.
First, please tell us about the students who take your undergraduate course in Bayesian statistics: Who are they (primary fields of study, typical class years, etc.)? Why do they take this course? What pre-requisite knowledge and skills do they bring, in statistics or mathematics or computing or whatever else? How many students is a typical class size?
Alicia Johnson (AJ): The Bayesian Statistics course I offer at Macalester College is an upper level “capstone” course. With probability and multivariate statistical modeling as prerequisites, students enter this course with strong foundations in statistical theory, application, and computing in R. Each major in our department is required to take at least one such capstone course. These are uniformly small (∼16 students) and driven by substantial course projects. The students that drift toward Bayes tend to be our junior and senior majors in Applied Mathematics & Statistics that are interested in advanced applications. That said, there’s been increasing interest among majors outside our department, inspired by the exploration of Bayesian methodology among colleagues in other fields.
Colin Rundel (CR): The Spatiotemporal Modeling course (Sta 444) that I taught at Duke was offered as a 4th year elective course to undergraduate statistics students. Given the focus on Bayesian statistics within this department, this is actually a second Bayesian course for these students, as they are required to have previously taken an introductory Bayesian theory and methods course (Sta 360) in their 3rd year. Given this requirement, and the 2nd order requirements, this course is practically only available to students pursuing a full Statistics major. Generally, the class size was roughly 10–20 undergraduates per semester; these students were co-taught with 10–20 2nd year MS students from the Master’s of Statistical Science program and finally a couple of MS and PhD students from other programs. Students enrolled in the course primarily expressed interest in obtaining more applied modeling experience, with a small handful having specific interests in spatial and time series modeling. We relied heavily on all of the students having a basic familiarity with Bayesian methods (e.g., MCMC, Gibbs samplers, posterior predictive distributions, etc.) and computational methods with R.
Jingchen Hu (JH): At Vassar College, Bayesian Statistics is an upper-level statistics course. Students are primarily majors of our department of Mathematics and Statistics, and a good number of them are double majors of Economics or Computer Science. We also have a number of Cognitive Science majors enrolled in the course, thanks to an applied Bayesian cognitive science colleague on campus. When the course was first offered about four years ago, we only had juniors and seniors; nowadays, we increasingly have sophomores in the class as well. Besides Statistical Inference, Bayesian Statistics has been the only other upper-level statistics course at Vassar until this academic year (with a new hire, a new Statistical Principles for Research Study Design has been introduced). Therefore, many students take Bayesian Statistics to fulfill their major or minor requirements. The Cognitive Science cluster is an interesting group: Many of them have taken an upper-level Cognitive Science course titled Modeling Minds, Brains, and Behavior, and they go on to take Bayesian Statistics to enhance their understanding of the Bayesian paradigm with applications to fields other than cognitive science. Every enrolled student needs to have taken multivariable calculus, linear algebra, and probability. Due to our limited statistics offerings in the department, no prior statistics experience is required. No prior R experience is required either. Class sizes are typically around 20 students.
Kevin Ross (KR): This will be the fourth year that Bayesian Reasoning and Methods (STAT 415) will be offered at Cal Poly. Cal Poly is on the quarter system, so the course is ten weeks long. About 20–25 students have taken the class each year. A large majority of students have been Statistics majors, with a few students from Mathematics, Economics, Engineering, and Marine Sciences. Most of the students have been juniors or seniors, though there have been a few sophomores and Master’s students. The course is not required by any academic program. The most common reason students take the class seems to be that they have heard “Bayesian statistics” mentioned, somewhat mysteriously, in other contexts, and they’re curious to learn more.
The prerequisites include a second course in statistics and a first course in probability, as well as single-variable calculus and computer programming. A majority of students have taken several previous statistics courses. No prior experience with R or any other software is required, but most students are familiar with R.
AR: This is the first of two questions about course goals. Please complete this sentence, and then write a paragraph to explain or justify your answer: The single most important idea that I want students to emerge from the course with a thorough understanding of is … (Be aware that the next question is very similar but about a skill rather than an idea, so please do not answer that follow-up question yet.)
CR: The single most important idea that I want students to emerge from the course with a thorough understanding of is what to do when modeling data where the observations are not independent and identically distributed. I think this is a fundamental unifying aspect of both spatial and time series modeling, and both areas provide a very useful and approachable gateway into the complex realm of data in the real world. Generally, when teaching modeling, and many other topics, there is a tendency to teach a particular approach because the theory is straightforward and all the math works out nicely. Unfortunately, this often provides students with a limited and biased view of the modeling process. In this course, we directly engage with data where the i.i.d. assumption is not met and then explore what happens when using more or less appropriate modeling methods.
JH: The single most important idea that I want students to emerge from the course with a thorough understanding of is that posterior inference is no black box. Especially in relatively simple settings, we can analytically see that the posterior is a combination of the prior and the data. With an entire semester devoted only to Bayes, I am lucky to have time to analyze relatively simple models, both analytically and computationally when possible. For one-parameter conjugate models such as beta-binomial, gamma-Poisson, and normal–normal, it is always a good algebra exercise to recognize that the posterior mean of the parameter is a weighted average of its prior mean and the data sample mean. Posterior variance is more challenging to demonstrate analytically, but visualizing the prior and posterior distributions in the same graph reveals how the data have sharpened our knowledge about the parameter from prior to posterior. These exercises deepen the students’ understanding of updating uncertainty from prior to posterior. Later, with more advanced models where such a breakdown is less obvious or sometimes impossible to observe, students can still appreciate how the prior and the data contribute to the posterior. This then opens opportunities for discussions on prior choices.
KR: Let me preface my response by saying that while our Bayesian course has statistics as a prerequisite, as well as calculus and probability, in many ways I approach the class as if it were a Bayesian version of algebra-based introductory statistics. Thus, many of my goals for the Bayesian course are the same as for my introductory courses.
The single most important idea that I want students to emerge from the course with a thorough understanding of is the role that uncertainty or variability plays in making valid conclusions based on data. For a more Bayesian specific response: The single most important idea that I want students to emerge from the course with a thorough understanding of is that “posterior is proportional to likelihood times prior.”
I want students to understand that the Bayesian paradigm provides a natural and unified framework for quantifying uncertainty about models and parameters based on observed data. Like Monika, I include many examples illustrating the process of moving from prior and likelihood to posterior, and the relative influence of prior and data. While students often tend to focus on the prior, they should also understand the fundamental role that likelihood plays. In any statistics class, Bayesian or frequentist, students should develop a thorough understanding of sample-to-sample variability of statistics, and why that matters. In Bayesian classes, students should develop a thorough understanding of what it means to quantify and interpret uncertainty about parameters and models with probability distributions.
AJ: The single most important idea that I want students to emerge from the course with a thorough understanding of is that there is no singularly “best” way to analyze data. At the top level, the Bayesian and frequentist philosophies offer two different approaches to an analysis—neither always being “best.” Getting into the details, there’s no “best” way to tune a prior, build a model, communicate our results, and so on. This is a common theme throughout all of the courses I teach, and Bayes is no different. Though students can be comforted by recipes or rules for performing an analysis (which I certainly understand), I emphasize and re-emphasize the importance of developing a set of foundational principles that can help guide our work.
AR: Complete this sentence, and then write a paragraph to explain or justify your answer: The single most important skill that I want students to leave the course with the ability to perform is …
CR: … to be able to examine a novel dataset and understand how they might construct an appropriate model, fit that model, and then evaluate its performance. As described previously, the primary learning goal of my course is to teach students approaches for modeling spatial and time series data, and I want to approach that in the least dogmatic way possible. Specifically, I want to introduce models as concepts that are distinct from the methods used to fit and evaluate them (e.g., frequentist vs. Bayesian approaches). For either approach there are both costs and benefits that can only really be evaluated in the context of the specific research question(s) and data. As such, when discussing the details of fitting and evaluating a new model, I attempt to show multiple approaches and tools whenever possible.
JH: … to be able to come up with appropriate models in new settings, and then use JAGS for correct implementation. After two-thirds of the semester, students have been exposed to a good collection of basic Bayesian models. Moreover, with introduction to and practice with JAGS, students gradually master ways of expressing their model using the JAGS syntax, which, when written correctly, reflects their understanding of the model itself. With such a foundation, I want my students to acquire the skill of designing suitable models when new analysis problems arise: How does data arise? What sampling model to use? What about prior choices? What assumptions are we making, and are they reasonable? Once these questions are explored and answered, students can proceed to correctly implement their chosen model(s) with JAGS. Unlike Colin’s second Bayesian course, in a first (and most likely the only) Bayesian course we are not able to cover much of advanced performance evaluation methods, so we focus on posterior predictive checking tools, which usually suffice for our purposes.
KR: I agree with Colin’s and Monika’s responses. Taking their ideas broader, the single most important skill that I want students to leave the course with the ability to perform is to draw valid conclusions from data. Whether the course is Bayesian or frequentist, students should have a solid understanding of the entire statistical investigation process, not just conducting the data analysis step of that process. In particular, students should have the ability to interpret and communicate the results of statistical analyses. In Bayesian classes, students should develop the ability to quantify and interpret uncertainty about parameters and models with probability distributions. Students should also be able to communicate the results of a Bayesian analysis in the context of the research question.
AJ: Similar to Colin, the single most important skill that I want students to leave the course with is the ability to complete an analysis in novel settings, from building models to communicating their work. Drawing upon my response to the previous question, I want students to feel empowered to apply guiding principles (not rules) to their work. Consider just model building. Even at the end of the course, after students have seen a lot of different models, we spend time building each new model one step at a time—even when it might seem unnecessary to do so. For example, this process might unfold through identifying the structure of our response variable Y, identifying candidate models for studying Y, trying these models without any predictors, then including predictors, and so on.
AR: What textbook or other course materials do you use? What do you regard as the most important feature(s) of the textbook or course materials?
JH: When I first started teaching the upper-level course on Bayesian statistics at Vassar, I used A First Course in Bayesian Statistical Methods by Hoff, which is a popular choice for graduate-level courses and the one I used as a graduate student. The level turns out to be (not surprisingly) a bit too advanced for undergraduate students, especially that it relies on self-written MCMC scripts for computation of all models introduced in the book, from simple one-parameter models to more advanced ones such as probit regression. I therefore supplemented with materials from several “lower-level” textbooks, including Bayesian Cognitive Modeling by Lee and Wagenmaker, and Doing Bayesian Data Analysis by Kruschke. My students and I enjoy the use of graphical representations of Bayesian models in these books, the use of MCMC software such as JAGS, BUGS, and Stan, and the focus on applications. However, they lack the level of mathematical rigor that I would love to have my students in an upper-level course experience and master, which is a clear emphasis of Hoff’s book.
Since my second time teaching the course, I started working with Jim Albert on an undergraduate-level Bayesian statistics textbook, and in 2019 CRC Press published our Probability and Bayesian Modeling. In this book, we use simple one-parameter models to instill Bayesian thinking and computational approaches. Then we gradually move to JAGS for computation with more advanced models, so we are able to cover a broad collection of Bayesian models without much computational requirement for the students. Throughout, we bring in applications from different fields, and we have a final chapter on case studies. We try to strike a balance of inference, computation, and applications in the book. This balance is the most important feature I seek in textbooks and course materials for an undergraduate Bayesian course.
KR: I tend not to require textbooks and use my own notes and problems instead. (I’m trying to cobble my materials together into a Bookdown.) I do like the Kruschke book and have recommended it to students, but it doesn’t quite fit my course objectives. Another good undergraduate book that doesn’t quite fit my course is Think Bayes by Allen B. Downey. Monika’s book with Jim Albert is great, and I’m considering using it the next time I teach. I think Alicia and Colin also have book projects in the works, and I’ll be excited to see those.
Most of the Bayesian textbooks I’m familiar with tend to be on the technical side. I find that they often don’t have enough real-data contextual examples and don’t focus enough on the big picture of drawing conclusions from data. My ideal undergraduate Bayesian textbook would look a lot less like a calculus or theoretical statistics book and a lot more like an introductory statistics textbook. My ideal textbook would include plenty of examples using real contexts and datasets, graphs, discussion of key concepts rather than computations, examples of code with instructions, and discussion of how to interpret and communicate results.
AJ: It’s true! I’m collaborating with Mine Dogucu and Miles Ott on a Bayesian book that will be published by CRC Press along with an open access version. It’s not a coincidence that several of us have recent Bayesian book projects—there are just too few resources tailored to the undergraduate level. Throughout the years, I’ve supplemented my own activities with readings cobbled together from Kruschke’s text and also Richard McElreath’s Statistical Rethinking book. Though both are excellent, neither addresses undergraduates as their primary audience.
I’m excited that there’s a new batch of Bayesian resources available and forthcoming. Kevin wrote a good description for the book that Miles, Mine, and I hope to add to this landscape. We explore Bayesian thinking and modeling through a modern data science lens with data-driven examples, an emphasis on critical thinking, and “enough” theory so that readers can generalize the material in novel settings. Beneath all of these details, our guiding principle is to provide an accessible and inclusive resource that invites and empowers undergraduates (and comparably trained practitioners) to do Bayesian statistics.
CR: Given that my course is more domain-specific than the others, I’ve used textbooks that are specific to spatial and time series modeling. As mentioned previously, students coming into the course haven taken an introductory Bayesian course, which has traditionally used Hoff’s A First Course in Bayesian Statistical Methods. For my course, there was no single book that covered both spatial and time series topics in a way I was completely happy with, so I offer suggested readings from the following books: Hierarchical Modeling and Analysis for Spatial Data by Banerjee, Carlin, Gelfand; Time Series Analysis and Its Applications by Shumway and Stoffer; and Forecasting: Principles and Practice by Hyndman and Athanasopoulos. Note that only the first of these books is explicitly Bayesian, but all three provide a strong introduction to the underlying theory.
One additional resource that I found myself using regularly were case studies published by the Stan project (https://mc-stan.org/users/documentation/case-studies). These provided detailed discussions of modeling and implementation approaches for a number of the models we were using. As I was not explicitly teaching Stan to my students, borrowing these case studies for my slides and notes often involved translating models from Stan to JAGS, which was usually straightforward but not something I would expect of my students.
AR: What software do you and your students use in the course? What features of the software led you to make this choice?
KR: I use R with JAGS. Most of my students are already familiar with R, so it’s a natural choice. Early in the course I do lots of Bayes table calculations with discrete priors, and the vectorized nature of R makes this really easy.
I use JAGS (in R) for MCMC, though I provide almost all of the code to the students. I’ve considered using Stan, but the learning curve seems a little steep, and students often have trouble with JAGS syntax as it is. I do have my students use ShinyStan, which provides a nice way to visualize and interact with MCMC output, not limited to Stan. I only provide examples and instructions for R and JAGS, but I let my students choose their own software, and a few have chosen to use Stan or Python.
I also try to use applets whenever possible, though finding an appropriate applet is not always easy. Are the other panelists aware of some good Bayesian applet collections?
AJ: I use R with Stan. I made this choice for a couple of reasons. First, the supporting rstan, rstanarm, bayesplot, and tidybayes packages have made Stan vastly more accessible, both computationally and conceptually. Second, I’ve observed so many of my Bayesian practitioner friends make this switch. Yet to be clear, “more accessible” does not mean “easy.” For every student in my course, there are roughly as many workarounds to get all of the software up and running. When we can’t find a workaround, I direct students to Ben Goodrich’s rstudio.cloud project, which makes rstan available: https://rstudio.cl_oud/project/56157. I worry very much about software being a barrier to entry. It’s a real thing.
CR: I have used R with JAGS for as much of this course as possible, with a very few exceptions for models with specific implementation or performance considerations. My approach and the reasoning behind it are very much in line with what Kevin has described—I want students to pick up a generalizable tool but with the least additional learning curve. I also want to echo Alicia’s recommendation of the wider ecosystem within R: Packages like tidybayes also work with JAGS output and make working with model output much more accessible to students.
I have explored using stan at multiple times but have not yet made the switch, primarily because of concerns about the increased syntactic overhead and the installation and management difficulties mentioned by Alicia above (although I do believe that the issue with installing rstan on RStudio Cloud has been resolved recently).
Outside of JAGS and Stan, we have also made use of specific packages, for example spbayes for fitting gaussian process models, as they can be orders of magnitude faster for even small models.
JH: Similar to Kevin and Colin, I mainly introduce R and JAGS in the course. I particularly like how descriptive JAGS syntax is of the sampling model and prior choices. Only when students truly understand the sampling model and priors can they write their JAGS code correctly. It has a reasonable learning curve for my students, especially as no prior R experience is required for taking the course.
I have to admit that I have little, but thankfully growing, experience with Stan. The Stan scripts I have been writing for my research projects seem way more complicated than what I envision for an undergraduate course, which is the main reason I have been staying away from Stan. For the course, if I use Stan for its descriptiveness of the sampling model and prior choices, JAGS archives it just as well, if not better. If I use wrapper functions in Stan-based packages, such as rstanarm and brms, students do not get to express their sampling model, which is one of the key skills I would like them to acquire. Don’t get me wrong; I very much like wrapper functions such as stan_glm(), for their clear resemblance to glm() and ease of use. Given Stan’s growing popularity, I am eager to figure out a way to use it in teaching, and I will certainly check out Alicia’s recommendations.
On a related note, I recently worked with a group of former students from my Bayesian Statistics course who wanted to learn Python. They replicated material from the Bayesian course in Python in an independent study. We have had a lot of trouble installing PyJAGS on various machines. I had hoped to teach the course in Python and JAGS next time, but PyJAGS installation issues have been a big hurdle, which is a bit unfortunate. Maybe I could try PyStan. Like Kevin, I let students choose their own software, and some of them have chosen Python for their course projects, especially when available Jupyter Notebooks are out there for implementing advanced machine learning and deep learning methods.
Regarding applets, Jim Albert has developed some ShinyApps for teaching Bayes: https://bayesball.github.io/ProbBayes/Bayes_Shiny_Apps.html. In addition, our ProbBayes package (https://github.com/bayesball/ProbBayes/tree/master/R) includes various functions that could be useful in teaching, including beta.select() to choose a beta prior given quantile statements and random_walk() to perform random walk Metropolis, among others.
AR: How much coding do students do in your course? How much math do they do? Why did you decide on this mix for your student audience and course goals?
AJ: In my years of teaching Bayes, I’ve spent so much time thinking about this question! Maybe too much time. I’ve flip-flopped between doing too much math/too little computing in some semesters, and vice-versa in others. I’ve finally struck what I think is a reasonable balance for my particular audience. During the first quarter of the semester, I focus the course on foundational Bayesian thinking and theory, thus “do” a lot of math. The focus subsequently turns toward advanced Bayesian models, which require MCMC simulation for implementation. Though we necessarily do less “math on paper” and more coding at this point of the semester, we certainly continue to orient our work in statistical theory.
This balance is informed by two main drivers. The first is multivariate thinking. Applied multivariate modeling is a common thread throughout Macalester’s statistics and data science offerings. To align the Bayes course accordingly, I’ve naturally drifted toward having the students do more coding than math on paper. The second driver is the students themselves, the majority of whom are eager for more opportunities to dig into advanced applications.
CR: I agree with Alicia that this is a fundamental question for these courses, and really most statistics courses in general, and this is something I have spent a lot of time pondering. Where I have currently settled is probably around 30–40% math and 60–70% computing, which aligns with my general preferences for statistics courses as a whole. For each topic, I tend to start with the math—writing down some formula or similar justification for a model, and then working through the properties and implications of that model. After this, though, most of the time is then about implementing the model, usually by sharing prewritten JAGS code, which tends to match nicely with the previous math notation, and then using that implementation to analyze some data for the purpose of inference and/or prediction.
This balance is also reflected in the assigned homework, which usually starts with some derivations or similar work and then proceeds to ask the students to fit models and analyze their results.
JH: Like Alicia and Colin, I have spent a lot of time wondering about this question ever since I started teaching Bayes. As I described in an earlier question, I have come a long way to figure out a balance between math-focused methodology and coding-focused computation. My solution is very similar to Alicia’s: We do a lot of math early on and later move on to MCMC implementation through software. I also practice what Colin said: For problems using JAGS, I focus on side-by-side presentation and comparison of the mathematical notation of the model and the JAGS script of the model, another reason why I love using JAGS in teaching.
One natural bridge between the two I’ve found useful is to have one week on material about self-coded Gibbs samplers, at the point where we transition from one-parameter models to multi-parameter models. Between deriving full conditional distributions of model parameters and writing a loop to implement the MCMC estimation, students learn so much about the math and the coding that are involved in the process. Such knowledge and skills go a long way for them in more advanced models, especially when they might not be able to express the rather complex joint posterior distribution and so must rely on software for MCMC estimation instead of self-coded MCMC samplers.
My favorite teaching material along these lines is “Explaining the Gibbs Sampler” by George Casella and Edward George, published in The American Statistician in 1992. This is a concise paper consisting of great discussions about implementing Gibbs samplers with a series of simulations. This is a great learning resource for students. They get to discuss and critique different practices of Gibbs samplers based on a reading guide of several questions I’ve provided, and they get to replicate a simulation study in the paper based on a computing lab I’ve designed. I highly recommend similar approaches to integrate math and coding in a Bayes course, and you get the added “bonus” of reading accessible journal articles in an undergraduate course.
KR: Approaching the course as a Bayesian version of introductory statistics, I try to keep both math and coding light. Early in the course, I use many spreadsheet-like Bayes table calculations to compute posterior distributions, and I use simulation to approximate predictive distributions. I do have students use mathematical notation and work with probability densities. However, I avoid explicit calculus or integration as much as possible, relying instead on ideas like “is proportional to” and “conditioning is slicing and renormalizing.” As Alicia mentioned, multivariable thinking is an important component of the course, but in my opinion multivariable calculus is not.
When we get to MCMC methods, I provide most of the code, so for the most part students only need to make minor edits. I do spend some time covering JAGS programming, but I focus much more heavily on reading and interpreting JAGS output. This is not to say that coding is not an important skill to teach. However, almost all of my students get a healthy dose of coding in other courses. My course is the only place they’ll be exposed to Bayesian concepts, so I give these concepts priority.
AR: Do you contrast Bayesian methods with their frequentist counterparts in the course? Why or why not? If so, how, and to what extent?
CR: Generally, I have shown both Bayesian and frequentist results for most modeling approaches in the course, but the focus is on the former when reporting results. This choice is largely driven by the prevalence of frequentist methods within the R packages we are using to handle the spatial or time series data, for example, the spdep package for areal data and the forecast package for time series. I mostly treat these methods as maximum likelihood based black boxes that are useful for obtaining quick point estimates during exploratory data analysis, but minimal time is spent on fitting methods, uncertainty quantification, etc.
For example, fitting an ARIMA model that involves the choice of the meta-parameters p, d, and q is not something that can be easily implemented with JAGS or Stan. Using forecast’s auto.arima function allows students to quickly examine a number of different models, some smaller subset of which can then be explored in greater detail later using a fully Bayesian model.
JH: I am offering the disappointing response of no, that I do not contrast Bayesian methods with their frequentist counterparts in the course. Due to limited statistics offering in my department, we do not require prior statistics courses to take Bayesian Statistics. If I were to teach a second course on Bayesian Statistics like Colin (that would be really cool!), or an upper-level statistical modeling course where students have seen frequentist GLMs, I would like to contrast Bayesian and frequentist methods using stan_glm() in the rstanarm package and regular glm(). I am also very interested in developing teaching material for Bayesian content in introductory statistics courses.
KR: Yes, I do some contrasting of Bayesian methods with their frequentist counterparts, especially earlier in the course. My students have all had at least two previous statistics courses, so they are well acquainted with frequentist methods. I think it’s important for them to see how Bayesian methods fit within the context of what they have learned in other courses, so I bring in comparable frequentist procedures when appropriate. When comparing the two approaches, I focus on the differences in interpretation, rather than computation. I do think it’s important to emphasize that there is not a “right” or “wrong” way, but rather that a statistician familiar with both frequentist and Bayesian methods has even more tools in their toolbox.
AJ: My approach here is very similar to Kevin’s. Since my students have taken at least one frequentist modeling course, recalling familiar frequentist tools and ideas can provide important framing for new Bayesian tools and ideas. In fact, because so many of the guiding principles behind a Bayesian analysis are shared in a frequentist analysis, I emphasize that much of what they learn in Bayes is transferable to broader settings.
AR: What is the most challenging topic or aspect of the course for students?
CR: The aspect of the course that students have the most difficulty with is synthesizing from the specific details of the various models covered (ARIMA, CAR, GP, etc.) to an understanding of the overarching, connected nature of these models. Specifically, students struggle to realize that they all fundamentally involve multivariate normal distributions with particular mean and covariance structures. This difficulty with seeing the forest for the trees is not unique to this course or our discipline, but is something that I am constantly working on.
JH: In my Bayesian course, we start with simple one-parameter models and then move to relatively simple multi-parameter models, with an emphasis on deriving posterior/full conditional posterior distributions. I found that many students struggle with writing out the joint posterior density and recognizing full conditional posterior distributions. This also happens during in-class midterm exams, where they are given a new model, say the Rasch model (a hierarchical item response model with person-specific and item-specific effects), and many find it challenging to decipher, especially to correctly express the joint posterior density.
Of course, in practice we use JAGS for MCMC estimation for advanced models, which is why it is appealing to use such software for undergraduate Bayesian courses. Still, I would love to see my students being able to analytically express accessible advanced Bayesian models, as such practice deepens and such ability indicates their understanding of these models. I think more practice and exposure will help, and I am constantly working on an appropriate amount of analytical derivation of advanced Bayesian models before moving to MCMC estimation using software.
KR: Related to what Monika said, I think the biggest challenge is the big jump from single-parameter to multi-parameter models. Even students with a strong background in probability often have trouble with joint densities, not even the calculus, but just understanding what a joint density is. The fact that these are joint densities on parameters complicates matters. And then we need these fancy MCMC methods?! Unfortunately, I don’t yet have a good solution for how to best bridge the gap from one-parameter models that students seem to handle pretty well to multi-parameter models that they find orders of magnitude harder.
On the bright side, one thing I’ve found not to be a challenge is the handful of students who initially balk at the “subjectivity” of Bayesian statistics and can’t wait to ask “but how do you choose the prior?” When addressing these students, I recommend resisting the urge to overly justify the Bayesian approach. Students find Bayesian reasoning very intuitive and appealing, and they relinquish their initial objections naturally.
AJ: The skill I noted above to be the most important is also one of the most challenging for students: building Bayesian models in novel settings. Similar to Colin, I work really hard to establish and emphasize their shared foundations and the importance of critical thinking in model building. Either because we train them to do so or because it’s simply more comfortable, students often want to memorize a set of rules that will identify the “best” model for a given situation. And they often mistake what’s complicated for what’s “best.” Recognizing my own contributions to this thinking, I’ve built in more time and space to practice model building. Until we’ve seen a certain modeling technique over and over and over, we build each model from the ground up, one step at a time.
AR: How do you assess student learning in the course? Please provide an example of one particular assessment item, such as a project assignment or exam question, and describe why you think this is an effective assessment.
JH: The course I teach at Vassar has 25% for homework and computing labs, 40% for two midterm exams, 10% for participation, and 25% for a final project. The 10% participation is graded for completion and includes various components: completion of assigned DataCamp modules, paper discussion questions on LMS, and open-ended case studies.
I particularly like the use of case studies, which are assigned in pairs in the second half of the semester. This occurs after students have learned several useful Bayesian models, so they can start working on open-ended applications. I also like more-than-one round of case studies on the same application when possible, so that we can explore different approaches. For example, in one case study, we look at true-or-false test scores from a number of test takers. Exploratory data analysis suggests two groups of test takers: a knowledgeable group earning about 80% of the points, and a guessing group earning about 50% of the points. Given their prior experience, students would usually analyze this data with a hierarchical approach, where the group assignment of each test taker needs to be predetermined. After this first round of analysis and discussion, I point out one drawback of the hierarchical approach: Some test takers with scores in the 60% to 70% range could be either in the knowledgeable group or the guessing group, and students come to see that a more flexible approach is to assume the group assignment is unknown and random. Next, I introduce the latent-class modeling approach, which is rather advanced for undergraduate students. To my great delight, with a clear context, strong motivation, and sample JAGS scripts, students grasp the core idea and are able to take on a brand new approach to a familiar research question. I believe well-designed case studies are a very effective assessment of student learning and problem solving skills.
KR: So far I’ve used a fairly standard mix of exams, homework, daily low-stakes quizzes, and a final project. The project instructions have been essentially “do something involving Bayesian statistics” and the quality of student work has been highly variable. I plan to design a better project assignment and make it a bigger component of course assessment. I also think I’ll try Monika’s case study assessments!
Here is one example of a type of question I like to ask. Suppose we wish to estimate θ, the proportion of Cal Poly students whose birthday is in September. Assume a Beta(α, β) prior distribution for θ. From among the following, choose the values of α and β that represent the strongest prior belief that birthdays are uniformly distributed throughout the calendar year, and explain your reasoning. The choices for each are: 0, 1/12, 30/365, 1, 11, 12, 30, 335, 365.
The example above concerns prior beliefs, but it’s really assessing the ability to quantify uncertainty about parameters. Students need to reflect on the context and then choose values that correspond to both an appropriate mean and variance. This particular question concerns Beta distributions, but I ask many similar questions to assess more broadly the ability to represent uncertainty about parameters with distributions.
AJ: I similarly utilize low-stakes homework assignments and a culminating project for assessing course learning goals throughout the semester. Beyond digging deeper into Bayesian statistics, this multi-staged project provides students with an opportunity to practice collaboration, iteration, self-direction, and communication in open-ended settings. Further, with the advantage of having a small class size, I can support each student tailoring these projects to their unique interests and goals: What Bayesian topic do they hope to learn more about (e.g., methodology, applications, computation)? Who is the audience for this work (e.g., the broader public, a future employer, their friends)? What other skills would they like to practice along the way (e.g., data wrangling, writing, interactive apps, etc.)? For some, this means exploring and building upon a theoretical topic and communicating their work in the style of a journal article. For others, it means conducting a rigorous data analysis on a topic of interest and communicating their work in the style of a popular blog post. For yet others, it means creating a public portfolio of their work, perhaps including examples from other courses or experiences.
CR: The most recent iteration of the course had settled on 50% homework (4 assignments), 30% exams (2 in-class exams), and 20% final group project. This was tweaked from earlier versions of the course that did not have the exams and so up-weighted the homework and project. I implemented this change because I had begun to feel that the theory component of the course was under-assessed, and I wanted to provide students with more motivation to engage with that aspect of the material.
Of all of the assessments, I think the project is perhaps the most valuable. Students are asked to form their own teams, find a dataset, and attempt to answer an interesting question using those data. I keep this as open-ended as possible, and I have found that allowing students to engage with problems they are genuinely interested in produces better work. With that said, the projects are not always successful, often through no fault of students, as there are underlying issues or complexities with the data or the methods being used. Because of this, I am interested in exploring the use of case studies, similar to what Monica has described above, using multiple revision iterations.
AR: This will be my most specific question, and it requires some background: I’ve become convinced that one of the most challenging topics for students in a typical (not Bayesian) introductory course is the idea of a parameter. One manifestation of this difficulty is that many students interpret a confidence interval for a population mean as a prediction interval for a particular value. It seems to me that this difficulty becomes even more pronounced in a Bayesian setting. How can students understand using a probability distribution to represent uncertainty about a parameter, if they aren’t very clear about what a parameter is in the first place? That question was rhetorical. My multi-part question for you is: Do you find this to be much of an issue? If so, how do you address it? Do you discuss prediction from a Bayesian perspective, perhaps in part to help to distinguish a prediction from a parameter?
JH: In my Bayesian course, I have not found this to be much of an issue, though it is likely because ours is a full-semester upper-level Bayesian course and we have the luxury to explore various models and compare prior and posterior densities of model parameters. All these help to instill the uncertainty representation of parameters in students. Moreover, they lead to the more natural interpretation of a Bayesian credible interval of parameters from their posterior densities, which usually goes well with students’ understanding, regardless of their prior statistics background. Thanks to students’ gained familiarity of Monte Carlo simulations of conjugate models and MCMC estimation of more advanced models, posterior predictive is a natural follow-up step from posterior inference. Students can then have posterior summaries of parameters and posterior predictions of the data, which greatly helps with the distinction. Or rather I should say, I have not found much of a confusion among students about posterior and posterior predictive, after they have seen it in multiple contexts. I am curious to hear my fellow panelists’ experience, as I can clearly see the challenges in an introductory-level Bayesian course and/or where Bayesian methods and frequentist counterparts are presented and discussed.
KR: I have not found this to be an issue either; at least it’s not any more of an issue in my Bayesian class than it is in introductory classes. I suspect that if the Bayesian interpretation of credible intervals were presented in introductory courses, then there would be even less confusion between interval estimates of parameters and prediction intervals. Prediction is an interesting and important topic that is very natural to cover from a Bayesian perspective, so I do cover it in my class, and I do emphasize the difference between prediction intervals and credible intervals.
CR: I have found this to be an issue with other statistics courses that I have taught, but much less so in my Bayesian course. At some level, I think the fundamental difficulty for many students is coming to terms with and understanding the concept of a random variable. This is something that most students have minimal contact with in their previous mathematical training, and it takes time and repeated exposure to develop a mature understanding. In an introductory course, there is never enough time to cover everything we might want, and so I understand why many students have difficulty seeing the bigger picture with regard to the parameters and the inference models presented. This is exacerbated by null-value hypothesis testing, since so much time is spent flipping back and forth between the mathematical hypothesis, the interpretations, and the underlying parameters and distribution theory. I think students’ understanding is improved somewhat by taking a more modeling-based approach, since I think this makes the parameters more central to the process. Finally, I agree with what Monika has said about Bayesian methods providing a more natural and consistent way of thinking about parameters and predictions. Once the students are able to make draws from the posterior distributions of a parameter, asking them to extend this process to making posterior predictive draws is entirely natural.
AR: I just realized that this interview has been entirely text. Now I ask that you show me a picture! Please present a graph, or a series of a few graphs, that encapsulates what your Bayesian course is all about. Pretend that you are using this graph to convince a prospective student to take your course. Go ahead and use some text to describe the context and what the graph reveals.
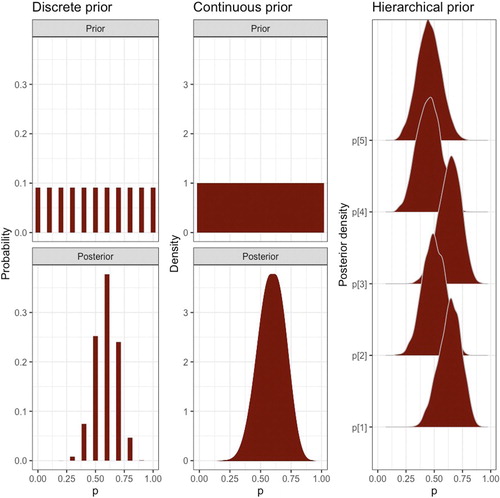
JH: My series of three graphs () encapsulates the process of choosing a prior and making posterior inference of data on counts of successes in a fixed number of trials: a discrete prior for a single observation, a continuous prior for a single observation, and a hierarchical prior for multiple observations (from left to right). These graphs reveal and highlight the flexibility and power of using a continuous prior, and especially, a hierarchical prior to pool information across observations for parameter estimation, representing key concepts covered in my Bayes course.
Fig. 1 Bayesian process (Monika Hu).
AJ: Though this xkcd cartoon (https://xkcd.com/1132/) certainly doesn’t encapsulate what my course is about beyond day one, I do think it’s effective at drawing in prospective students. This cartoon very simply points out three things: (1) the frequentist tools you learned in introductory statistics can have limitations in some settings; but (2) you’re in luck—there’s another (Bayesian) philosophy you might not have heard of yet; and (3) this philosophy can take into account our prior understanding of the world around us.
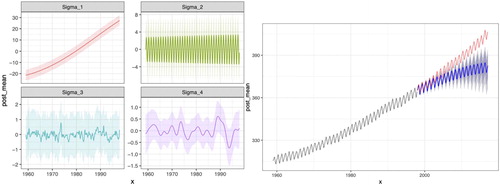
CR: The plots I’ve included below () are the result of fitting a Gaussian process model to the atmospheric CO2 data from Mauna Kea. The different Sigma plots show the trend captured by different components of the covariance model: the increasing trend, the yearly periodic trend, and then shorter and longer term uncertainties. I like this example for a number of reasons, the first is that it is a complex but still mostly interpretable model. Each of the components has a natural interpretation that can be checked against the students’ intuition. Second, this is a challenging model to fit, but it can still be expressed in about 20 lines of JAGS code and multiple chains fit in less than an hour. Finally, I like that fundamentally the model does not do a great job of forecasting the holdout data (in red) and is actually out-performed by a seasonal ARIMA model. This gives a good opportunity to discuss the various limitations of this and other modeling approaches and more generally discussing why more “complicated” or “advanced” methods are not necessarily better.
Fig. 2 Modeling CO2 data (Colin Rundel).
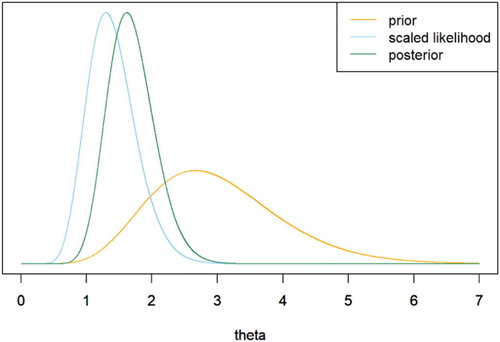
KR: My graph () is not original, and I don’t know if it would convince a student to take the course. But to encapsulate what the course is about in terms of the single most important idea, I’ll go with a “posterior is proportional to likelihood times prior” graph.
Prospective student: Meh, just looks like some probability distributions.
Me: But look at the horizontal axis! These are probability distributions on values of the parameter!
Prospective student: But wait, isn’t a parameter just a fixed number? How can it have a probability distribution? And why are there three curves?
Me: Well, you see…
Fig. 3 Bayesian process (Kevin Ross).
AR: At the outset I promised you a chance to ask questions of each other. I also want to give you an opportunity to say anything about teaching Bayesian statistics to undergraduates that did not fit as a response to any of my questions.
JH: I am curious to hear from my fellow panelists on: What is your favorite Bayes topic to teach? At what tipping point do you think your students achieve your required level of understanding of Bayes? If your students work on a project as part of the course, do you observe commonly shared interests of topics and applications; if so, what are they?
KR: I really enjoy teaching Bayesian statistics, but I don’t think I have a favorite topic. I do especially like how a Bayesian class gives students a new perspective on statistics, rather than simply being the next in line in a sequence of methods classes.
I’ve been pleased that students seem to pick up on the big picture of the Bayesian paradigm fairly early in the course, though the devil can be in the details (especially in multi-parameter models).
For my student projects, the most common application area has been sports, though there has been a lot of variability.
I’ll venture a broad question: Looking however far into the future as you’d like, what will/should be the place of Bayesian statistics in the undergraduate statistics curriculum? If that’s too broad, how about: Looking however far into the future as you’d like, what will/should be the place of Bayesian statistics in the future version of Stat 101?
CR: I don’t think that I can easily pick a topic that is my favorite—I generally very much enjoy the variety of different topics and models that I am able to cover in my course and the flexibility that gives me to dive into theory, application, and/or computation as necessary. If I truly had to pick, I would probably go with Gaussian processes, as these are near and dear to me as they were the focus of my dissertation and postdoc.
There tends to be a bit of heterogeneity within the students. Some fully get Bayes from day one, while others struggle until the end of the course. Generally, I see the biggest change occurs when they work on their final projects, because at this point they are having to find data, think up a modeling scheme, and then implement it. All of this tends to make a significant difference for many of the students, as it is the first time they have to engage with all of this at the same time.
There is a large amount of variability. The projects have mostly been split 50-50 between spatial and temporal data. Beyond that choice, sports is probably the most common choice, based both on student interest but also data availability, but this still only accounts for maybe 20% of the projects.
To Kevin’s questions, integrating Bayes into Stats 101 is hard, and I am genuinely impressed with the work that is being done in this area. I certainly think that we can add more Bayesian thinking into these courses, but I also think that there is some dependence on the students having sufficient exposure to probability theory and programming to get the most out of some of these topics. With that said, I do not want to promote a situation where students interested in statistics are told to go take two semesters of calculus and one of probability before they can take their first statistics course. Given those difficult constraints, I think the more students see Bayesian thinking and methods the earlier in their academic career, the better.
AJ: I love exploring MCMC with my students! They feel empowered by discovering and implementing the intuitive principles behind what at first seems to be a magical black box.
The tipping point is when students can skillfully translate within and between the words (context), mathematical notation, and computational syntax for a Bayesian model.
Project topics vary from year to year, but current events are always a popular driver.
To Kevin’s question: Hmmm, my perspective is shaped in part by Macalester’s “Stat 101,” which covers statistical thinking through a multivariate modeling lens. Our students build, interpret, and perform inference for multivariate regression models, but don’t dive into the linear algebra, calculus, or probability theory behind this work. Thus, once Bayesian software is more broadly accessible, I can imagine how Stat 101 could be refocused through a Bayesian lens without having to dive into theory, MCMC, or tuning priors (using default weakly informative priors instead).
AR: Final question: What advice do you offer for those preparing to teach an undergraduate course in Bayesian statistics for the first time? Please phrase your advice as either “No matter what, make sure that you …” or else “no matter what, make sure that you do not …”
KR: No matter what, make sure that you remember that Bayesian statistics is statistics, so many of the same best practices that you use in other classes still apply. In particular, focus on conceptual understanding rather than calculus and computation. We do a fine job teaching multiple regression to students who don’t know linear algebra. We can do just as well teaching Bayesian statistics to students who don’t know multivariable calculus. Focus on simple examples—one-parameter models, discrete priors—to illustrate concepts. Let software handle computations in more complicated situations, and instead teach your students how to evaluate models, interpret results, and make appropriate conclusions.
AJ: Yes! Taking Kevin’s response in a more general direction: No matter what, make sure that you design and deliver your course with an eye on inclusivity within and beyond the classroom. The Bayesian community is simply too narrow, in part because Bayes is so rarely incorporated at the undergraduate level (who is being invited in?). We can start addressing this by what we teach. To this end, Kevin’s recommendations provide an excellent roadmap for building an accessible, empowering Bayes course. Of course, it also matters how we teach: What language and examples do we use? Whose work are we citing? What experiences are we assuming that students are bringing into the classroom? Who are we bringing into our conversations about Bayesian teaching? To the last of these, a huge thanks to Monika Hu, who tirelessly brings others together around Bayesian education as well as to Allan Rossman for inviting us to learn from one another throughout this discussion.
CR: I agree 100% with the answers given above by Kevin and Alicia, and I think their advice is applicable to any statistics course regardless of methodology. For my contribution, no matter what, make sure that you avoid indoctrinating your students to one side of the Bayesian vs. frequentist debate. It is easier to make black-and-white statements like “p-values are terrible,” and to have students then parrot those statements back, than it is to discuss the underlying issues and what viable alternatives might look like. In particular, taking a positive approach to teaching methods that include explicit discussions around advantages and disadvantages and the implications these have for any conclusions drawn will produce better statisticians and scientists.
JH: I wholeheartedly agree with Kevin, Alicia, and Colin! While the Bayesian education community might seem narrow at present, I hope our answers to these panel discussion questions have shown much great work in Bayesian education at the undergraduate level, and we all hope things continue to grow and include more voices, perspectives, and contributions. Most recently, there was a JSM invited session on Advancing Bayesian Education for Undergraduates, and we have posted the presentation collection and online Q&As here: https://github.com/monika76five/talks/tree/master/JSM2020
For my contribution, no matter what, make sure that you incorporate student projects in your course. Every time I teach Bayes, I am always amazed by the wide range of interests of project topics, and the level of sophistication of project outcomes. Some naturally grow into semester-long or year-long independent studies in later semesters. All of these make me realize that students are most motivated by their own interests, and we as statistics and data science educators should teach them tools and give them space to explore. Whether it is a student with no statistics background, or someone has taken all available statistics courses, a course project in a Bayesian course allows them to integrate their prior experience with newly acquired knowledge and skills, to investigate something of importance to them. While I do not contrast Bayesian methods with frequentist counterparts, I have seen many great projects discussing and comparing these two in their applications. Projects also provide the great benefits of close mentoring on the student’s academic success and career development.