 ?Mathematical formulae have been encoded as MathML and are displayed in this HTML version using MathJax in order to improve their display. Uncheck the box to turn MathJax off. This feature requires Javascript. Click on a formula to zoom.
Abstract
We draw on our experiences with mentoring two students to develop a framework for undergraduate research projects with Twitter data. Leveraging backward design principles, we share our learning objectives and rubric for summative assessments. To illustrate the value of Twitter as a data source, we detail methods for collecting and analyzing tweets. We conclude by emphasizing how Twitter text analysis projects enable students to formulate original research questions, collect and analyze data, and communicate findings and their implications. Supplementary materials for this article are available online.
1 Introduction
Twitter has profoundly changed how we communicate. In only 280 characters, users instantly contribute to public conversations on politics, current events, sports, media, and many other topics. Recent development of accessible statistical methods for large-scale text analysis now enable instructors to use tweets as contemporary pedagogical tools in guiding undergraduate research projects. We guided two statistics students in their senior research projects. Both students used tweets to address novel research questions. We share products of their research in supplementarymaterials. Because their data are no longer available, we present as a case study one analysis with tweets from May 2020. We share our data and computer code to encourage others to undertake tweet text analysis research. We also describe methods for creating a collection of tweets.
Some social media data, including tweets from Twitter, is available through website application programming interfaces (APIs). By way of a streaming API, Twitter shares a sample of approximately one percent of all tweets during an API query time period (“Sampled Stream” 2019). Any Twitter user can freely access this 1% sample, whereas access to a larger selection is available to researchers for a fee.
Through our work with tweets, we demonstrate that Twitter data is a rich source of new data science research questions. Box (Citation1976) described a positive feedback loop for the interplay of discipline-specific research and quantitative methods research. The two components, “science” and “statistics” in the language of Box (Citation1976), iteratively fuel research questions in each other. A new statistical method enables new discipline-specific questions to be addressed, while a new scientific question motivates new data science methods. We describe below two data science research questions that mentored students addressed with tweets.
Studies of Twitter conversations have yielded valuable insights into modern culture. Using large collections of tweets, scholars have investigated diverse research questions, including the inference of relationships and social networks among Twitter users (Lin et al. Citation2011); authorship of specific tweets when multiple persons share a single account (Robinson Citation2016); and rhetoric in recruiting political supporters (Wells et al. Citation2016; Pelled et al. Citation2018). Recognizing the potential utility of tweets for data science research and teaching, we created a collection of tweets over time by repeated querying of the Twitter streaming API. We envisioned this collection as a rich resource for data science research projects. This vision grew into two mentored undergraduate student research projects in the 2015–2016 academic year.
In line with recent calls for students to work with real data (Nolan and Temple Lang Citation2010; Carver et al. Citation2016), our collection of tweets has served as a valuable resource in our mentoring of undergraduate data science research. Working with real data allows students to develop proficiency not only in statistical analysis, but also in related data science skills, including data transfer from online sources, data storage, using data from multiple file formats, and communicating findings. Collaboratively asking and addressing novel questions with our collection of tweets gave mentored students opportunities to develop competency in all of these areas.
While our tweet collection enables us to address many possible research questions, the dynamic content of tweets over time particularly piqued our interest. We hypothesized that high-profile social media events would generate a high volume of tweets, and that we would detect social media events through changes in tweet topic content over time. Below we discuss in detail one approach to studying this question. In the sections that follow, we detail our backward design-inspired approach to writing learning objectives, preliminary research mentoring considerations, data science methods for collecting and analyzing tweets, analysis results, and ideas on assessment and advanced topics.
2 Structure of Mentored Research
2.1 Backward Design
Backward design principles guided our planning and informed the writing of learning objectives (Wiggins and McTighe Citation2005). Following Wiggins and McTighe (Citation2005), we began by listing what students, at the end of their thesis research, should be able to do, understand, and know. We then classified each of these items into one of three categories: enduring understanding, important to know and do, and worth being familiar with (Wiggins and McTighe Citation2005) (). While other researchers may categorize these skills differently, our assignments reflect our projects’ priorities. Nearly all of the skills in are transferable. They apply not merely to thesis projects, but also to data science research in general.
Table 1 Classifying project skills
In particular, our project skills reflect elements of “data acumen,” as defined in a report from the U.S.A. National Academies of Sciences, Engineering, and Medicine (NASEM) (Citation2018). For example, our skills “Acquire data from internet sources” and “Develop data science strategies to address a research question” implicitly require a trainee, in the language of the NASEM report (National Academies of Sciences, Engineering, and Medicine Citation2018), to “ingest, clean, and then wrangle data into reliable and useful forms” and to “combine many existing programs or codes into a workflow that will accomplish some important task.” Additionally, we tailored our list of project skills with the assumption that students would work in R. R use is not required for such projects, but it is a convenience for many of our students.
2.2 Learning Objectives
We translated our prioritized list of skills that students should be able to do, understand, and know into learning objectives (). We phrased learning objectives in a manner that enabled their subsequent assessment () with formative and summative strategies. These were our four learning objectives:
Table 2 Rubric for summative assessment of learning objectives.
Write R code to perform text analysis of large volumes of tweets (R Core Team Citation2019).
Communicate results in a written report and poster presentation.
Translate statistical findings into scientific conclusions.
Develop data science strategies to address a scientific research question.
Having decided on four learning objectives for students, we next established mentoring relationships with each student.
2.3 Preliminary Research Mentoring Considerations
We developed research goals with students in a series of brainstorming sessions and discussions. As trainees began their senior research projects, we spoke in detail about both their research interests and goals and their experience with data analysis software. When possible, we encouraged them to incorporate their existing academic interests into their senior research projects.
In our statistics department, most students learn elementary R computing skills through class assignments. Some students, by concentrating in computer science, learn other data analysis software packages, such as Python. Those who do undergraduate statistics research often learn advanced topics in R computing, such as R package assembly, documentation, and testing. Many develop expertise in linux computing and cluster computing, too.
One of our two students had extensive experience in statistical computing. In addition to R computing skills, she also worked in Python and excelled in shell scripting. She first learned Python in computer science courses. Our second student had extensive experience with R from his statistics courses. His background enabled him to write an R package as part of his senior project. To encourage further development of R computing skills in our two students, we guided them toward the free, online books “R for Data Science” (Wickham and Grolemund Citation2016) and “Advanced R” (Wickham Citation2019).
2.4 Student Research Interests and Goals
Our two students had diverse interests, and, initially, they had little experience in articulating research goals. We engaged each in a brainstorming session to clarify their interests and encourage them to think critically about research goals under the time constraints of their academic schedules. We briefly describe the two student projects to give readers a better sense of research possibilities with tweets.
Our first student examined relationships over time between stock market index prices and tweet sentiment. For each day in her 12-month study period, she identified stock market-related tweets with a key word search. With the complete texts of stock market-related tweets for each day, she calculated a daily sentiment score and plotted it over time. Her sentiment score reflected presence of emotion-associated terms (e.g., “happy,” “sad,” “mad,” “scared”) in tweet texts. Days with more net positive emotion words in the collected tweets received a higher (positive) daily sentiment score, while days with more net negative words received a negative daily sentiment score. For her final project, she presented plots over time of her daily sentiment scores and daily closing prices of the Standard and Poor’s 500 index. She also explored time series analysis methods to quantify relationships between index prices and sentiment scores.
Our second student developed social media event detection methods with topic models. He hypothesized that tweet content changes over time, and that we might detect these changes by comparing inferred tweet topics from distinct time periods. To validate his hypothesis, he examined tweet content before, during, and after the National Football League’s Super Bowl game in 2015. He reasoned that because the Super Bowl is widely discussed on Twitter, we might detect Super Bowl-related topics from tweets sent during the game, but that the football-related topics would be short-lived in the continuous Twitter stream. We discovered evidence to support his ideas, and we ultimately presented our findings at international and local research meetings. Below, we share a case study on a different, widely discussed topic that is analyzed using an approach similar to that from the Super Bowl tweets.
2.5 Time Period
Our two statistics students conducted their research projects during the 2015–2016 academic year. We recommend a full academic year for projects of this magnitude, although a summer or one-semester project is possible. Our students presented their findings at the statistics department’s undergraduate poster session near the end of the 2015–2016 academic year (supplementarymaterials). We present below reproducible R code for analyzing data from May 2020. While these are not the same data that our students analyzed in 2015, the methods and code are very similar to that of our second student’s project.
3 Case Study Methods
To illustrate the value of Twitter data and to encourage readers to envision other uses for tweets, we present below a reproducible case study. It is essentially a reproduction of our second student’s project, but at a distinct time period. In it, we aim to detect a social media event by examining tweet topic content over time. We use latent Dirichlet allocation (LDA) models (Blei, Ng, and Jordan Citation2003) to infer topics on three consecutive days centered on Memorial Day 2020. We chose this example case study, instead of the student projects, because of limited data availability for the student projects. Despite this, the case study illustrates the strategy and methods for one student project. Below, we discuss case study design, tweet collection, and tweet structure, before turning to quantitative methods for the case study.
3.1 Case Study Design
We sought to validate our hypothesis that we could detect a social media event by examining tweet topic content at distinct time periods. As a proof of principle of our event detection strategy, we analyzed tweets before, during, and after Memorial Day (May 25, 2020). We fitted LDA models for each of three distinct 5-min periods. The first period began at noon Eastern time on May 24, 2020. Subsequent time periods started 24 and 48 hr later. We defined each time period to be a single collection, or corpus, of tweets.
3.2 Collecting Tweets Over Time
We include here instructions for creating a tweet collection. First, we created a new account on Twitter. With these user credentials, we used the R package rtweet to query the API (Kearney Citation2019). We used the linux crontab software to repeatedly execute R code to submit API queries. Each query lasted 5 min and produced a text file of approximately 130 MB. We timed the API queries so that there was no time lag between queries. We stored tweets resulting from API queries in their native JSON format.
Setting up the query task with crontab is straightforward. On our computer, with Ubuntu 20.04 linux operating system, we opened a terminal and typed crontab -e. This opened a text file containing user-specified tasks. We added the following line to the bottom of the file before saving and closing the text file.
*/5 * * * * R -e 'rtweet::stream_tweets(timeout = (60 * 5), parse = FALSE, file_name = paste0("∼/work/ mentoring/mentoring-framework/data/", lubridate::now(), "-tweets"))'
Readers may need to slightly amend the above line to conform to requirements of their operating system’s software. Readers who use Mac OS may proceed as we did, while those with Windows operating systems may consider using the R package taskscheduleR to schedule API queries via the Windows task scheduler (Wijffels and Belmans Citation2018).
3.3 Querying Twitter API to Get Complete Tweets
Twitter API use agreements forbid users from sharing complete API query results. However, Twitter permits users to share tweet identification numbers. With a tweet identification number, a user may query a Twitter API to obtain complete tweet data. In our experience, this process is incomplete; that is, many tweet identification numbers submitted to the Twitter API return no data. Additionally, some tweet identification numbers return data on the first query, but do not return data on subsequent queries. This complicates our goal of making all analyses computationally reproducible and motivates our decision to share the tweet IDs of those tweets that we actually analyzed (supplementarymaterials). Should a reader wish to reproduce our analysis, we anticipate that she will get complete tweet data for all or most of these tweet identification numbers from the API. We provide R code for this task in the supplementarymaterials.
3.4 Tweet Structure
Tweets are available from the Twitter API as Javascript Object Notation (JSON) objects (“Introducing JSON” 2020). Every tweet consists of multiple key-value pairs. The number of fields per tweet depends on user settings, retweet status, and other factors (“Introduction to Tweet JSON” 2020). The 31 tweet key-value pairs belong to 12 distinct classes (supplementarymaterials). The classes are either vectors—numeric, logical, or character—or arrays assembled from the vector classes.
Below is an example of a tweet in JSON format. { "created_at": "Thu Apr 06 15:24:15 + 0000 2017", "id_str": "850006245121695744", "text": "1\/Today we\u2019re sharing our vision for the future of the Twitter API platform!", "user": { "id": 2244994945, "name": "Twitter Dev", "screen_name": "TwitterDev", "location": "Internet", "url": "https:\/\/dev.twitter.com\/", "description": "Your official source for Twitter Platform news, updates & events. Need technical help? Visit https:\/\/ twittercommunity.com\/\u2328\ufe0f #TapIntoTwitter" }, "place": { }, "entities": { "hashtags": [ ], "urls": [ { "url": "https:\/\/t.co\/XweGngmxlP", "unwound": { "url": "https:\/\/cards.twitter.com\/ cards\/18ce53wgo4h\/3xo1c", "title": "Building the Future of the Twitter API Platform" } } ], "user_mentions": [ ] } }
Our analyses use three fields from each tweet: date (“created_at”), tweet identifier (“id_str”), and tweet text (“text”). The “created_at” field is a character string containing the date and time of the tweet. Every tweet has a unique identifier, the “id_str” value. The “text” field contains the unicode representation of the message. After creating a text file with tweet JSON, our next step involved reading and parsing tweets with the R packages rtweet (Kearney Citation2019) and tidytext (Silge and Robinson Citation2016).
3.5 Parsing Tweet Text
The next task is to wrangle the tweet JSON data into a structure suitable for LDA modeling. We used functions from the rtweet R package to parse tweet JSON into a data frame. We then divided tweet text into words with functions from the tidytext R package. We discarded commonly used “stop words” and emojis.
LDA model fitting requires that the corpus be organized as a document-term matrix. In a document-term matrix, each row corresponds to a single document (a single tweet), and each column is a single term (or word). Each cell contains a count (the number of occurrences of a term in the specified document). We created a document-term matrix with the R function cast_dtm from the tidytext package.
3.6 Latent Dirichlet Allocation
LDA is a statistical method for inferring latent (unobservable) topics (or themes) from a large corpus (or collection) of documents (Blei, Ng, and Jordan Citation2003). We pretend that there’s an imaginary process for creating documents in the corpus. For each document, we choose a discrete distribution over topics. For example, some tweets from Memorial Day may refer to the holiday. This may constitute one topic in the corpus. Having chosen a distribution over topics, we then select document words by first drawing a topic from the distribution over topics, then drawing a word from the chosen topic.
In mathematical notation, we write the generative process assumed by LDA (Blei, Ng, and Jordan Citation2003):
Choose
Choose
For each word, wn with
,
Choose a topic
Choose a word wn from
β refers to the k by V matrix of topic-specific word probabilities, where k is the number of topics and V is the size of the vocabulary, that is, the number of unique words in the corpus.
The goal for LDA is to infer both the distribution over topics and the topics (Blei, Ng, and Jordan Citation2003). A topic, in this setting, is a distribution over the vocabulary (the collection of all words in a corpus). Inference for LDA models is performed by either sampling from the posterior distribution or through variational methods. Researchers have devised a variety of Gibbs sampling techniques for these models (Porteous et al. Citation2008). Variational methods, while using approximations to the posterior distribution, offer the advantage of computational speed (Blei, Kucukelbir, and McAuliffe Citation2017). We used variational methods below in our case study.
4 Case Study Results
We identified the top ten most probable terms for each of ten topics in our models (). We plotted the within-topic word probabilities as bar graphs. We see that topic-specific word probabilities seldom exceed 0.05. We also note that some words are heavily weighted in multiple topics. This observation complicates semantic topic interpretation. We also caution that the results display expletives (that appeared on Twitter) and may be “not suitable for work (NSFW).” Instructors may apply a filter to remove common expletives before LDA modeling of tweets.
Fig. 1 Top terms for LDA model from May 24, 2020. Results contain expletives and may be not suitable for work (NSFW).
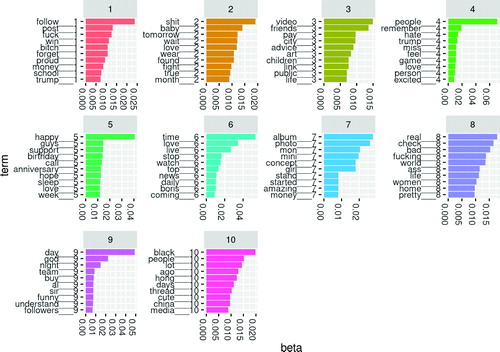
Fig. 2 Top terms for LDA model from May 25, 2020 (Memorial Day).
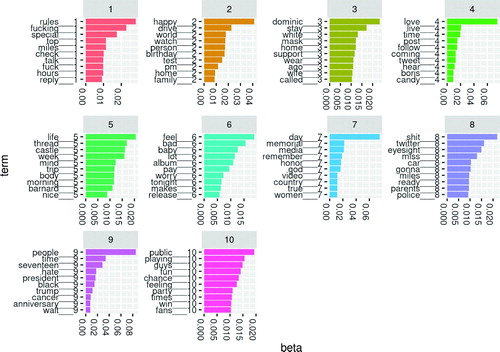
Fig. 3 Top terms for LDA model from May 26, 2020.
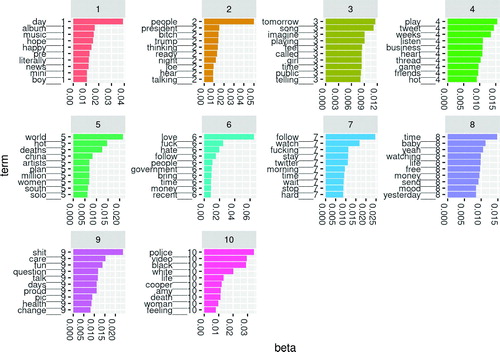
Assigning meaning to topics is an active research area (Chang et al. Citation2009). Since our interest is in the transient appearance of a new topic, we do not attempt to assign meaning to every topic in our models. Instead, we anticipate that discussions on Twitter are a mixture of topics that endure over weeks or months and subjects that appear and disappear quickly. We see that topic 7 from May 25 has several words that suggest Memorial Day: memorial, remember, honor, country. A similar topic is not seen on May 24 or May 26. Some topics persist, with distinct word probabilities, across the three days. For example, we see that President Trump features prominently in all three models’ results. On May 26, topic 10 reflects discussion of the Amy Cooper Central Park incident (https://www.nytimes.com/2020/05/26/nyregion/amy-cooper-dog-central-park.html).
The murder of George Floyd occurred on May 25, 2020. Our last examined time period, from 12:00 p.m. to 12:05 p.m. (Eastern USA time zone) on May 26, occurred after Floyd’s murder, yet we did not detect this event in our ten-topic LDA model. Several considerations may account for this. While outrage at the murder eventually spread worldwide, there may have been few Floyd-related tweets during our collection time on May 26, less than 24 hr after the murder and video release. Had we extended our analysis to May 27 and beyond, we may have identified George Floyd-related topics.
5 Assessment of Learning, Exploring More Advanced Topics, and Concluding Remarks
5.1 Assessment of Learning
We examined student learning with both formative and summative assessments. We conducted formative assessments through weekly discussions with students. In these discussions, we developed action items to advance research progress and overcome challenges. We summatively assessed student achievement at the end of the academic year. Both students wrote a thesis and presented a poster to our statistics department. We asked questions at the poster session to probe student understanding and critically evaluated the theses.
With future students, we will use a written rubric to evaluate theses (). We will share the rubric with our students at the start of the academic year. With only minor modifications, the rubric may be suitable for projects that do not use tweets.
5.2 Exploring More Advanced Topics
Twitter data over time inspires a variety of research projects. Supplementing tweets with public data from other sources multiplies the possibilities. For example, one of our two students supplemented tweets with daily stock market index prices. She studied sentiment of finance-related tweets and daily stock market index closing prices (supplementarymaterials).
LDA modeling and related methods are a major research area in the quantitative social sciences. Advanced students with interest in statistical computing might compare inferential methods for topic models. Those with interests in event detection and time series analysis could build on the findings of our student by explicitly accounting for topic evolution with dynamic topic models (Blei and Lafferty Citation2006).
5.3 Concluding Remarks
Our mentoring in data science aligns with others’ calls to reconsider the role of computing in statistics and data science (Nolan and Temple Lang Citation2010; Carver et al. Citation2016). Hicks and Irizarry (Citation2018) argued for incorporating three concepts into data science training: computing, connecting, and creating. They use the terms “connecting” and “creating” to describe the processes of applying quantitative methods to real data and research questions and of formulating research questions, respectively. Our tweet analysis projects offer students opportunities in all three skills sets. Our students first formulated research questions, then collected and analyzed data to address the questions. Throughout the projects, students drew heavily on computing, both to acquire data and to analyze it.
Tweet analysis gives students practical experience in the data science process of formulating a research question, gathering data to address it, summarizing the data, visualizing results, and communicating findings. Tweets over time are a rich, large, authentic dataset that offers many opportunities. We provided instructions to enable readers to establish their own tweet collections. We also presented details for one analysis strategy. By considering first student research interests and integrating them with our senior thesis learning objectives, we successfully guided two undergraduate researchers in data science research with tweets.
Supplemental Material
Download Zip (1.1 MB)Acknowledgments
The authors thank Betsy Colby Davie and Rick Nordheim for helpful discussions and feedback on preliminary versions of the manuscript. We thank the special issue editors and anonymous reviewers for their constructive comments and suggestions. Finally, this work would not have been possible without the keen and enthusiastic students, Jinyu Xia and Robert Turner.
Supplementary Materials
Tweets Data Dictionary
Data dictionary
R Code to Reproduce the Case Study
tweets.Rmd
tweets-one.Rmd
recover\_tweets.R
Student Projects
Student 1 poster: Project\_Poster.pdf
Student 1 report: report.pdf
Student 2 useR 2016 slides: user2016boehm.pdf
Student 2 poster: warfdiscovery2016boehm.tiff
References
- Blei, D. M., Kucukelbir, A., and McAuliffe, J. D. (2017), “Variational Inference: A Review for Statisticians,” Journal of the American Statistical Association, 112, 859–877. DOI: 10.1080/01621459.2017.1285773.
- Blei, D. M., and Lafferty, J. D. (2006), “Dynamic Topic Models,” in Proceedings of the 23rd International Conference on Machine Learning, pp. 113–120. DOI: 10.1145/1143844.1143859.
- Blei, D. M., Ng, A. Y., and Jordan, M. I. (2003), “Latent Dirichlet Allocation,” Journal of Machine Learning Research, 3, 993–1022.
- Box, G. E. (1976), “Science and Statistics,” Journal of the American Statistical Association, 71, 791–799. DOI: 10.1080/01621459.1976.10480949.
- Carver, R., Everson, M., Gabrosek, J., Horton, N., Lock, R., Mocko, M., Rossman, A., Roswell, G. H., Velleman, P., Witmer, J., and Wood, B. (2016), “Guidelines for Assessment and Instruction in Statistics Education (GAISE) College Report 2016,” AMSTAT.
- Chang, J., Gerrish, S., Wang, C., Boyd-Graber, J. L., and Blei, D. M. (2009), “Reading Tea Leaves: How Humans Interpret Topic Models,” in Advances in Neural Information Processing Systems, pp. 288–296.
- Hicks, S. C., and Irizarry, R. A. (2018), “A Guide to Teaching Data Science,” The American Statistician, 72, 382–391. DOI: 10.1080/00031305.2017.1356747.
- “Introducing JSON” (2020), available at https://www.json.org/json-en.html.
- “Introduction to Tweet JSON” (2020), available at https://developer.twitter.com/en/docs/tweets/data-dictionary/overview/intro-to-tweet-json.
- Kearney, M. W. (2019), “rtweet: Collecting and Analyzing Twitter Data,” Journal of Open Source Software, 4, 1829, DOI: 10.21105/joss.01829.
- Lin, C. X., Mei, Q., Han, J., Jiang, Y., and Danilevsky, M. (2011), “The Joint Inference of Topic Diffusion and Evolution in Social Communities,” in 2011 IEEE 11th International Conference on Data Mining, IEEE, pp. 378–387.
- National Academies of Sciences, Engineering, and Medicine (2018), Data Science for Undergraduates: Opportunities and Options, Washington, DC: National Academies Press.
- Nolan, D., and Temple Lang, D. (2010), “Computing in the Statistics Curricula,” The American Statistician, 64, 97–107. DOI: 10.1198/tast.2010.09132.
- Pelled, A., Lukito, J., Boehm, F., Yang, J., and Shah, D. (2018), “‘Little Marco,’‘Lyin’Ted,’‘Crooked Hillary,’ and the ‘Biased’ Media: How Trump Used Twitter to Attack and Organize,” in Digital Discussions: How Big Data Informs Political Communication, eds. N. J. Stroud and S. C. McGregor, New York:Routledge, pp. 176–196.
- Porteous, I., Newman, D., Ihler, A., Asuncion, A., Smyth, P., and Welling, M. (2008), “Fast Collapsed Gibbs Sampling for Latent Dirichlet Allocation,” in Proceedings of the 14th ACM SIGKDD International Conference on Knowledge Discovery and Data Mining, pp. 569–577. DOI: 10.1145/1401890.1401960.
- R Core Team (2019), R: A Language and Environment for Statistical Computing, Vienna, Austria: R Foundation for Statistical Computing.
- Robinson, D. (2016), “Text Analysis of Trump’s Tweets Confirms He Writes Only the (Angrier) Android Half,” available at http://varianceexplained.org/r/trump-tweets/.
- “Sampled Stream” (2019), available at https://developer.twitter.com/en/docs/labs/sampled-stream/overview.
- Silge, J., and Robinson, D. (2016), “tidytext: Text Mining and Analysis Using Tidy Data Principles in R,” JOSS, The Open Journal, 1, DOI: 10.21105/joss.00037.
- Wells, C., Shah, D. V., Pevehouse, J. C., Yang, J., Pelled, A., Boehm, F., Lukito, J., Ghosh, S., and Schmidt, J. L. (2016), “How Trump Drove Coverage to the Nomination: Hybrid Media Campaigning,” Political Communication, 33, 669–676. DOI: 10.1080/10584609.2016.1224416.
- Wickham, H. (2019), Advanced R, Boca Raton, FL: CRC Press.
- Wickham, H., and Grolemund, G. (2016), R for Data Science: Import, Tidy, Transform, Visualize, and Model Data, Newton, MA: O’Reilly Media, Inc.
- Wiggins, G., and McTighe, J. (2005), Understanding by Design, Alexandria, VA: Association for Supervision and Curriculum Development.
- Wijffels, J., and Belmans, O. (2018), “taskscheduleR: Schedule R Scripts and Processes With the Windows Task Scheduler.”