Abstract
Over the last 20 years, statistics preparation has become vital for a broad range of scientific fields, and statistics coursework has been readily incorporated into undergraduate and graduate programs. However, a gap remains between the computational skills taught in statistics service courses and those required for the use of statistics in scientific research. Ten years after the publication of “Computing in the Statistics Curriculum,” the nature of statistics continues to change, and computing skills are more necessary than ever for modern scientific researchers. In this article, we describe research on the design and implementation of a suite of data science workshops for environmental science graduate students, providing students with the skills necessary to retrieve, view, wrangle, visualize, and analyze their data using reproducible tools. These workshops help to bridge the gap between the computing skills necessary for scientific research and the computing skills with which students leave their statistics service courses. Moreover, though targeted to environmental science graduate students, these workshops are open to the larger academic community. As such, they promote continued learning of the computational tools necessary for working with data, and provide resources for incorporating data science into the classroom.
1 Introduction
Scientific fields have seen profound increases in the volume and variety of data available for analysis. Matched with the growth in computational power, today’s scientific researchers are faced with computational and statistical expectations beyond the coursework dictated by their curriculum. In the environmental sciences, though statistics courses have been readily incorporated into undergraduate and graduate curricula, an abundance of literature suggests that these curricula fail to equip graduate students with the computing skills necessary for research in their field (Andelman et al. 2004; Green et al. 2005; Hernandez et al. 2012; Teal et al. 2015; Mislan, Heer, and White 2016; Hampton et al. 2017; Theobold and Hancock 2019). Only one of these studies (Theobold and Hancock 2019), however, acknowledges the substantial role statistics courses could potentially play in students’ acquisition of these necessary computational skills.
Over the last 10 years, a large number of statistics educators have echoed Nolan and Temple Lang’s call to “embrace computing and integrate it fully into statistics undergraduate major and graduate programs” (Nolan and Temple Lang 2010, p. 97; e.g., Baumer 2015; Baumer, Horton, and Wickham 2015; Cobb 2015; Hardin et al. 2015; Horton and Hardin 2015; Çetinkaya-Rundel and Rundel 2018; Kaplan 2018). Indeed, the American Statistical Association’s (2014) Curriculum Guidelines for Undergraduate Programs in Statistical Science reflect the increasing importance of data science skills. Despite this campaign for computing in the statistics classroom, graduate-level statistics service courses have largely been overlooked. Unlike courses designed for an undergraduate or graduate program in Statistics, these service courses often act as the sole exposure to computing with data prior to the start of a student’s independent research. Thus, although more traditional statistics coursework has been incorporated into environmental science programs, often these courses fail to arm students with the data science skills necessary for research. A “symptom of the current curriculum’s shortcomings” (Hampton et al. 2017, p. 547) is the emergence of a variety of extracurricular opportunities for acquiring critical data science skills, such as Data Carpentry (https://datacarpentry.org). While Data Carpentry’s workshops teach domain-specific lessons covering the “fundamental data skills” needed for the “full lifecycle of data-driven research,” the possibility of further tailoring these workshops to populations of graduate student researchers has yet to be investigated.
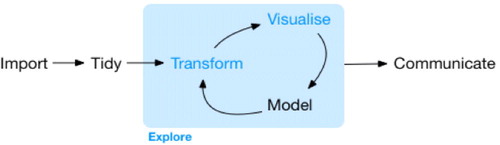
The intention of this research is to (1) describe the computing skills necessary for graduate-level environmental science research, (2) investigate how these skills can be infused into currently existing extracurricular workshops, and (3) understand the experience of attendees of these workshops. This article summarizes the results of the first iteration of a three-phase design-based implementation research model investigating each of these areas. For this research, the collection of disciplines who perform research across a variety of environmental science fields are captured under the term “environmental science.” At our institution, these are the departments of Ecology, Land Resources and Environmental Sciences (LRES), Plant Sciences and Plant Pathology (PSPP), and Animal and Range Sciences (ARS), whose students are required or highly recommended to complete graduate-level statistics coursework for a master’s or doctoral degree. In this article, the “data analysis cycle” consists of all stages in the data analysis process, from data importation to data exploration to the communication of results (), where data modeling is but one component. We focus on the “data science skills” necessary to engage in the entire data analysis cycle rather than focusing solely on the “analysis” portion of the cycle, due to the firm grounding of statistical preparation environmental science students experience during their degrees. These statistics courses, however, often do not expose students to data science skills that may be necessary for them to carry out an analysis they learned in the classroom in the context of real data. The skills necessary for students to engage in this cycle may include general programming concepts such as looping, user-defined functions, or conditional statements. However, the cornerstone of data science skills differs fundamentally from general programming skills, with a focus on data rather than computer architecture, design, and applications.
Fig. 1 Data analysis cycle (Wickham and Grolemund 2017).
2 The Current Climate of Statistics and Computing in the Environmental Sciences
Due to substantial changes in the data landscape over the last 20 years, the practice of environmental science has changed dramatically. Advances in technology have made computationally heavy applications of data science techniques—such as management and coalition of large datasets, high frequency spatial and temporal data visualization, and hierarchical Bayesian modeling—essential understandings for environmental science research. This flood of data has “challenged the research community’s capacity to readily learn and implement the concepts, techniques, and tools” (Hampton et al. 2017, p. 546) necessary for data-intensive environmental science research, creating a crucial need to reevaluate how our educational system can better prepare current and future generations of researchers (Green et al. 2005; Hampton et al. 2017).
2.1 Computing in the Environmental Science Curriculum
Arising from a decade of mumblings about the importance of computing to environmental science research (Andelman et al. 2004; Green et al. 2005; Hastings et al. 2005; Wilson 2006; Wing 2006; Dodds et al. 2007, 2008; Wilson et al. 2008; Eglen 2009; Kelling et al. 2009), 2012 brought two studies on the computational ill-preparation of environmental science students by their curriculum. In the first, a large-scale study of ecology instructors, Strasser and Hampton (2012) found that undergraduate students were not being prepared with the data management tools necessary to engage in environmental science research. Across 51 different institutions, fewer than 20% of instructors reported including data management topics in their courses. That same year, in a survey of environmental science graduate students across the United States, Hernandez et al. (2012) found that over 74% reported they had no skills in any programming language—including R—and only 17% reported basic skill levels in any programming language.
Today, throughout their research, the majority of environmental science graduate students are required to produce code as part of their data analysis process (Mislan, Heer, and White 2016). Dramatic changes have also been seen in the computing tools used in environmental science, with an increase of over 45% in the use of R in environmental science publications over the last 10 years (Lai et al. 2019). With this changing research climate, these studies suggest a large number of graduate students may be leaving their programs without the data science skills necessary for research in their field. Although more traditional statistics coursework has been readily incorporated into environmental science degrees, these conversations have yet to acknowledge the substantial role students’ statistics education potentially plays in the attainment of the data science skills necessary for research.
2.2 Computing in the Statistics Curriculum
Changes in the digital age have also had “a profound impact on statistics and the nature of data analysis” (Nolan and Temple Lang 2010, p. 97), with today’s skills differing substantially from what was needed but 5 to 10 years ago. In the year following the publication of “Computing in the Statistics Curriculum” (Nolan and Temple Lang 2010), a McKinsey report on “Big data: The next frontier for innovation, competition, and productivity” (Manyika et al. 2011) stated that, by 2018, “the United States alone could face a shortage of 140,000 to 190,000 people with deep analytical skills as well as 1.5 million managers and analysts with the know-how to use the analysis of big data to make effective decisions” (p. 3). With calls to transform the undergraduate statistics curriculum, the 2014 American Statistical Association (ASA) President, Nathaniel Schenker, convened a workgroup to update the association’s guidelines for undergraduate programs. These new guidelines included an increased emphasis on data science skills and real applications, specifically students’ ability to “access and manipulate data in various ways, use a variety of computational approaches to extract meaning from data, [and] program in higher-level languages” (American Statistical Association Undergraduate Guidelines Workgroup 2014, p. 7).
With this curricular momentum, in 2015, The American Statistician produced a special issue on “Statistics and the Undergraduate Curriculum.” In this issue, Cobb (2015) provocatively stated that the statistics curriculum needed to be rebuilt “from the ground up,” as “what we teach lags decades behind what we practice” and “the gap between our half-century-old curriculum and our contemporary statistical practice continues to widen” (p. 268). Though the issue focused on the broader statistics curriculum, statistics educators continued to lament that the current Introductory Statistics curriculum teaches but a snapshot of the entire data analysis cycle, “wherein challenges with data computational methods, and visualization and presentation are typically elided” (Baumer 2015, p. 336).
The following year brought the revised GAISE college report (ASA GAISE College Group 2016), creating a push for reform in the introductory statistics curriculum. The authors suggested two new emphases for the first recommendation (“teach statistical thinking”), which better reflect the modern practice of statistics. First, statistics educators should “teach statistics as an investigative process of problem-solving and decision making,” and second, should “give students experience with multivariable thinking” (p. 3). These recommendations reiterate the sentiments heard throughout the statistics community—that students should emerge from our courses with the understanding that data analysis “isn’t just inference and modeling, it’s also data importing, cleaning, preparation, exploration, and visualization” (Çetinkaya-Rundel 2018). Yet, the inclusion of these topics in the introductory statistics curriculum for nonmajors is still a heated discussion (Baumer, Horton, and Wickham 2015; Kaplan 2018; McNamara 2018), as many educators believe (1) that it is not possible to teach statistical concepts and programming in just one course, (2) that teaching programming takes up valuable time which could be used toward teaching important statistical concepts, or (3) students are not interested in learning to program (Çetinkaya-Rundel 2018). Thus, despite charges for the statistics community to “treat computing as fundamental as basic mathematics and writing” (Nolan and Temple Lang 2015, p. 298), many students leave their introductory statistics course without a set of data science skills applicable to their lives—a frustration echoed by environmental science educators (Teal et al. 2015; Hampton et al. 2017).
The fundamental question raised 10 years ago by Nolan and Temple Lang still applies today: do our students leave the statistics classroom able to “compute confidently, reliably, and efficiently?” (2010, p. 100). An in-depth study of environmental science graduate students’ experiences acquiring the computing knowledge necessary for their research answered this question with a resounding “no” (Theobold and Hancock 2019). Like the hypothesis of Teal et al. (2015), these students did not attribute their data science skills to the statistics courses they took for their degree. Rather, students gained these skills through independent research experiences, an “all-knowing” past or current graduate student, and their peer networks. Ten years after the publication of “Computing in the Statistics Curriculum,” we continue to assume that “students will ‘pick up’ the skills they need” to participate in the data analysis cycle outside of their statistics coursework (Gould 2010, p. 309).
2.3 Extracurricular Workshops to Bridge the Gap
Reiterated by both statistics education and environmental science researchers alike (Nolan and Temple Lang 2010; Teal et al. 2015), this lack of coordinated training in computing impedes the progress of scientific research and is laden with hidden costs. Students may pick up bad habits, misunderstandings, or the wrong concepts, learn just enough to get what they need done, spend weeks or months on tasks that could be done in hours or days, and may be unaware of the reliability and reproducibility—or lack there of—of their results (Nolan and Temple Lang 2010, p. 100; Teal et al. 2015, p. 136).
Environmental science educators have restated the challenges in integrating computing into the curriculum outlined by Nolan and Temple Lang. These barriers can be boiled down to “attempting to fit more material into already-full courses and curriculum, which are taught by people who do not feel prepared to address topics relevant to big data and data-intensive research” (Hampton et al. 2017, p. 547). These hurdles are potentially even greater for graduate-level statistics service courses, where instructors are often explicitly told the statistical content students are expected to learn, and implicitly assumed to also teach the data science skills necessary for students to participate in the entire data analysis cycle. Claiming graduate students ought to take additional, data science-specific courses to obtain these skills is infeasible, as many graduate programs leave little room for additional coursework.
Until computing has been meaningfully integrated into these service courses, extracurricular workshops hold the potential to address the gap between the computing preparation of students by their coursework and the computing skills required for their research. The current drove of online resources poses a “significant challenge in being able to discover relevant and high-quality materials” (Teal et al. 2015, p. 136) for researchers with limited time. Instead, short, intensive workshops, such as those provided by The Carpentries, are able to teach immediately useful skills that can be taught and learned quickly. As repeated by Nolan and Temple Lang (2015), extracurricular learning opportunities are not a direct substitute for the prolonged instruction of these skills that occurs in a course; however, this is not the goal of these learning opportunities (Word et al. 2017). Rather, workshops “are a way to get started” (Teal et al. 2015, p. 143), lowering the activation energy required to begin acquiring computing skills.
3 Methodology
Improving environmental science graduate students’ access to “powerful, effective learning opportunities” (Fishman et al. 2013, p. 137) necessitates understanding the skills required for these students to be successful in their research. Design-based implementation research (DBIR, Cobb et al. 2003; O’Neill 2012; Fishman et al. 2013) “offers a model for the design and testing of innovations within the crucible of classrooms and other contexts for learning” (Fishman et al. 2013, p. 140). DBIR uses collaboration with members of a community to develop “evidence-based improvements” (p. 143) to teaching innovations—situating community members as “co-designers of solutions to problems” (p. 140) rather than bystanders.
In this article, we summarize the results of the first iteration of a three-phase DBIR model, supporting environmental science graduate students in acquiring the data science skills necessary for data-intensive environmental science research. Phase one, detailed in Section 4, focused on outlining the computational skills environmental science faculty members identified as necessary for graduate students to succeed in their independent research. Phase two of this research, described in Section 5, used the skills identified during phase one to tailor currently existing Data Carpentry (https://datacarpentry.org/) and Software Carpentry (https://software-carpentry.org/) lessons to this population. Section 6 chronicles the third phase of this research, where the workshops were implemented and evaluated, specifically focusing on the backgrounds and experiences of workshop attendees.
The content of these tailored workshops was informed by the Data Carpentry and Software Carpentry curriculum. Adhering to the recommendations of the National Academies of Sciences, Engineering, and Medicine (NASEM) (2018), Data Carpentry offers domain-specific curricula, so participants “learn more quickly and effectively,” and can “see more immediately how to implement these skills and approaches in their own work” (Teal et al. 2015, p. 136). The Data Carpentry Ecology curriculum has been developed by the community, to “share perspectives on best practices” (p. 137). Furthermore, because these workshops are taught numerous times across the world, with public input on the content and structure of the lessons, the Data Carpentry Ecology curriculum represents the “best” theory for the teaching and learning of data science skills this field possesses. Notably, The Carpentries does not require training for instructors to use their content, as their materials are publicly available for use and adaptation (with acknowledgment). However, because the primary author is a Carpentries certified instructor, we chose to offer “self-organized,” “nonstandard” Carpentries workshops.1
4 Outlining the Computing Skills Necessary for Data-Intensive Environmental Science Research
As the direct supervisors of graduate students, environmental science faculty are potentially aware of the computing skills that are vital to researchers in their respective fields. Thus, interviews with faculty from these fields allow for us to gain an understanding of the essential skills required of environmental science graduate students.
In the spring of 2017 and fall of 2018, every faculty member currently overseeing a graduate student in the ARS, Ecology, LRES, and PSPP departments was sent email requesting their participation in this research. outlines the number of faculty requested for participation and the number of faculty interviewed, by departmental affiliation.
Table 1 Number of faculty members requested for participation and interviewed, by department.
4.1 Data Collection and Data Analysis
Faculty who agreed to participate engaged in a 1-hr interview regarding (1) the computational skills they believe are necessary for master’s and doctoral students to implement statistics for research in their field, and (2) how they believe graduate students acquire these necessary skills. The interview protocol, data, and analysis files associated with this manuscript are available through Dryad (Theobold et al. 2020).
The primary author led a three-stage data analysis process of the faculty interviews (Miles, Huberman, and Saldana 2014). During the first stage, every faculty member’s interview was transcribed verbatim. Subsequently, the primary author read each transcript, highlighting excerpts where computing skills were discussed, creating descriptive codes for the skills faculty identified as necessary in each of these excerpts.
Next, the primary author began the second stage of analytical coding, synthesizing the descriptive codes into instances of a general concept (Miles, Huberman, and Saldana 2014, p. 95). During this stage, computing skills were linked thematically, and themes that held across multiple interviews were retained. The author then searched faculty transcripts to uncover how each theme related to the others. During this process, it was determined whether themes captured similar constructs and should be merged, or if themes ought to remain separate. For example, while every faculty voiced students’ need to work with data in R, these sentiments were voiced alongside students’ need to perform other data wrangling operations, such as filtering out rows or selecting columns. Hence, the themes of “working with data” and “data wrangling” were merged into the single theme of “working with data.”
In the final stage, the first and second authors searched the faculty transcripts for evidence supporting the emerging themes, scrutinizing whether each identified skill fit into the emergent themes. These final themes informed the design of data science workshops.
4.2 Themes of Skills Identified by Environmental Science Faculty
While some faculty had difficulty disentangling the statistical methods students use in research from the computing required to implement those methods, many were able to express the computing skills necessary for graduate students in their field to engage in the entire data analysis process. A substantial overlap was seen between faculty expectations and the “data acumen” outlined by NASEM (2018), with faculty themes falling into three categories: (1) working with and wrangling data, (2) data visualization, and (3) reproducibilty.
4.2.1 Working With Data
Every faculty member interviewed believed that students’ experiences in the statistics classroom do not adequately prepare them to work with and organize large, messy datasets. As graduate students perform their research, they are required to think about “storing data, managing data, matching data, and collating data,” into meaningful datasets for analysis. Some faculty reflected that they don’t believe it’s uncommon for students to work with large datasets, but “[they] think it’s uncommon [for students] to be doing it effectively or efficiently.”
These skills for working with data ranged from students’ ability to “organize their data and get it in a way that can be used by R” to tasks that required reorganizing data formats from wide to long or vice versa—a skill which every faculty member griped is not acquired through the standard curriculum. A faculty member bemoaned that standard examples in statistics courses provide students with data which are the product of cross-tabulation, so students are never forced “to figure out how to get the cross-tabulation [they] need, so that [they] can bring it into R and do [their] regression.” These concerns reiterate the importance of “data management and curation” detailed by NASEM, who stated that “at the heart of data science is the storage, preparation, and accessing of data” (2018, p. 26).
4.2.2 Data Visualization
The importance data visualization has on every stage of students’ research was emphasized by every faculty member. Faculty affirmed that students should possess the ability to create visualizations of their data early and often. These expectations align with the capabilities outlined by NASEM, who stated that students need to have the ability to “present data in a clear and compelling fashion” (2018, p. 26). One faculty member declared that students’ ability to look at their data in different ways dramatically shapes their research potential, and the tools available today allow researchers to create visualizations precisely tailored for each investigation. Many faculty voiced the usefulness of the ggplot2 package (Wickham 2016) in lowering the barriers for students to learn “how to visualize [their] data to explore and understand it.”
4.2.3 Reproducibility
Every faculty member emphasized the necessity for students’ analyses to be computationally reproducible, where faculty would be able to recreate student’s results, “given only a set of files and written instructions” (Kitzes, Turek, and Deniz 2018). Across environmental science disciplines, faculty concurred that many students do not perform scripted data wrangling, and instead rely on Excel because “[R] is kind of a black box” and when students “don’t have that instant connection with [their] data, I think it fundamentally boils down to fear.” Concerns were raised for the students using unreproducible tools to wrangle their data, as “they would never find [their] way back to what the original dataset would have been” and their advisers would have no way to understand why certain data are missing. While many advisers stated that they encourage students to avoid these brute force data manipulations, they reflected that students may not have the computing skills necessary to perform the same tasks in a scripted and reproducible manner. These faculty concerns parallel the “workflow and reproducibility” acumen outlined by NASEM, who stated that students need to “be exposed to the concept of workflows” (2018, p. 28).
4.2.4 How Students Gain Computational Skills
Across environmental science disciplines, faculty stated that they assume students are acquiring the computing skills necessary to analyze their data either in their required statistics coursework or on their own. When asked why students are not acquiring computing skills in their field-specific courses, a faculty member stated, “we don’t really have anyone to teach that. It’s not that it isn’t valuable, but there is no one to teach it.” Some faculty believed “graduate students come in knowing more about the tools one might use to manipulate data than their advisers do,” while others lamented the gaps between the computing skills of their graduate students and their own training, feeling “personally out of touch with [students] because I haven’t taken the time to learn R, because of my training and my age.” These gaps impact the assistance faculty can provide to their students, as “increasingly, faculty feel that they’re not at the forefront of their programming abilities, so their students are being self-taught and are often computationally ahead of them.”
5 Designing Data Science Workshops for Environmental Science Graduate Students
The second phase of this research attended to the development of a suite of data science workshops targeted to graduate students in the environmental sciences. The skills identified through faculty interviews were incorporated into Data Carpentry’s Data Analysis and Visualization in R for Ecologists lesson (Zhian 2018).2 The series of workshops consists of four 3-hr workshops covering (1) the basics of programming in R, (2) intermediate programming tasks in R, (3) creating effective data visualizations, and (4) wrangling data. Importantly, the first workshop does not assume attendees have previous experience working in R, and each workshop builds on the knowledge acquired at the previous workshop(s). The workshop materials developed for this research are available through GitHub,3 with video tutorials recorded and available through our institution’s library.4
5.1 Pedagogy
These workshops were taught in a technology-enhanced active learning (TEAL) classroom that seats up to 35 individuals. The classroom has two monitors on every wall, a projector at the front of the room, and tables that seat groups of three to four persons. The layout of the room allowed for students to watch as the instructor live coded, and supported the instructor and workshop assistants in easily engaging with attendees as they worked. Each workshop had one lead instructor and two to three workshop assistants. The assistants were tasked with addressing any questions that arose while participants completed hands-on tasks.
During the workshop, each topic was first introduced by the instructor, followed by the live coding of an example. The group then engaged in a discussion of the computing concept(s). This group dialogue created an inclusive space where attendees were able to pose questions or conjectures to the group while the instructor live coded questions asked or participants’ conjectures. Finally, attendees grouped up to complete a set of hands-on tasks, applying the concept(s) covered in that section of the workshop. As attendees worked in groups to tackle the tasks at hand, they were instructed to place a colored sticky note on their computer to signal assistants for help. These hands-on tasks allowed for attendees to “learn the computational aspects as part of an interesting, challenging, and confidence-building process” (Nolan and Temple Lang 2010, p. 101)
5.2 Data Context
Emphasized by both faculty members and NASEM, “effective application of data science to a domain requires knowledge of that domain” (2018, p. 29). Hence, data science instruction ought to be grounded in “substantive contextual examples,” to “ensure that data scientists develop the capacity to pose and answer questions” with data relevant to them (2018, p. 30). Therefore, ecological data were used for these workshops, originating from a resource management agency and the Portal Project Teaching Database (Ernest et al. 2018). These data highlighted a variety of aspects that commonly occur in ecological data, including missing data, multiple sampling instances, mark-recapture, and meta- and micro-level data.
5.3 Computing Tools for Environmental Science Research
The structure and context of these workshops include a statistical programming language used extensively throughout environmental science research (R), environments that facilitate the learning of R (RStudio and RStudio Cloud), user-friendly R packages for data wrangling and data visualization (tidyverse), and tools that promote reproducibility throughout the entire data analysis cycle (rmarkdown).
5.3.1 Why R?
The use of R is widespread throughout the environmental science research community, a dramatic change over the last decade (Lai et al. 2019). Furthermore, with the creation of the RStudio integrated development environment (IDE) (RStudio Team 2015b), this user-ship continues to increase. R is free and open source, so attendees learn a statistical programming language that will be accessible to them throughout their careers. Unlike frequently used environmental science software, such as MARK, VORTEX, or RMAS, with R, attendees’ results do not depend on remembering the sequence of buttons they clicked. With a growing appreciation for reproducible data analysis methods in ecological research (Cassey and Blackburn 2006; Ellison 2010; Morrison, Wardle and Castley 2016; Powers and Hampton 2019), today’s researchers in scientific fields are becoming more aware of the need for a reproducible data analysis workflow.
5.3.2 Why RStudio?
The RStudio IDE “makes [programming] less intimidating than the bare R shell” (Çetinkaya-Rundel and Rundel 2018, p. 59). Unlike other statistical software packages, the RStudio environment is consistent across operating systems. Moreover, because RStudio is an IDE, it includes integrated help files, intelligent code completion, and syntax highlighting—all of which help to lower the learning curve.
5.3.3 Why RStudio Cloud?
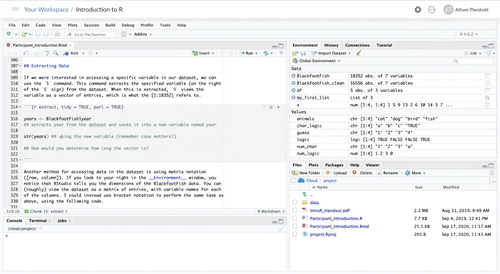
The RStudio Cloud was created as a platform to make it easy to do, share, teach, and learn data science using R (RStudio Team 2015a). Through the Cloud, attendees are able to access the workshop materials without worrying about software installation, package installation, or data transfers. Workshop participants interact with the workshop’s materials in the same manner as a locally installed version of RStudio, as seen in , and are exposed to best practices for reproducible project construction through the use of RStudio projects.5
Fig. 2 RStudio Cloud workspace environment for Introduction to R workshop. Every workshop works in an RStudio project, containing a master R Markdown file, a data folder containing the data used in the workshop, and the handout produced for attendees.
5.3.4 Why the tidyverse?
Considering much of R’s language has not changed over the last 20 years, and the use of R for scientific research has multiplied, there existed a desire for a “smoother, more efficient, and more readable pipeline for modern R workflows” (Ross, Wickham, and Robinson 2017, p. 19). The suite of R packages developed by Wickham and colleagues, universally known as the “tidyverse,” has created user friendly R tools that “share an underlying design philosophy, grammar, and data structures” (Wickham et al. 2019). Inspired by how cumbersome it can be to remember the different base R functions to wrangle and visualize your data, each with its own unique syntax, the workshops in this series make use of many tidyverse packages, including dplyr (2020), tidyr (2020), and ggplot2 (2016). The common syntax of these packages lessen learner’s cognitive load, allowing for a participant to leave each workshop with more tools in their data science toolbox.
5.3.5 Why R Markdown Documents?
R Markdown documents provide an easy-to-understand framework to combine statistical computing and written analysis in a single document, helping to break the copy-paste paradigm for generating statistical reports (Baumer et al. 2014). R Markdown documents allow for attendees to keep their code organized and their workspace clean during the workshop, a task that is often unnatural for new learners. For additional information on R Markdown documents, see Baumer et al. (2014).
5.4 Workshop Content
5.4.1 Introduction to R
This first workshop in the series covers the basics of learning to program in R. The workshop first introduces the RStudio environment and project work flow in RStudio, discussing working directories and relative paths. Next, the workshop progresses through tools for working with vectors and lists of different data types, motivating methods for working with dataframes. After learning how to import data into R, the workshop proceeds through inspecting data, extracting data, and changing data types. Prompted by working with missing data, the workshop introduces R help files to inspect function arguments and their default values. These help files are called upon as participants make use of base R functions to create data summaries, perform simple data cleaning, and produce both univariate and bivariate visualizations of the data.
5.4.2 Intermediate R
This second workshop covers coding skills to modularize R code. The content in this workshop, excluding relational statements, was not included in Data Carpentry’s Data Analysis and Visualization in R for Ecologists lesson. Yet, conditional statements, looping, and user-defined functions are skills that many faculty asserted were necessary for graduate students to possess as they perform independent research. Many of these concepts, however, are included in Software Carpentry’s R for Reproducible Scientific Analysis lesson (Thomas and Naupaka 2016).
The workshop first progresses through the use of relational statements and linking these statements using and (&), or (—), and not (!) conjunctions. Next, the workshop dives into the use of conditional statements, stepping from if(), to if(){}else{}, to else if(){} statements. Subsequently, the use of the ifelse() function is motivated by the need to vectorize these types of conditional operations. The second half of the workshop covers methods to iterate or replicate a set of instructions many times. Looping, specifically for(){} loops, are introduced as a popular way to iterate or replicate the same set of instructions. Working through exercises that repeat operations on a dataset using both a for() loop and a recursive for() loop, motivates a discussion of why vectorization is recommended for nonrecursive for() loops. In the interest of time, participants are provided with resources to continue learning about vectorized operations using the purrr package (Henry and Wickham 2020).
To conclude, functions are presented as an approach to replicate the same set of instructions throughout your code. Inspired by a script that copies and pastes the same process multiple times, attendees see why this is an undesirable practice. Attendees are then tasked with transforming the copy-paste-modify process into a function. By parsing out the function-writing process into a set of steps that should be used when you have copied and pasted your code multiple times, participants leave with a foundational understanding of why functions are useful, and practical approaches for implementing them in their own code.
5.4.3 Data Wrangling With dplyr and tidyr
The third workshop in the series introduces common data wrangling issues faced by environmental science researchers. Using the dplyr package (Wickham et al. 2018), the workshop outlines six of the common “verbs” that handle common data wrangling challenges: select(), filter(), mutate(), group_by(), summarise(), and arrange(). Prompted by the need to perform a sequence of multiple data wrangling operations, participants learn how to connect each of these data wrangling verbs using the pipe operator (%¿%). Next, with a need to integrate additional data files for analysis, the concept of relational data is outlined. After an introduction to key-value pairs, attendees make use of the left_join() and right_join() functions to join these additional data files.
The final topic of the workshop involves the issue of data reorganization. Until now, participants have been presented with “tidy” data (Wickham 2014). This concept of tidy data is used to describe “long” and “wide” data formats. The tidyr package (Wickham and Henry 2018) is introduced to alleviate the burden of data reorganizations when transforming data from one layout to another, using pivot_wider() and pivot_longer(). In groups, participants work through a final exercise connecting the concepts of variable mutation, grouped data summaries, and “long” and “wide” data.
5.4.4 Data Visualization With ggplot2
The final workshop in the series dives into creating data visualizations using the ggplot2 package (Wickham 2016). Using the joined data from the close of the previous workshop, a scatterplot is used to illuminate a discussion of the ggplot() syntax. Participants learn about the mapping argument for specifying aesthetics (aes()) for the plot and the different geom functions which define the type of plot you produce. By making explicit connections between the addition operator (+) and the pipe operator, participants understand addition to be an intuitive metaphor for adding layers to a plot. Next, the workshop examines how to modify the ggplot() aesthetics and geoms to create violin plots, density plots, bar charts, and line plots, allowing for participants to explore the geom functions and aesthetics that pair with each plot. A conversation is had about the importance of plotting raw data rather than simply aggregate measures of the data, and the difficulties that might arise. Adding a geom_point() or geom_jitter() layer to a visualization highlights tools that can be used so graph elements don’t interfere with the data (e.g., jittering, transparency), similar to the advice of Nolan and Perrett (2016). Finally, faceting, using facet_wrap() and facet_grid(), is introduced as an additional visualization tool to facilitate multivariate comparisons (Nolan and Perrett 2016, p. 261).
By this point in the workshop, participants have posed many questions on how to modify aspects of a plot that do not depend on the geom. For the final section of the workshop, the group walks through different customizations one can make to each ggplot() to add clarity and information to the plot. Participants learn how to flip a plot’s coordinates, and how to make customizations of the labels, the size of the points, the thickness of lines, the appearance of the plotting window, and the colors. Each of these customizations continues to emphasize the iterative nature of creating data visualizations, transforming a simple plot step-by-step “into a graph that is data rich and presents a clear vision of the important features of the data” (Nolan and Perrett 2016, p. 262).
6 Evaluating Data Science Workshops
During the 2018–2019 academic year, a total of 202 students, faculty, and staff attended at least one workshop. The Introduction to R and Intermediate R workshops were offered twice during the fall semester, and once during the spring semester, with 84 individuals attending Introduction to R and 74 attending Intermediate R. The Data Wrangling and Data Visualization workshops were each offered once during the spring semester, with a total of 20 individuals attending Data Wrangling and 24 attending Data Visualization. The first workshop was offered two weeks after the start of the semester, with three week breaks between each subsequent workshop.
In the week prior to each workshop, a pre-workshop survey was sent out using a Google Form. This survey detailed individuals’ demographics and backgrounds prior to attending the workshop. Following each workshop, attendees were asked to complete a post-workshop survey, detailing their experiences in the workshop. The content of these surveys was informed from the assessments developed by The Carpentries.6 Of the 202 students, faculty, and staff that attended these workshops, 121 (60%) completed the pre-workshop survey and 56 (27%) completed the post-workshop survey. The submission of these surveys required responses to every question. The pre- and post-workshop surveys are available through the associated GitHub repository.
6.1 Backgrounds of Workshop Participants
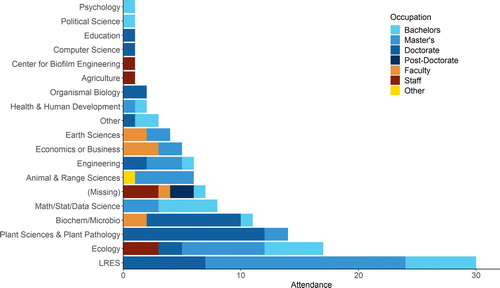
The majority of the workshop attendees were from environmental science fields—from departments such as ARS, Biochemistry or Microbiology, Earth Sciences, Ecology, LRES, and PSPP. Over 60% of workshop attendees were master’s and doctoral students. It is worth noting, however, that 18 faculty, staff, and postdocs also attended these workshops. displays the department affiliations of the workshop attendees and their reported occupations.
Fig. 3 Number of workshop attendees during the 2018–2019 academic year, by department and current occupation, selected from an itemized list of campus departments and occupations in the pre-workshop survey.
Consistent with the environmental science literature (Andelman et al. 2004; Hernandez et al. 2012; Teal et al. 2015; Hampton et al. 2017), the majority of attendees (over 60%) reported no experiences with any programming languages. However, 20% of attendees reported experiences working in R, and 30% reported experiences with other programming languages (e.g., MatLab, SQL, Java, C).
Many attendees, however, stated that they had taken courses in statistics, with the majority reporting undergraduate or graduate experiences in an introductory-level statistics course. Most graduate students had either taken discipline-specific introductory statistics courses in their own department or a graduate-level applied statistics course offered by the Department of Mathematical Sciences. consolidates workshop participants’ previous statistical experiences. Notably, over 15% of attendees reported having no formal statistical training.
Table 2 Workshop attendees’ responses (n = 121) to the pre-workshop survey question “What are your previous statistical experience(s)? List course names,” thematically organized based on content of the course.
6.2 Motivation for Attending
As expected from the prevalence of the use of R in environmental science research (Mislan, Heer, and White 2016; Lai et al. 2019), over half of the master’s, doctoral, and post-doc workshop participants attended the workshop for research assistance. Other attendees were seeking assistance with learning the R skills necessary for their coursework, refreshing or updating their R skills to include new tools with which they were unfamiliar (e.g., the ggplot and dplyr packages), or undergraduates preparing for graduate school. As echoed by previous studies of environmental science graduate students (Teal et al. 2015; Theobold and Hancock 2019), attendees overwhelmingly stated that they primarily use the internet (27%), their peers (21%), or their lab mates (15%) when learning R.
6.3 Reflections of Workshop Participants
The percentage of individuals reporting the workshop covered unfamiliar material differed by workshop, with 40% of Introduction to R participants, 30% of Intermediate R participants, 80% of Data Wrangling participants, and 50% of Data Visualization participants stating the information presented was new to them. Across every workshop, nearly every participant stated that they “strongly agreed” that they “learned skills that [they] will be able to use in [their] research/work.” Additionally, over 75% of the workshop participants reported they would use the skills they learned in their research immediately or in the next 30 days.
Themes of hands-on learning, workshop atmosphere, instructor attributes, and confidence emerged from attendees’ reflections of what they enjoyed most about the workshop. Many attendees felt the hands-on exercises “foster[ed] a much greater level of understanding,” left them feeling more “confident figuring things out on my own,” and were “a clear tool which allow me to see what I gained.” Furthermore, these attendees voiced that the workshop left them feeling more independent, because “I have a better understanding of how to read code, what certain symbols/terms/etc mean and how they work.”
7 Sustainability of Workshops
To date, we have held 14 workshops, serving 382 members of the Montana State University. To facilitate the sustainability of these workshops, we forged a partnership between our institution’s library and the Department of Mathematical Science’s Statistical Consulting and Research Services (SCRS). We believe a university’s library is an optimal unit for offering these workshops, as it is both department-agnostic and a central hub for the entire university community. Furthermore, by partnering with an organization that provides statistical consulting, workshop participants are provided with a potential avenue if difficulties or additional questions arise—so the peer network is not shifted onto workshop instructors.
A data-engagement grant from the National Network of Libraries of Medicine during the 2018–2019 academic year supported the primary author in leading the workshops, becoming a Carpentries certified instructor, and incorporating the results of this research into the broader Data and Software Carpentry curricula. A $5000 faculty excellence grant during the 2019–2020 academic year, facilitated the implementation of a “train-the-trainer” model, training two future graduate student instructors. Instructors were recruited from the Master and Doctoral programs in Statistics, but because of the widespread use of R across scientific fields, graduate students from a variety of backgrounds also hold the potential to be effective instructors. Both semesters, the authors met with these students for 1-hr a week to build students’ facilities and confidence instructing. Each semester, instructor trainees taught different 30–45-min portions of each workshop, and acted as assistants for the remainder for the workshop.
Similar to the “Explorations in Statistics Research” workshop model (Nolan and Temple Lang 2015), the “standard” Carpentries workshop format takes place over an intensive two days. Self-organized workshops, however, allow for this format to be tailored toward busy students, faculty, and staff—by offering one 3-hr workshop every few weeks—but this revised format has both benefits and costs. The additional time between each workshop helps to alleviate the fatigue often experienced in intensive workshops, and allows for participants to selectively attend workshops relevant to the skills they wish to acquire. However, in this extended format, workshops after Introduction to R are potentially considered “specialized” workshops and experience lower attendance. At an academic institution, there is the possibility of integrating this type of workshop series into a single credit course. When considering this as an option, however, institutions should think carefully about how faculty and staff can continue to participate in these learning opportunities. Alternatively, institutions could offer course credit for undergraduate students assisting with the workshops, and allow for students to become lead or co-instructors as they progress through their program.
8 Limitations and Future Research
The sentiments heard by faculty in this research unearth the possibility that many faculty may be unaware of the computing skills necessary for their graduate students to participate in the entire data analysis cycle. Instead, students may have more relevant knowledge regarding the data science skills that are necessary for their research. Hence, the next iteration of this research will focus on the collection of the R code produced by environmental science graduate students throughout their research. The skills outlined by this research will aid in reevaluating the content of the workshops, to ensure they cover the skills necessary for graduate-level environmental science research.
Over a third of the workshop attendees came from disciplines outside of the environmental sciences, and, strikingly, these attendees reported similar workshop experiences as attendees from the targeted disciplines. This brings to question whether these types of discipline-specific workshops are necessary, and if there are common computational understandings necessary for research in any scientific field, which should be infused into every statistics and data science course. Alternatively, we saw a greater persistence across workshops by attendees from environmental science fields. This causes us wonder, what are the drivers behind these individuals’ continued attendance? Future research investigating the learning outcomes of workshop attendees holds the potential to provide fruitful insight into the necessity of discipline-specific learning opportunities.
9 Conclusion
Ten years ago, Nolan and Temple Lang declared that “modernizing the statistics curricula to include computing […] is an issue that deserves widespread attention and action” (p. 106). Over the last ten years, we have seen both small and large changes advocated for the statistics curriculum. However, graduate-level statistics service courses have received less attention and pose different issues.
Statistics courses that serve a variety of students (undergraduate, graduate, statistics major, nonmajor) reflect a snapshot of the statistics curriculum, and often act as many students’ sole statistics course prior to conducting scientific research. Instructors of these courses thus grapple with difficult decisions of how they can ensure their students have both the statistical and “computational understanding, skills, and confidence needed to actively and wholeheartedly participate” in the scientific research arena (Nolan and Temple Lang 2010, p. 106). For instructors unfamiliar with students’ scientific disciplines, it can be difficult to “be bold and design curricula from scratch” (p. 106). The topics suggested by Nolan and Temple Lang (2010) represent a starting point toward building a taxonomy for computing in statistics for undergraduate and graduate Statistics programs. These topics, however, may not be relevant to or emphasized by other scientific disciplines whose students enroll in statistics service courses. In our research, we found that environmental science faculty stressed the importance of graduate students developing skills surrounding the fundamentals of working with data in R, wrangling skills for data processing and preparation, creation of data visualizations, and use of reproducible work flows.
In this new era of data science, the time is ripe for us to “update the foundational concepts and infrastructure” (He et al. 2019, p. 5) included in statistics service courses. As we work toward a more thorough integration of computing into these courses, this research offers a model for facilitating external workshops, which hold the potential to fill a critical hole in the curriculum of many college programs. External workshops allow for co-curricular learning, when paired with statistics service courses, so students leave their statistics course with the computing skills necessary to engage in the entire data analysis cycle. Moreover, these workshops support university-wide data science literacy, facilitating avenues for faculty to acquire data science knowledge and skills that “they have not had the opportunity to learn well” (Nolan and Temple Lang 2010, p. 106), and providing resources for instructors to meaningfully integrate discipline-specific computing skills into their classroom.
Acknowledgments
We give special thanks to the participants of this study, without whom this research would not have been possible. We also thank the workshop instructors and helpers for helping to grow the data literacy across our campus. Finally, thanks to Jennifer Green, Mark Greenwood, Johanna Hardin, and the reviewers for their insightful comments.
Funding
The authors gratefully acknowledge Network of the National Library of Medicine - Pacific Northwest Region for supporting this research.
ORCID
Allison S. Theobold http://orcid.org/0000-0002-2635-6895
Related Research Data
References
- American Statistical Association Undergraduate Guidelines Workgroup (2014), 2014 Curriculum Guidelines for Undergraduate Programs in Statistical Science, Alexandria, VA: American Statistical Association.
- Andelman, S. J., Bowles, C. M., Willig, M. R., and Waide, R. B. (2004), “Understanding Environmental Complexity Through a Distributed Knowledge Network,” BioScience, 54, 240–246. DOI: 10.1641/0006-3568(2004)054[0240:UECTAD.2.0.CO;2]
- ASA GAISE College Group (2016), Guidelines for Assessment and Instruction in Statistics Education College Report 2016, Alexandria, VA: American Statistical Association.
- Baumer, B. (2015), “A Data Science Course for Undergraduates: Thinking With Data,” The American Statistician, 69, 334–342. DOI: 10.1080/00031305.2015.1081105.
- Baumer, B., Cetinkaya-Rundel, M., Bray, A., Loi, L., and Horton, N. J. (2014), “R Markdown: Integrating a Reproducible Analysis Tool Into Introductory Statistics,” Technology Innovations in Statistics Education, 8, 1–22.
- Baumer, B. S., Horton, N. J., and Wickham, H. (2015), “Setting the Stage for Data Science: Integration of Data Management Skills in Introductory and Second Courses in Statistics,” CHANCE, 28, 40–50. DOI: 10.1080/09332480.2015.1042739.
- Cassey, P., and Blackburn, T. M. (2006), “Reproducibility and Repeatability in Ecology,” BioScience, 56, 98. DOI: 10.1641/0006-3568(2006)56[958:RARIE.2.0.CO;2]
- Çetinkaya-Rundel, M. (2018), “Intro Stats, Intro Data Science: Do We Need Both?,” Presented at the 2018 Joint Statistical Meetings.
- Çetinkaya-Rundel, M., and Rundel, C. (2018), “Infrastructure and Tools for Teaching Computing Throughout the Statistical Curriculum,” The American Statistician, 72, 58–65. DOI: 10.1080/00031305.2017.1397549.
- Cobb, G. (2015), “Mere Renovation Is Too Little Too Late: We Need to Rethink Our Undergraduate Curriculum From the Ground Up,” The American Statistician, 69, 266–282. DOI: 10.1080/00031305.2015.1093029.
- Cobb, P. A., Confrey, J., diSessa, A. A., Lehrer, R., and Schauble, L. (2003), “Design Experiments in Educational Research,” Educational Researcher, 32, 9–13. DOI: 10.3102/0013189X032001009.
- Dodds, Z., Alvarado, C., Kuenning, G., and Libeskind-Hadas, R. (2007), “Breadth-first CS-1 for Scientists,” in Proceedings of the 2007 Innovation and Technology in Computer Science Education (ITiCSE), ACM.
- Dodds, Z., Libeskind-Hadas, R., Alvarado, C., and Kuenning, G. (2008), “Evaluating a Breadth-First CS-1 for Scientists,” in Proceedings of the 2008 Special Interest Group on Computer Science Education (SIGCSE), ACM.
- Eglen, S. J. (2009), “A Quick Guide to Teaching R Programming to Computational Biology Students,” PLOS Computational Biology, 5, 1–4. DOI: 10.1371/journal.pcbi.1000482.
- Ellison, A. M. (2010), “Repeatability and Transparency in Ecological Research,” Ecology, 91, 2536–2539. DOI: 10.1890/09-0032.1.
- Ernest, M., Brown, J., Valone, T., and White, E. P. (2018), “Portal Project Teaching Database,” available at DOI: 10.6084/m9.figshare.1314459..
- Fishman, B. J., Penuel, W. R., Allen, A.-R., Cheng, B. H., and Sabelli, N. (2013), “Design-Based Implementation Research: An Emerging Model for Transforming the Relationship of Research and Practice,” Yearbook of the National Society for the Study of Education, 112(2), 136–156.
- Gould, R. (2010), “Statistics and the Modern Student,” International Statistics Reveiw, 78, 297–315. DOI: 10.1111/j.1751-5823.2010.00117.x.
- Green, J. L., Hastings, A., Arzberger, P., Ayala, F. J., Cottingham, K. L., Cuddington, K., Davis, F., Dunne, J. A., Fortin, M.-J., Gerber, L., and Neubert, M. (2005), “Complexity in Ecology and Conservation: Mathematical, Statistical, and Computational Challenges,” BioScience, 55, 501–510. DOI: 10.1641/0006-3568(2005)055[0501:CIEACM.2.0.CO;2]
- Hampton, S. E., Jones, M. B., Wasser, L. A., Schildhauer, M. P., Supp, S. R., Brun, J., Hernandez, R. R., Boettiger, C., Collins, S. L., Gross, L. J., Fernandez, D. S., Budden, A., White, E. P., Teal, T. K., Labou, S. G., and Aukema, J. E. (2017), “Skills and Knowledge for Data-Intensive Environmental Research,” BioScience, 67, 546–557. DOI: 10.1093/biosci/bix025.
- Hardin, J., Hoerl, R., Horton, N. J., Nolan, D., Baumer, B., Hall-Holt, O., Murrell, P., Peng, R., Roback, P., Lang, D. T., and Ward, M. D. (2015), “Data Science in Statistics Curricula: Preparing Students to ‘Think With Data’,” The American Statistician, 69, 343–353. DOI: 10.1080/00031305.2015.1077729.
- Hastings, A., Arzberger, P., Bolker, B., Collins, S., Ives, A. R., Johnson, N. A., and Palmer, M. A. (2005), “Quantitative Bioscience for the 21st Century,” BioScience, 55, 511–517. DOI: 10.1641/0006-3568(2005)055[0511:QBFTSC.2.0.CO;2]
- He, X., Madigan, D., Yu, B., and Wellner, J. (2019), “Statistics at a Crossroads: Who Is for the Challenge,” Technical Report, The National Science Foundation.
- Henry, L., and Wickham, H. (2020), “purrr: Functional Programming Tools,” R package version 0.3.4.
- Hernandez, R. R., Mayernik, M. S., Murphy-Mariscal, M. L., and Allen, M. F. (2012), “Advanced Technologies and Data Management Practices in Environmental Science: Lessons From Academia,” BioScience, 62, 1067–1076. DOI: 10.1525/bio.2012.62.12.8.
- Horton, N. J., and Hardin, J. S. (2015), “Teaching the Next Generation of Statistics Students to ‘Think With Data’: Special Issue on Statistics and the Undergraduate Curriculum,” The American Statistician, 69, 259–265. DOI: 10.1080/00031305.2015.1094283.
- Kaplan, D. (2018), “Teaching Stats for Data Science,” The American Statistician, 72, 89–96. DOI: 10.1080/00031305.2017.1398107.
- Kelling, S., Hochachka, W. M., Fink, D., Riedewald, M., Caruana, R., Ballard, G., and Hooker, G. (2009), “Data-Intensive Science: A New Paradigm for Biodiversity Studies,” BioScience, 59, 613–620. DOI: 10.1525/bio.2009.59.7.12.
- Kitzes, J., Turek, D., and Deniz, F. (2018), The Practice of Reproducible Research: Case Studies and Lessons From the Data-Intensive Sciences, Okland, CA: University of California Press.
- Lai, J., Lortie, C. J., Muenchen, R. A., Yang, J., and Ma, K. (2019), “Evaluating the Popularity of R in Ecology,” Ecosphere, 10, e02567. DOI: 10.1002/ecs2.2567.
- Manyika, J., Chui, M., Brown, B., Bughin, J., Dobbs, R., Roxburgh, C., and Byers, A. H. (2011), “Big Data: The Next Frontier for Innovation, Competition, and Productivity,” Technical Report, McKinsey Global Institute.
- McNamara, A. (2018), “Imagining the Future of Statistical Education Software,” in Proceedings of the 10th International Conference on Teaching Statistics (ICOTS).
- Miles, M. B., Huberman, A. M., and Saldana, J. (2014), Qualitative Data Analysis: A Methods Sourcebook (3rd ed.), Thousand Oaks, CA: SAGE.
- Mislan, K., Heer, J. M., and White, E. P. (2016), “Elevating the Status of Code in Ecology,” Trends in Ecology & Evolution, 31, 4–7.
- Morrison, C., Wardle, C., and Castley, J. (2016), “Repeatability and Reproducibility of Population Viability Analysis (PVA) and the Implications for Threatened Species Management,” Frontiers in Ecology and Evolution, 4, 98. DOI: 10.3389/fevo.2016.00098.
- National Academies of Sciences, Engineering, and Medicine (2018), Data Science for Undergraduates: Opportunities and Options, Washington, DC: The National Academies Press.
- Nolan, D., and Perrett, J. (2016), “Teaching and Learning Data Visualization: Ideas and Assignments,” The American Statistician, 70, 260–269. DOI: 10.1080/00031305.2015.1123651.
- Nolan, D., and Temple Lang, D. (2010), “Computing in the Statistics Curriculum,” The American Statistician, 64, 97–107. DOI: 10.1198/tast.2010.09132.
- Nolan, D., and Temple Lang, D. (2015), “Explorations in Statistics Research: An Approach to Expose Undergraduates to Authentic Data Analysis,” The American Statistician, 69, 292–299.
- O’Neill, D. K. (2012), “Designs That Fly: What the History of Aeronautics Tells Us About the Future of Design-Based Research in Education,” International Journal of Research and Method in Education, 35, 119–140.
- Powers, S. M., and Hampton, S. E. (2019), “Open Science, Reproducibility, and Transparency in Ecology,” Ecological Applications, 29, e01822. DOI: 10.1002/eap.1822.
- Ross, Z., Wickham, H., and Robinson, D. (2017), “Declutter Your R Workflow With Tidy Tools,” Technical Report, PeerJ Preprints.
- RStudio Team (2015a), RStudio Cloud, Boston, MA: RStudio, Inc.
- RStudio Team (2015b), RStudio: Integrated Development Environment for R, Boston, MA: RStudio, Inc.
- Strasser, C. A., and Hampton, S. E. (2012), “The Fractured Lab Notebook: Undergraduates and Ecological Data Management Training in the United States,” Ecosphere, 3, 1–18. DOI: 10.1890/ES12-00139.1.
- Teal, T. K., Cranston, K. A., Lapp, H., White, E., Wilson, G., Ram, K., and Pawlik, A. (2015), “Data Carpentry: Workshops to Increase Data Literacy for Researchers,” International Journal of Digital Curation, 10, 343–353. DOI: 10.2218/ijdc.v10i1.351.
- Theobold, A., and Hancock, S. (2019), “How Environmental Science Graduate Students Acquire Statistical Computing Skills,” Statistics Education Research Journal, 18, 68–85.
- Theobold, A. S., Hancock, S. A., and Mannheimer, S. (2020), “Data From: Designing Data Science Workshops for Data-Intensive Environmental Science Research,” Dryad, available at DOI: 10.5061/dryad.7wm37pvp7.
- Thomas, W., and Naupaka, Z. (eds). (2016), “Software Carpentry: R for Reproducible Scientific Analysis.” Version 2016.06, available at https://github.com/swcarpentry/r-novice-gapminder.
- Wickham, H. (2014), “Tidy Data,” The Journal of Statistical Software, 59, 1–23. DOI: 10.18637/jss.v059.i10.
- Wickham, H. (2016), ggplot2: Elegant Graphics for Data Analysis, New York: Springer-Verlag.
- Wickham, H., Averick, M., et al. (2019), “Welcome to the tidyverse,” Journal of Open Source Software, 4, 1686. DOI: 10.21105/joss.01686.
- Wickham, H., and Grolemund, G. (2017), R for Data Science, Sebastopol, CA: O’Reilly.
- Wickham, H., and Henry, L. (2018), “tidyr: Tidy Messy Data,” R Package Version 0.8.0.
- Wickham, H., Romain François, R., Henry, L., and Muller, K. (2018), “dplyr: A Grammar of Data Manipulation,” R Package Version 0.7.5.
- Wilson, G. (2006), “Software Carpentry: Getting Scientists to Write Better Code by Making Them More Productive,” Computing in Science & Engineering, 8, 66–69.
- Wilson, G., Alvarado, C., Campbell, J., Landau, R., and Sedgewich, R. (2008), “CS-1 for Scientists,” in Proceedings of the 2008 Special Interest Group on Computer Science Education (SIGCSE), ACM, pp. 36–37.
- Wing, J. (2006), “Computational Thinking,” Communications of the ACM, 49, 33–35. DOI: 10.1145/1118178.1118215.
- Word, K. R., Jordan, K., Becker, E., Williams, J., Reynolds, P., Hodge, A., Belkin, M., Marwick, B., and Teal, T. (2017), “When Do Workshops Work? A Response to the ‘Null Effects’ Paper From Feldon et al.,” Technical Report, Software Carpentry.
- Zhian N. Kamvar. (2018), “datacarpentry/R-ecology-lesson: Data Carpentry: Data Analysis and Visualization in R for Ecologists,” Ana Costa Conrado, M.V. F. Auriel, S. Brian, and M. Francois, eds.