ABSTRACT
Revisiting the seminal 2010 Nolan and Temple Lang article on the role of computing in the statistics curricula, we discuss several trends that have emerged over the last ten years. The rise of data science has coincided with a broadening audience for learning statistics and using computational packages and tools. It has also increased the need for communication skills. We argue that, for most of this audience, instruction should focus on foundational concepts and the early introduction of different types of data and modern methods through the use of interactive learning environments without programming prerequisites. We then describe Integrated Statistics Learning Environment (ISLE), a web-based e-learning platform and lesson authoring framework for teaching statistics. Built on top of computing and peer-to-peer technology, the platform allows collaborative data analysis and real-time interactions in the classroom. We describe how ISLE contributes to the three key Nolan and Temple Lang components: broadening the statistical computing curriculum, deepening computational reasoning and literacy, and expanding computing with data in the practice of statistics. We then present several advantages of using a computing-integrated environment such as ISLE, including promoting (cross-disciplinary) communication, supporting classroom-focused integrated development environments, and advancing the science of data science.
1 Introduction
Revisiting “Computing in the Statistics Curricula,” the 2010 seminal article from Nolan and Temple Lang, we were struck by the authors’ prescient call for the field of statistics to evolve in the face of a changing reality—the increasing availability and power of computing hardware and software. They observe that a computing-illiterate “statistics [field] will become marginalized and less relevant at a time when its importance is growing dramatically” (Nolan and Temple Lang Citation2010, p. 100). Hence, they propose a portfolio of computational skills, tools, and techniques as part of a foundation for statistical training that prepares new statisticians for a computing-intensive world. The continuing impact of their call is clear. Statistics curricula guidelines have been updated with a more computational flavor, and many intermediary statistics courses now teach more advanced computational methods, programming with R, and practical engagement with large or complex real-world datasets (Hardin et al. Citation2015; GAISE College Report ASA Revision Committee Citation2016).
But reality continues to change, and again the field needs to evolve. Indeed, Nolan and Temple Lang quoted Hartigan’s choice of the S language and the Internet as the greatest contributions to statistics over the last 40 years (Barry Citation2005). These are not statistical methods or theoretical results but rather tools that transcend any particular kind of analysis or application.
The increasing availability, ubiquity, and richness of data are driving developments across society. The rise of data science, machine learning, and artificial intelligence has spurred new ideas—and the reconsideration of old ones—for algorithmic data analysis. And with open source software and the Internet, a vastly broader range of people is regularly engaging with data and data analysis in their work and everyday life.
While we concur with the overall diagnosis of Nolan and Temple Lang, we wonder whether sophisticated computational armament should be the focus for all statistics students and practitioners. Nolan and Temple Lang asked “When they graduate, what ought our students be able to do computationally?” Given how quickly the computing landscape evolves, answering this question becomes more about predicting a moving target. In addition, it is becoming far more common for students and practitioners to rely on machine learning frameworks and computing packages (e.g., TensorFlow or scikit-learn) to handle optimization and algorithm implementation. In our experience, students have far more difficulty with choosing an appropriate computing framework/package that aligns with correct model assumptions (often landing on whichever one runs without crashing), debugging and understanding any errors (or just switching to something that runs without crashing), and interpreting and communicating their analytical results (which must be right because the coderan without crashing). In today’s landscape, while we need highly trained specialists to develop sophisticated algorithms and support research in high-performance computing, the more troubling challenges for the larger generalist statistics community seem to be rooted in communication, the use of computing tools, and proper interpretation of what those tools produce—issues that will only grow with further statistical software advancement and democratization of data analysis.
In parallel, we are facing classroom and program demands at previously unseen levels. Large numbers of students will take one or two statistics/data science courses before moving into other specializations where they will use and interpret results from statistical computing tools. Similarly, many students in our majors and graduate programs will find their way into data analyst/scientist roles with a larger need for strong communication and presentation skills rather than becoming computational experts in industry or research institutions. Coupled with the extensive growth in on-the-job “upskilling” or executive education training programs to improve comprehension and use of statistical methods, the need to build and provide educational training for the use of statistical computing tools and packages is overwhelming.
We find ourselves facing another possible refinement of the originally posed question: “When they graduate, what should our students be able to use and communicate?” In light of this, how can we develop computing tools and curricula to better support these larger, more diverse audiences? And where do we start? For us, the answer is back at the beginning—when students are first exposed to data.
The 2016 Guidelines for Assessment and Instruction in Statistics Education (GAISE), a benchmark report focusing primarily on recommendations for introductory level material and courses, does not discuss statistical computing (GAISE College Report ASA Revision Committee Citation2016). In fact, the word “computing” occurs only three times in the 141-page document, two of which are in the appendices. This is not to disparage the GAISE report, which is excellent, but to highlight that the question of how to incorporate statistical computing at the introductory level is still open. At first glance, it is common to associate introductory level computing with learning to program and, as such, not a good fit for the introductory statistics course. However, we argue that based on computing technology and principles, it is possible to build tools that give students exposure to GAISE-recommended skills—such as multivariable thinking, handling data of various types and complexity, active learning, open-ended data analysis and inquiry, and working in collaborative environments—while conceptually introducing them to statistical computing in a structured way that supports building deeper skills for those who continue studying statistics and/or data science. This approach is also in line with several recent data science reports and white papers that have heavily emphasized the importance of integrating computing, data analysis, statistical theory, and communication (GAISE College Report ASA Revision Committee Citation2016; De Veaux et al. 2017; National Academies of Sciences, Engineering, and Medicine Citation2018; ACM Data Science Task Force Citation2019).
For the past four years, we have been developing the Integrated Statistics Learning Environment (“ISLE”), an e-learning platform and authoring framework for building lessons and material for teaching statistics and related disciplines. Built on top of web technologies and incorporating modern computing libraries, ISLE strives to lower the barrier for students to learn computational reasoning in the context of data analysis, directly addressing Nolan’s and Temple Lang’s three main considerations: how to broaden statistical computing, deepen computational reasoning and literacy, and teach computing with data in the practice of statistics. By also heavily relying on peer-to-peer technology to facilitate collaboration between students and group activities, we strive to, in the words of Nolan and Temple Lang, develop “our students into discerning, critical-thinking active participants of an emerging data-driven society” (p. 100). In an age where everyone is a data scientist, this imperative extends well beyond our own students to society at large.
2 Integrated Statistics Learning Environment (ISLE)
The “ISLE” is a powerful, flexible, and extensible e-learning platform that supports the creation, presentation, and dissemination of instructional materials. It includes a wide variety of interactive learning activities and queries, and it is built on top of and infused with statistical computing and modern information technology.1 A central objective of ISLE is to foster data reasoning and communication. Bringing computing/computational reasoning into the curriculum is a part of that. ISLE responds to the 2016 GAISE report recommendations for the use of technology and aligns with instructor recommendations centered on material and content (GAISE College Report ASA Revision Committee Citation2016). For example, instructors should “view the primary goal as discovering concepts rather than covering methods,” rely upon “large real, datasets,” cover statistical graphics “including relatively recent innovations like motion charts and maps,” “perform simulations to illustrate abstract concepts,” confront students with “what happens if…” questions, and teach them report writing. Furthermore, they should look for “real-time response systems for formative assessment” and use “virtual environments to engage students, teach concepts, and gather data” (GAISE College Report ASA Revision Committee Citation2016, pp. 19–21). These and more are highlighted throughout the article.
As a web-based platform, ISLE runs natively in all modern web browsers and by extension on all operating systems. The interface also works on mobile devices and tablets with future responsive design work to be done.2 Because it is based on Internet technologies, instructors and students can use ISLE without having to download and install any software packages. Instead, they simply navigate to a website URL in their web browser. In addition, instead of having to download datasets and then try to upload them into a desktop application or statistical software, students have the option of directly navigating to locations with preloaded data. To also serve students accessing lessons via low-bandwidth or disrupted Internet access or through costly data plans, it is possible to download and save all lessons for offline work. We have assessed ISLE to affirm conformance to most of the World Wide Web Consortium’s Web Content Accessibility Guidelines (W3C WCAG 2.4). This conformance is inclusive of all Level A criteria, and includes support for leading practices on contrast, focus, labeling, name inputs, audio controls, native captioning, and design of non-text content. In developing ISLE, we prioritize accessibility and an easy entry for novice users such that they can immediately engage with data, two key attributes for a modern statistical computing tool (McNamara Citation2019).
To give a quick overview, ISLE allows for
rich and easy interactions between students and instructors during class; an example is an interface for students to enter questions and feedback in real time combined with statistical tools (e.g., clustering) that automatically analyze these textual data to give the instructor a representative view of the students’ understanding; students see statistical computing used to analyze their responses.
hands-on data analysis projects (including collaborative work in groups and peer-review activities). Students from diverse computing backgrounds can immediately work with real-life data and perform arbitrary data analysis workflows from start to finish (data import to report writing) using a simple interactive interface. Students practice cleaning data and transforming variables, and they learn how to create publication-quality visualizations and reports (including posters and presentations) to convey their message.
simulations and other computational widgets, through which students learn about statistical concepts and modeling without having to code from scratch. For example, students analyze presidential speeches using common text mining techniques (stopword removal, stemming and other preprocessing steps, as well as word clouds and word frequency analysis).
integrated chat, audio, and video stream communication for all students in a lesson, among specified subgroups, or in pairs—useful to facilitate approaches like peer instruction (Crouch and Mazur Citation2001) and think-pair-share in a remote teaching context. Once inside the lesson, students can directly communicate. Instructors can create groups randomly or according to criteria (e.g., answers from previous questions or lesson progress) and reform or dissolve groups as needed.
the creation of new lessons from basic building blocks using composable and customizable components with an accompanying authoring tool, the ISLE editor.3 Through this, we aim to establish an open ecosystem of community contributions where it is simple for instructors to share and pull in material from others.
ISLE is released under an open-source license. The reasons for this decision are manifold: First, we want to augment statistical classroom instruction across institutions. Second, we believe that a vivid discourse among instructors (which implies the exchange of learning materials and best practices) helps to improve statistical teaching which we deem quintessential in a time where many disciplines seek to adopt statistical reasoning. Third, we believe that ongoing communication between a multitude of users and developers is instrumental for the continuous improvement of ISLE and the construction of innovative pedagogical modules. The system is extensible, making it easy to develop, use, and share new components, widgets/tools, activities, and lessons. This extensibility broadens the use-cases of the platform and fosters its long-term viability.4
Here, we underscore one of the guiding principles of ISLE: communication. While the tool supports and promotes early practice with communicating statistical concepts via student-driven data inquiry, collaborative data analysis, and reports/presentations, it also enhances synchronous and asynchronous communication among users: students, who can exchange views and work together in small groups; instructors and students through video, audio, text, feedback mechanisms; and the instructors themselves, who can share their work and ideas in the ISLE community ecosystem. Taking a step toward McLuhan’s prescient vision of a “classroom without walls” (McLuhan Citation1960), computing becomes a medium of instruction that allows for a richer set of activities and learning research opportunities.
The following sub-sections highlight some of the main components relevant to the context of this article.
2.1 The Data Explorer
The data explorer is a tool devised to “relieve both students and teachers of the drudgery of computational tasks” (GAISE College Report ASA Revision Committee Citation2016, p. 71) and to let them focus on conceptual statistical reasoning and the analysis of real-life data (Recommendations 2 and 3, GAISE 2016). However, we also aim to abstract away the steep learning curves commonly associated with learning a new programming language or mastering a complex interface with hundreds of options. We strive for a minimalist, contextual interface that only exposes the functionality that a user might look for. With the data explorer, the instructor is in a position to adaptively select which functionality is available to the students. Besides the most common hypothesis tests, statistical methods, and summary statistics, the data explorer has additional functionality for basic data cleaning and data/variable transformations.
Students without any programming experience can practice their data-analysis skills on real-world datasets, formulate hypotheses and conduct a scientific analysis from start to end (Recommendation 1A, GAISE 2016). They can analyze prefabricated datasets, but the tool also handles upload of custom datasets in the CSV format. contains a screenshot of the data explorer in action. A spreadsheet tabular display presents students with a direct, manipulatable view of the data, which can be easily filtered and sorted. All involved statistical calculations are executed in the web browser on the student’s computer, so that hundreds of students can work on projects at the same time without burdening the server.
Fig. 1 Source and preview window of the lesson authoring tool. All entered content renders immediately in the live preview, and one can alter existing lessons and templates to adjust them to one’s needs. The editor offers several usability features to make the process of writing lessons easier, including autocompletion, tooltips, and drop-down and configuration menus for inserting components. Here the (opened) drop-down window is used to easily insert any of the configurable ISLE components. A WYSIWYG (What You See Is What You Get) editing mode inside the preview pane allows one to alternatively build lessons without the source view by inserting and customizing attributes through component-specific graphical interfaces.
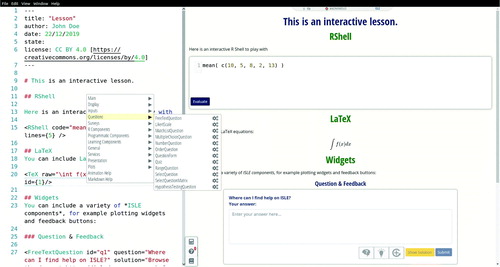
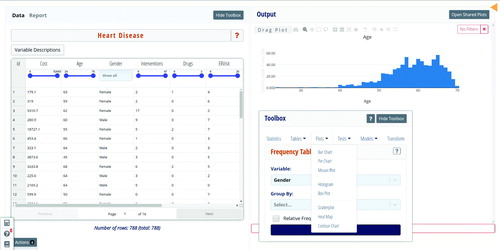
Fig. 2 Screenshot of a data explorer on heart disease. Using the data exploration tool, students (either alone or collaboratively) can generate plots, calculate summary statistics, fit statistical models, and run hypothesis tests. The tool also facilitates data cleaning and transformation of variables and includes a report writing tool, with which students can create data analysis reports (and scientific posters) without having to switch between various tools.
Using modern peer-to-peer messaging technology, we facilitate communication and the fundamentally collaborative process of data science (Roseth, Garfield, and Ben-Zvi Citation2008), both key concepts in developing data acumen (National Academies of Sciences, Engineering, and Medicine Citation2018). Using the embedded group functionality in ISLE, which allows instructors to assign students to groups in a variety of ways (randomly, based on their lesson progress or prior class actions), students can also work together on shared reports. The platform also comes with a peer-review mode, in which students are assigned to comment on each other’s work and then potentially use the feedback to revise their work, mimicking the scientific review process. Plots, tables, and other output can be easily dragged into the reports, which are immediately rendered without any further editing (although Markdown syntax is supported).
As one illustrative example of in-class interactions supported by ISLE, we built a lab activity during which students are given a research question. They analyze a corresponding dataset for a set amount of time, usually between 10 and 15 min, and produce, say, a visualization highlighting their findings utilizing the built-in univariate and multivariate graphing tools (barcharts, boxplots, histograms, scatterplots, heat maps, mosaicplots, etc.). They can further manipulate and customize the plots by adding a title, changing axis labels, hiding and highlighting specific variables, etc. Plot interactivity also includes zoom-in capability to highlight specific areas, tooltips with further information when hovering over individual data points, and observation selection on the plot for further inspection in the linked data table. This type of capability allows instructors to introduce multivariable thinking to students early and easily (Recommendation 1B, GAISE 2016).
Once satisfied with the initial result, students (anonymously) share their plots with the class, a prespecified subgroup of students, or a randomly selected person (depending on instructor preference) for further discussion and/or feedback, allowing for revisions. In this exploratory data analysis activity, students become familiar with the data, examine it and learn from other interpretations, and reach a conclusion. By doing this, they encounter the general multiperspectivity of data as well as the additional social dimension of communicating with and about data.
In line with recommendations by McNamara (Citation2019) and the GAISE College Report ASA Revision Committee (Citation2016), one of the goals of the data explorer is to provide flexible and interactive plots (along with commonly used statistical hypothesis tests and models) with inherent documentation on available functionality and to facilitate a cycle of exploratory and confirmatory data analysis. However, we do not limit this cycle to the undertaking of a lone statistician, but view it as a potential collective enterprise in which individuals are exposed to the different perspectives and actions that analysts might take toward the same question. In our introductory class, for example, students visualize, model, and analyze data from the influential “Many analysts, one dataset” crowdsourcing article by Silberzahn et al. (2018) describing variation in results when modeling racial discrimination by soccer referees. The students work in collaborative small groups with instructor-assisted discussion and peer review stages, gaining first-hand experience in how data analyses can change given one’s preconceptions, biases, and initial decisions. This type of activity also emphasizes the importance of analysis documentation and data provenance, helping us extend McNamara’s (Citation2019) ninth key attribute centered on communicating results through online publishing and reproducibility. When polled, the majority of students indicated that the platform helped them to work together.
While the data explorer tool does provide options for filtering observations, recoding and transforming variables, and the like, at the conceptual level, we tend to limit (but not remove) data wrangling and tidying to provide more room for engaging with research scenarios from hypothesis generation to dissemination of results. While preprocessing and cleaning data consumes nontrivial time for any applied statistician, we believe that, particularly at early levels, conceptual engagement with data should begin with questions related to hypothesis generation, data collection, analysis, and interpretation followed by subsequent more technical training in managing data. Other instructor choices could be made, of course.
2.2 The Response Visualizer and Sketchpad
The sketchpad component helps to improve communication between students and instructors. With the sketchpad, instructors can load lecture slides in PDF format to a web interface, where they can be overlaid with any interactive ISLE components. Slides can be annotated using a drawing tablet or device with touch support; the tool offers a variety of brush colors and sizes. The sketchpad can and has been used for both in-class and remote lectures. Annotations, which are transmitted live from the instructor to all present students, are saved in the cloud and can be retrieved after class simply by opening the respective lessons. Edits made after class by the instructor propagate to all students. Since research has shown higher retention of class material when students take notes themselves (Kiewra et al. Citation1988), students are also encouraged to add their own annotations to the slides and are able to toggle the instructor annotations on and off.
A screenshot of the sketchpad is displayed in . Instructors often face the challenge that most students in a class stay quiet, and only a very small minority will actively participate (an observation that is only exacerbated when teaching remotely). This can make it very hard to gauge how well the audience is understanding the presented material, with the potential effect that misconceptions might go unnoticed or the instructor proceed too quickly. By overlaying ISLE question components or feedback buttons on individual slides, instructors can gather student feedback and question responses, allowing them to assess student learning and detecting areas in which students feel insecure without pressuring the students to self-identify in front of the class. And indeed, prior research on systems with computer-mediated feedback has shown enhanced student-teacher interactions (Anderson et al. Citation2003).
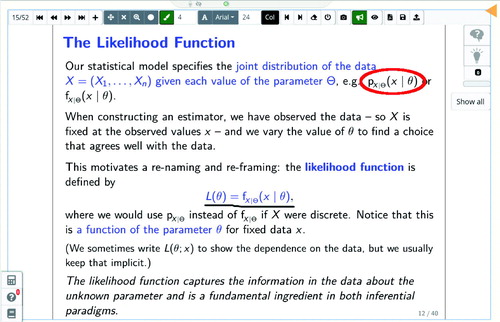
Fig. 3 Screenshot of a sketchpad component for annotating lecture slides. Slides can be overlaid with other interactive components such as questions, data explorers, or simulation widgets.
Instructors are quickly able to understand class progress and adjust instruction if necessary. Prompting students for feedback not only helps the instructor, but also gives the students opportunities to reflect on the discussed material. Instructors can poll students and create on-the-fly surveys (free-text, numeric, multiple-choice) even during the lecture itself, and the collected data may be analyzed and discussed (a suggested way to “foster active learning and integrate real data with a context and purpose” per the GAISE College Report ASA Revision Committee (Citation2016) recommendations, p. 131).
Classroom or audience response systems, colloquially called clickers, are a popular tool to increase student engagement in lectures with many students. There is evidence that clickers foster active learning and improved interactions between students and teachers (Roschelle, Penuel, and Abrahamson Citation2004). Most clickers in use today allow just a few fixed choices or basic numeric entry. Typically, students’ answers are displayed in aggregate in a histogram or bar chart. While this feedback can be useful, the information is fundamentally limited. Echoing an analogous approach Gelman and Nolan (Citation2002) successfully employed in an introductory statistics course, we believe that there is more potential in such systems, including richer response types and more meaningful interactions.
The ISLE response visualizer goes beyond the conventional clicker insofar as it provides the instructor not only with numeric or multiple-choice entries, but with free text, matched pairs, and other types of data input. Besides enriching in-class instruction through student engagement and active learning exercises (Recommendation 4, GAISE 2016), for example, think-pair-share, the response visualizer allows the instructor to monitor classroom activities in real-time (e.g., how many students have answered a question or finished an activity). This way, instructors can gain information about how well they have conveyed their messages to shyer students. They may also collect student feedback to decide on material to explain in depth or whether to slow down or speed up while giving a lecture. Since the interactions and answers are persistently stored, instructors can use the response visualizer as a post-class analysis tool.
The response visualizer window is split into two parts: On the left-hand side, a list of all user actions collected for the respective component is displayed. The right-hand side shows the visualization of student responses in the form of a histogram and frequency table for numeric responses, a bar chart for multiple-choice questions, or a word-cloud for free-text questions. This latter aspect is particularly useful as it allows the students to interact with responses beyond numbers and categories and think more open-endedly about unstructured data we often see in real world problems.
Currently, the (default) word cloud displays the most frequent terms appearing in the students’ answers. It is constructed by tokenization of the terms in the student responses, filtering out stopwords and the words of the question itself. With just a few glances, a user should be able to determine one or more themes. However, the goal is not just data summarization: Instead, we engineered the component in a way to make it easier for the instructor to pull up individual student answers. For example, the individual words of the word cloud are clickable to filter the view to only the text entries containing the respective words. Having this type of linked view renders both macroscopic and microscopic perspectives at the discretion of the students and instructor.
One challenge for instructors when using the response visualizer in real-time is that they must quickly get a sense of the distribution of student answers to be able to provide targeted feedback. While this is relatively easy for multiple-choice or number questions where a frequency table of answers is readily displayed, it is much harder for free-text questions. It is not feasible for an instructor to quickly read many answers before deciding how to proceed. To help instructors in the process, the response visualizer includes a sequential clustering procedure to group similar answers together. displays the resulting groupings for synthetic free-text answers to an example question on the distribution of a quantitative variable.
Fig. 4 Screenshot of (hypothetical) student answers to a question asking them to describe the distribution of data in a boxplot. Answers are clustered using real-time k-means as they arrive in class.
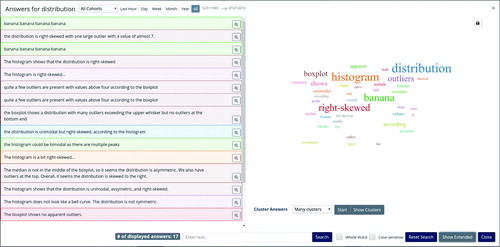
Data arrive in real-time, and thus a main requirement is to implement a pipeline that works incrementally so that cluster assignments can be updated as new data come in. As a result, we implemented spherical k-means, a standard algorithm for text clustering—equivalent to using the k-means algorithm with cosine similarity after standardization of data (MacQueen Citation1967), which allows updating. Via a dropdown menu, instructors can easily switch between model results for varying numbers of groups. They can also pull representative documents for any cluster (ranked by their distance to the cluster centers) by clicking on the clusters in a two-dimensional scatterplot (after the centers are reduced to two dimensions).
This example of using real-time statistical analysis in ISLE illustrates how computing technology can be leveraged to improve classroom interaction and communication. Since the sketchpad and response visualizer work both synchronously and asynchronously, they can be used in the learning environments discussed in the 2016 GAISE report: Small and large classes, flipped (inverted) classes, and distance learning.
2.3 ISLE in the Landscape of Statistical Computing Tools
With R being the predominant programming language for statisticians and RStudio having become the de facto standard integrated development environment (IDE) for R (RStudio Team Citation2020), it is perhaps not too surprising that significant effort has been undertaken to improve its use in the classroom, for example, through R notebooks and R presentations. The Mosaic project, started in 2009, provides teaching materials for R with a focus on exploratory data analysis and modeling instead of programming (Pruim, Kaplan, and Horton Citation2017). Similarly, the RStudio IDE, first released in February 2011, made working with R significantly easier. While RStudio and the Tidyverse of packages by Wickham et al. (Citation2019) have streamlined the process of working with data considerably, there is still a sizeable audience who prefers to use graphical user interfaces (GUIs) over having to program.
This demand has given rise to projects like iNZightVIT,5 which provides a desktop application and web interface with a GUI around R for data visualization, analysis, and visual inference (Forbes et al. Citation2014). JMP,6 Minitab,7, and Statcrunch8 are other widely used GUI-based tools in introductory statistics courses. The rise of new job profiles like that of data journalist signal that interacting with and analyzing data are skills that transcend traditional quantitative disciplines. Tools like Concord Consortium’s interactive CODAP9 platform, a successor to their influential Fathom platform (Finzer Citation2000), target school-aged children and high school students, emphasizing statistical and data science concepts and data moves (Erickson et al. Citation2019) without requiring programming.
ISLE is well-positioned in this landscape given its focus on interacting with and analyzing data without having to code. It incorporates many features pioneered by the available statistical computing tools and was born out of the desire to improve upon these through better integration into a teaching context. Its main departure from the above statistical computing tools lies in its broader scope and its aim to provide general facilities for e-learning and remote instruction (evidenced by its use in data-free courses as well as the humanities at our institution). The focus on enabling real-time communication between students and instructors alike (e.g., via surveys & polls, video & text chat, and group work) enables data analysis activities that mirror team-based work and focus on the communicative nature of statistics. Finally, the platform provides basic features of a learning management system (LMS) including progress tracking, action logs, and student and instructor dashboards.
summarizes and compares the characteristics of several common statistical computing tools. The table is split into three parts, the first five rows covering different functionality related to data analysis, the next three being about salient features about the tool itself, and the remainder being concerned with advanced functionality commonly found in other tools such as conferencing tools or LMS systems.
Table 1 Comparison of ISLE with other selected software commonly used for teaching statistics.
This particular set of features is a combination of common characteristics of statistical computing tools/platforms used in statistics courses for broader audiences and many features associated with virtual learning environments (Dillenbourg, Schneider, and Synteta Citation2002). As such, since ISLE was explicitly conceived as a “learning environment,” it satisfies both sets of criteria. The open nature of our tool has led to the platform being written in a peer-to-peer architecture from the outset, not so much as an application but as a space of possibilities: a tool for creating blended learning content and facilitating social interactions. The other statistical computing tools, while excellent, were not initially designed with this goal in mind.
For the student, the dashboard may serve as a navigation book for the personal achievements in one’s courses. Students can revisit course lessons and study their answers as well as personal annotations. This amassed material can be accessed beyond the duration of the course. Data analyses and reports may be used by the students as part of their portfolios, and downstream ISLE courses can link students’ directly to their own work in upstream ISLE courses.
Students can upload their own data to ISLE’s custom data explorer (which comes with functionality extending well beyond the contents of the introductory course) and write data analysis reports and presentations, which can be shared either as HTML documents or *.pdf files.
Since the main focus lies on the conceptual part of data reasoning, when students switch to another statistical tool (in our or another discipline), ideally the concepts are not forgotten, and the focus is merely on the use of another package. This is already common practice at our university. After the introductory course with ISLE, students start to learn R, SAS, SPSS, etc. (depending on major)—already acquainted with the underlying statistical concepts as well as the visualizations, models, and standard output tables.
It is also possible to ease the transition from using the data explorer to programming in R through display of respective interactive R code for methods and procedures that the students by then will be accustomed to. For example, after teaching students how to run regression models in ISLE, an interactive shell can display code that estimates the same model in R (which the students can try out either directly in the platform or in, say, RStudio after exporting the data from ISLE).
Using ISLE, instructors can deliver rich, interactive lectures, assign work synchronously or asynchronously to groups or individuals, communicate with their students through multiple modalities, and track student progress in real time as well as conduct research. Even after students have mastered programming languages (e.g., R) and more advanced data science skills, ISLE can be used to both teach and research topics such as writing about data, optimal collaboration on data science problems, and other crucial professional development skills.
3 Revisiting Nolan’s and Temple Lang’s Three Key Components
As their first consideration, Nolan and Temple Lang argue to broaden statistical computing from a narrow focus on numerical algorithms to encompass all information technology that practising statisticians work with. It is folk wisdom that 80% of a data analyst’s time is spent on collecting, cleaning, and organizing data and only 20% on analysis. Adopting a view on statistical computing that incorporates the 80% that were historically more neglected in a traditional introductory statistics class is only sensible and has been increasingly adopted over the last decade. Questions of how to access and transform data, query databases, and also “the presentation of information, results, and conclusions in rich, dynamic ways” have made their way into the modern statistics course (Nolan and Temple Lang Citation2010, p. 99).
But this expansion comes with a price: When one is expected to teach not only traditional statistics, but also tools for collecting data from the Internet as well as how to work with large amounts of data, use modern statistical methods, analyze novel data types that do not neatly follow the tabular structure of the spreadsheet, and create engaging presentations, then something has to give. In the literature, there has been an ongoing debate about which materials of the statistics course sequence can be scrapped (Cobb Citation2015).
A second issue is that the field of information technology is rapidly changing. Thus, there is no guarantee that the tools taught today will still be around in the next decennial. A case in point: The 2010 article by Nolan and Temple Lang references dying technologies such as Flash and does not mention other tools, several of which have gained massive popularity only in the last ten years (such as NoSQL databases or the JSON file format, which is nowadays more commonly used than XML). It is to be expected that the next decennial will likewise hold many surprises in this regard, and it is almost guaranteed that some of today’s dominant technologies will lose popularity in the future. Obviously, Nolan and Temple Lang were aware of this challenge, which is why they stressed that instructors should focus on programming fundamentals and paradigms as well as teaching students how to acquire the necessary skills on their own (e.g., via StackOverflow or reading project documentation). They elaborated on this in their call to deepen computational reasoning and literacy. To save students from picking up bad practices and misconceptions, they advocated for purposely teaching computing fundamentals instead of solely relying on students to pick up things on their own as they work through a course. It would be interesting to look back and see how many statistics programs have managed to accomplish this task over the last ten years. While computing is now undoubtedly an integral part in many statistics courses even at the introductory level, we venture a guess that students are still often asked to pick up programming concepts on their own. At the end of their section on broadening statistical computing, Nolan and Temple Lang stated that the “goal of teaching computing and information technologies is to remove obstacles to engagement with a problem” (p. 100). With ISLE, we try to take this one step further in our introductory statistics class: To allow students to spend more time with the problems themselves instead of the prerequisites, the platform is able to abstract away some of the obstacles. This allows instructors to focus on the important statistical concepts instead of having to worry about how to guide students through the pains of using a certain R package or tool. For example, we built an activity involving interactive text analysis of the State of the Union speeches given by U.S. presidents. The focus here is not on teaching students how to implement common text mining preprocessing steps (such as tokenization or removal of stopwords or non-alphanumeric characters, which involve special algorithms or concepts like regular expressions), but on a conceptual understanding of how the data should guide one’s steps and of the implications of one’s decisions on the resulting analysis.
Letting students collaboratively analyze such data without stress and via an accessible platform allows them to engage with the issues, to gain practical experience, and to become motivated to learn more about statistics. In follow-up courses, they can delve deeper into specifics and become acquainted with the various tools of the applied statistician. When entering these courses, they will be better equipped as they already understand the importance of analysis workflows and how statisticians work with various types of data. Hence, the goal is to lay a foundation so that students can be (more) successful later when taking classes focused on statistical computing. But we do not wish to imply that the platform is only useful in foundational courses: While some tools like the data explorer might not be applicable for a programming-focused course, other components can be leveraged to, for example, scaffold programming exercises or to visualize algorithms.
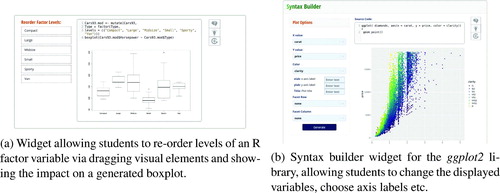
Finally, in computing with data in the practice of statistics, Nolan and Temple Lang made the plea to teach statistical “computing in the context of solving scientific problems through data analysis” (p. 101). We do not teach programming in our introductory course so that we can focus on the core competencies of our discipline and how to make sense of data. But we do lay a foundation for computational thinking by introducing students to the concepts through simulations and exposure to relevant problems such as interactive parameter tuning, for example, with heat maps and nonparametric smoothers. Without having to code, students still learn about concepts like training/test sets or parameter optimization from the vantage point of data analysis, while at the same time gaining intuition for their implementation. To that end, ISLE also allows easy construction of widgets that can display underlying R code used to generate outputs that students can specify. displays a collection of such widgets. For example, students can interact with graphs and then see the subsequent changes in the underlying code, allowing them to begin thinking about programming without first requiring mastery of syntax.
Fig. 5 Screenshots of widgets that allow students to generate a desired output through a point & click interface, while at the same time exposing the underlying R code.
In agreement with Horton (Citation2015), who made the case that “many areas of modern statistics (…) can be explored with a modicum of computing skills” (p. 144), we expose students to modern (computational) techniques and concepts, without explicitly devoting class time to teaching the syntax and practice of a programming language as a prerequisite. However, we try to cater to the different interests of the students, so that those who are more technologically inclined can dig deeper.
Nolan and Temple Lang also advocated for pooling of resources and sharing of materials, encouraging us not “to think in units of textbooks but rather smaller units that can be combined creatively into courses, for example, well-documented case studies with data that cover multiple computational and methodological topics and have open-ended extensions” (p. 104). This is an important point. From the start, we have devised ISLE with the objective in mind to make it easy for instructors to leverage the material of others and to share their own material with the community. For example, ISLE includes a repository of preloaded data explorers with documentation that are available as add-ons to any class lecture, homework assignment, or data analysis project.
In addition, ISLE materials are modular and sharable (if the creators so desire).10 To enable easy sharing, we have defined a standard but flexible file format called *.isle (essentially a simplified form of HTML documents with full Markdown support and additional, standardized tags for custom components). Topics, lessons, and even entire courses can be posted online or shared directly on the gallery of the ISLE dashboard, from which they can be copied, modified, or extended. Instructors can thus reuse, repurpose, and refine the efforts of a broad community.
We hope that these features will allow for rapid mixing of ideas and the coalescence of individuals’ efforts for common needs. This style of customization also allows flexibility in licensing for individual lessons or interactive components (e.g., through Creative Commons), so that creators maintain control of their work but can offer various privileges to foster sharing and refinement by the community.
4 Opportunities of a Computing-Integrated Environment
We have described an e-learning platform and philosophy that integrates statistical computing, data cleaning and manipulation, data analysis, statistical models, and result dissemination through written reports and presentations. Our motivations include providing a common framework, agnostic of programming language or operating system, that allows for early introduction of topics and data types that might otherwise require nontrivial prerequisite statistical computing knowledge. The computing is integrated throughout the platform’s functionality, allowing students to focus more attention on learning foundational material while still being able to tackle more modern statistical problems.
In our experience, when students are struggling with complicated statistical computing algorithms or environments, the focus quickly becomes more about whether the code compiles rather than how the code is a tool to extract meaningful, interpretable insights toward answering a research question. Too often, students devote the vast majority of time on an assignment to the coding, leaving very little time to think about the results, let alone summarize them in a well-written report. In general, incorporating more statistical computing should not come at the expense of understanding, interpreting, and communicating results generated from software packages and frameworks. Our hope is that using tools such as ISLE early will broadly improve general understanding of statistics and data science and better prepare students for learning and applying more sophisticated statistical computing skills to real world problems.
In this section, we discuss in more detail a few advantages the use of a computing-integrated environment such as ISLE can provide.
4.1 Promoting (Cross-Disciplinary) Communication
Guided by our experience during the last four years, in which ISLE has found widespread use at our university and beyond, we have come to a conclusion that might seem, at least in the context of Nolan’s and Temple Lang’s outreach, somewhat counterintuitive: namely, that the crucial skills for the future scientist do not lie in the field of computation, but in the area of communication. For example, this is rendered visible by the fact that questions of storytelling with data have entered the realm of statistics (Pfannkuch et al. Citation2010). The fact that various disciplines face the need to increase their data literacy (Khachatryan and Karst Citation2017), emphasizes this notion as well. However, it is by no means an easy task to foster data literacy and computational thinking across disciplines. For example, many learners shy away from using computing packages like R due to their assumed high entry barrier. Another stumbling block might be that many disciplines favor their own statistical environments (e.g., SPSS in psychology, Stata in economics, or Excel in business). Thus, a Tower of Babel has emerged, which deepens the gap between the disciplines. However, these communication problems are by no means inevitable. Given the Internet as a vivid example of hidden complexity, one may easily imagine a communication framework that abstracts away the cumbersome aspects of programming and thus fosters statistical literacy and cross-disciplinary communication.
In contrast to promoting the education of a programmer-statistician, we believe that the future lies, on the contrary, in a movement toward generalization—and that this goal goes together with the inner dynamics of the Internet. When each and every action, if digitized, turns into collective and globally accessible property (e.g., Wikipedia), there is no need to reinvent the wheel time and time again. Just a few specialists can provide scalable tools that an enormous number of people end up using. To put it into a simple metaphor: It would be quite unreasonable to expect novice students to excel as carpenters and put together their own chairs, chalkboards etc. It would be a better practice that an institution provides the tables and chairs, or generally speaking: a data analysis and statistical computing framework that builds an educational foundation for students in all disciplines.
For example, every statistician could devise a visualization tool from scratch (e.g., using HTML5 and Canvas, SVG graphics or WebGL). However, it seems reasonable that the novice statistician would prefer an existing, simple and easy-to-use tool. When instructors have the capability to create statistical graphics easily without coding, the class has more time available for thinking about color coding, psychological aspects of interpreting graphics, and other presentation skills a data scientist needs to successfully master. Nolan and Temple Lang stressed the need for this too: “In addition to teaching the mechanics of creating graphics, other topics include cognitive perception and aspects such as shape, size, texture and color models” (p. 105).
In recent years, we have seen an increase in the types of data statisticians analyze (from network or geolocation data to audio files or images), and we as a field are increasingly integrating such data into our courses. When teaching data visualization, instructors should familiarize students with many plot types in addition to the traditional standard displays, be it network graphs, word clouds, or geographical maps. Data visualizations are also increasingly disseminated on the Web in the form of interactive graphics or dashboards (e.g., Shiny apps) that viewers can manipulate to retrieve more specific information (via zooming-in, focusing on specific subgroups, etc.). One option would be to wait until students have mastered a certain of level of computing sophistication (e.g., ability to combine and use different packages or tools for each type of data) prior to introducing these topics. However, it might be preferable for instructors—particularly those teaching lower level classes or non-statisticians—to have these integrated into a common environment to allow for early exposure without nontrivial computing requirements.
4.2 A Classroom-Focused IDE
One of the suggested Nolan and Temple Lang topics is to familiarize students with an IDE. IDEs are commonly used for programming and software development and tend to include several disparate but connected pieces such as a source code editor, build automation tools, a debugger, version control integration, and the like. Examples of IDEs relevant to statistics would be RStudio or Jupyter. Nolan and Temple Lang argued that teaching students to work within the confines of an IDE teaches “basic practices for organizing and carrying out a project involving computing on data.”
The benefits of an integrated environment that Nolan and Temple Lang highlighted apply beyond the development of software. Our framework ISLE is indeed an integrated learning environment, designed with students’ needs and perspective in mind and designed to provide “unified practices” for instruction that improve student learning and that allow instructors to understand how well their students are learning. ISLE offers an extensible collection of useful tools, but these individual components blend together into a cohesive environment that supports many approaches to teaching and learning. This translates physical interactions into the digital space. Hence, a “classroom without walls” (McLuhan Citation1960) is established. In this regard, the acronym of an Integrated Statistics Learning Environment is quite precise. It is integral first, as the digitization of the classroom allows for group interactions (chats, group work, peer review), second, by blending the actual learning experience with an a posteriori replay, and third, by allowing nonstatisticians or students at all levels to collaboratively make use of the learning materials. Transcending the borders between academic disciplines helps provide a sustainable structure with the potential for continuous improvement and refinement.
4.3 The Science of Data Science
Having an integrated system, which collects use data in real-time (see the discussion of the response visualizer in Section 2.2), can give the instructor a sense for the variety of approaches that students deploy in exploring data, their problem solving strategies, and their misconceptions. How students approach data analysis problems, the population of their possible workflows, and the impact of early data analysis decisions (e.g., histograms vs. boxplots) on their final results are research questions that fall under the term “the science of data science.” These questions will only grow in importance as statistical reasoning diffuses into other scientific fields. Without an understanding of the distribution of possible data analysis workflows, we will be unable to assess the impact of a single study or p-value. Moreover, understanding how students with, say, different backgrounds approach data analysis will allow educators to develop adaptive strategies and approaches tailored to the student.
To facilitate research in this area, ISLE collects all kinds of use data: Events are saved to an action log with an associated time stamp. The saved actions include the answers students type into text boxes, which elements they click on, as well as what kinds of plots, statistics, and other output they generate. With user actions having turned into analyzable data, it is possible to explicitly study analysis steps and model the impact of certain actions on results. Having a complete, interactive history of student actions provides data provenance or data lineage, since the action log constitutes a record trail that allows one to retrace and replay all transformations of the data. We go further than the revised GAISE College report’s push for reproducibility, since one can observe and scrutinize the evolution of a report in its various stages. While solutions like R Markdown do offer reproducibility of reports in terms of the underlying code (Baumer et al. Citation2014), they do not offer a full history of their creation, which is a far richer source for analyzing, for example, how students write about data.
We believe such an action history also has the potential to improve assessment of students’ data analyses. Data analysis is often described as more “an art than a science,” and students are usually forced to pick up good practices on their own. Information technology can make user actions explicit and empowers graders to give personalized feedback by directly commenting on specific steps students have taken (for each artifact in a report, graders can pull up actions that were relevant for its creation).
The data from each and every lesson may be analyzed, on a microscopic as well as macroscopic level. However, ISLE is not conceived as a stand-alone tool (with just a single user in mind), but as a collective space that should foster and augment the common good. Our expectation is not that instructors will analyze their students and themselves at a fine-grain level, but that the community can build and learn from and with each other. In the long run, we are confident that the exchange of material will incite discussions among teachers—and that best practices and model solutions will be an outcome of this collective endeavor.
It seems clear that statistics education (not only of statisticians but of other disciplines or professional groups that make extensive use of data) will grow in importance. The simple question “How do we teach statistics effectively?” backed with solid data and transformed into a perpetual endeavor, encourages us to apply our own methods to our teaching and classrooms.
The scope of this article describes the motivation behind and the development of the ISLE framework, which supports evidence-based research for the effectiveness of particular lessons, pedagogical approaches, and other educational activities as dictated by the interests of ISLE users. At Carnegie Mellon University, for example, research projects are underway that make use of data collected through the platform: First, an analysis of writing about data and data analysis led by the Department of English, second, the construction and recurring application of an assessment of statistical concepts to understand the learning progress made by students in our introductory class. Other interesting research questions might include how to optimize group collaboration, the usability of the platform, or the effectiveness of remote instruction. The possible advantages of a data-driven education community are so great that we heartily accept this challenge.
Notes
1 A description of the genesis and many underlying concepts of ISLE can be found in the dissertation “Building the Data Science Laboratory: A Web-Based Framework for Modern Statistics” by Philipp Burckhardt. More information on how to integrate ISLE into one’s classes can be obtained at http://stat.cmu.edu/isle. Those interested in developing their own ISLE lessons and components or who would like to contribute to its development are advised to visit https://isledocs.com, which also contains an overview of all available components.
2 The stdlib JavaScript library for statistical and scientific computing enables real-time statistics and powers computations inside of ISLE. A modern form of edge computing (Shi et al. Citation2016), where computations are pushed to the users’ laptops or other devices, has the side-effect of drastically reducing the setup and hosting costs of ISLE lessons, as most compute-intensive calculations do not need to be performed server-side but can run directly on the machines of the students. The browser also equips us with a powerful assortment of visualization capabilities for interactive real-time graphics (HTML5 Canvas, SVG, WebGL, d3.js, etc.)
3 The ISLE editor can be used to build new lessons and reusable components, which can be shared among instructors. The editor supports Markdown syntax and rendering of LaTeX. ISLE can not only be used to create interactive labs or learning materials, but also lecture slides blending static, interactive, and online content. It is possible to use JavaScript, HTML, and CSS for full customizability. For most use-cases, it is sufficient to use the default components and options so that no programming expertise or knowledge of web technologies is required. Once finished, instructors can upload lessons directly from the editor, and make them available to their students with the click of a button.
4 McNamara (Citation2019) regards extensibility as a crucial attribute for statistical computing tools.
5 Development of the iNZightVIT project is led by Chris Wild from the Department of Statistics at the University of Auckland. See: https://www.stat.auckland.ac.nz/∼wild/iNZight
6 See: https://jmp.com
7 See: https://minitab.com
8 Now offered by Pearson Education, Statcrunch was originally developed by Webster West for use by his students. See: https://statcrunch.com
9 See: https://codap.concord.org
10 ISLE offers a variety of Creative Commons licensing options with a click, and the community ecosystem can be searched and used directly from within the editor.
Acknowledgments
The authors gratefully acknowledge the constructive feedback from the anonymous reviewers and associate editor on preliminary versions, which have helped to greatly improve the article. Any remaining mistakes are the authors’ own.
References
- ACM Data Science Task Force (2019), “Computing Competencies for Undergraduate Data Science Curricula,” available at http://www.cs.williams.edu/∼andrea/DSTF/DSReportInitialFull.pdf.
- Anderson, R. J., Anderson, R., Vandegrift, T., Wolfman, S., and Yasuhara, K. (2003), “Promoting Interaction in Large Classes With Computer-Mediated Feedback,” in Designing for Change in Networked Learning Environments, eds. B. Wasson, S. Ludvigsen, and U. Hoppe, Dordrecht: Springer, pp. 119–123.
- Barry, D. (2005), “A Conversation With John Hartigan,” Statistical Science, 20, 418–430, DOI: 10.1214/088342304000000242.
- Baumer, B., Çetinkaya-Rundel, M., Bray, A., Loi, L., and Horton, N. J. (2014), “R Markdown: Integrating a Reproducible Analysis Tool,” Technology Innovations in Statistics Education, 8, available at https://escholarship.org/uc/item/90b2f5xh.
- Cobb, G. (2015), “Mere Renovation Is Too Little Too Late: We Need to Rethink Our Undergraduate Curriculum From the Ground Up,” American Statistician, 69, 266–282, DOI: 10.1080/00031305.2015.1093029.
- Crouch, C. H., and Mazur, E. (2001), “Peer Instruction: Ten Years of Experience and Results,” American Journal of Physics, 69, 970–977, DOI: 10.1119/1.1374249.
- De Veaux, R. D., Agarwal, M., Averett, M., Baumer, B. S., Bray, A., Bressoud, T. C., Bryant, L., Cheng, L. Z., Francis, A., Gould, R., Kim, A. Y., Kretchmar, M., Lu, Q., Moskol, A., Nolan, D., Pelayo, R., Raleigh, S., Sethi, R. J., Sondjaja, M., Tiruviluamala, N., Uhlig, P. X., Washington, T. M., Wesley, C. L., White, D., and Ye, P. (2017), “Curriculum Guidelines for Undergraduate Programs in Data Science,” The Annual Review of Statistics and Its Application, 4, 15–30, DOI: 10.1146/annurev-statistics-060116-053930.
- Dillenbourg, P., Schneider, D., and Synteta, P. (2002), “Virtual Learning Environments,” in 3rd Hellenic Conference “Information & Communication Technologies in Education”, ed. A. Dimitracopoulou, Rhodes: Kastaniotis Editions, pp. 3–18.
- Erickson, T., Wilkerson, M., Finzer, W., and Reichsman, F. (2019), “Data Moves,” Technology Innovations in Statistics Education, 12, available at https://escholarship.org/uc/item/0mg8m7g6.
- Finzer, W. F. (2000), “Design of FathomTM, a Dynamic StatisticsTM Environment, for the Teaching of Mathematics,” in International Conference on Mathematics Education.
- Forbes, S., Chapman, J., Harraway, J., Stirling, D., and Wild, C. (2014), “Use of Data Visualisation in the Teaching of Statistics: A New Zealand Perspective,” Statistics Education Research Journal, 13, 187–201.
- GAISE College Report ASA Revision Committee (2016), “Guidelines for Assessment and Instruction in Statistics Education College Report,” available at http://www.amstat.org/education/gaise.
- Gelman, A., and Nolan, D. (2002), Teaching Statistics: A Bag of Tricks, Oxford: OUP.
- Hardin, J., Hoerl, R., Horton, N. J., Nolan, D., Baumer, B., Hall-Holt, O., Murrell, P., Peng, R., Roback, P., Lang, D. T., and Ward, M. D. (2015), “Data Science in Statistics Curricula: Preparing Students to ‘Think With Data’,” The American Statistician, 69, 343–353, DOI: 10.1080/00031305.2015.1077729.
- Horton, N. J. (2015), “Challenges and Opportunities for Statistics and Statistical Education: Looking Back, Looking Forward,” American Statistician, 69, 138–145, DOI: 10.1080/00031305.2015.1032435.
- Khachatryan, D., and Karst, N. (2017), “V for Voice: Strategies for Bolstering Communication Skills in Statistics,” Journal of Statistics Education, 25, 68–78, DOI: 10.1080/10691898.2017.1305261.
- Kiewra, K. A., DuBois, N. F., Christian, D., and McShane, A. (1988), “Providing Study Notes: Comparison of Three Types of Notes for Review,” Journal of Educational Psychology, 80, 595–597, DOI: 10.1037/0022-0663.80.4.595.
- MacQueen, J. (1967), “Some Methods for Classification and Analysis of Multivariate Observations,” in Proceedings of the Fifth Berkeley Symposium on Mathematical Statistics and Probability.
- McLuhan, M. (1960), “Classroom Without Walls,” in Explorations in Communication: An Anthology, eds. E. Carpenter and M. McLuhan, Boston: Beacon Press, pp. 1–3.
- McNamara, A. (2019), “Key Attributes of a Modern Statistical Computing Tool,” American Statistician, 73, 375–384, DOI: 10.1080/00031305.2018.1482784.
- National Academies of Sciences, Engineering, and Medicine (2018), Data Science for Undergraduates: Opportunities and Options, Washington, DC: The National Academies Press.
- Nolan, D., and Temple Lang, D. (2010), “Computing in the Statistics Curricula,” The American Statistician, 64, 97–107, DOI: 10.1198/tast.2010.09132.
- Ooms, J. (2014), “The OpenCPU System: Towards a Universal Interface for Scientific Computing Through Separation of Concerns,” arXiv no. 1406.4806.
- Pfannkuch, M., Regan, M., Wild, C., and Horton, N. J. (2010), “Telling Data Stories: Essential Dialogues for Comparative Reasoning,” Journal of Statistics Education, 18, DOI: 10.1080/10691898.2010.11889479.
- Pruim, R., Kaplan, D. T., and Horton, N. J. (2017), “The Mosaic Package: Helping Students to ‘Think With Data’ Using R,” R Journal, 9, 77, DOI: 10.32614/RJ-2017-024.
- Roschelle, J., Penuel, W. R., and Abrahamson, L. (2004), “Classroom Response and Communication Systems: Research Review and Theory,” in Annual Meeting of the American Educational Research Association, pp. 1–8, available at http://humansphere.com.sg/pdf/an/ClassroomResponseandCommunicationSystems.pdf.
- Roseth, C. J., Garfield, J. B., and Ben-Zvi, D. (2008), “Collaboration in Learning and Teaching Statistics,” Journal of Statistics Education, 16, DOI: 10.1080/10691898.2008.11889557.
- RStudio Team (2020), RStudio: Integrated Development Environment for R, Boston, MA: RStudio, PBC.
- Shi, W., Cao, J., Zhang, Q., Li, Y., and Xu, L. (2016), “Edge Computing: Vision and Challenges,” IEEE Internet of Things Journal, 3, 637–646, DOI: 10.1109/JIOT.2016.2579198.
- Silberzahn, R., Uhlmann, E. L., Martin, D. P., Anselmi, P., Aust, F., Awtrey, E., Bahník, Š., Bai, F., Bannard, C., Bonnier, E., Carlsson, R., Cheung, F., Christensen, G., Clay, R., Craig, M. A., Dalla Rosa, A., Dam, L., Evans, M. H., Flores Cervantes, I., Fong, N., Gamez-Djokic, M., Glenz, A., Gordon-McKeon, S., Heaton, T. J., Hederos, K., Heene, M., Hofelich Mohr, A. J., Högden, F., Hui, K., Johannesson, M., Kalodimos, J., Kaszubowski, E., Kennedy, D. M., Lei, R., Lindsay, T. A., Liverani, S., Madan, C. R., Molden, D., Molleman, E., Morey, R. D., Mulder, L. B., Nijstad, B. R., Pope, N. G., Pope, B., Prenoveau, J. M., Rink, F., Robusto, E., Roderique, H., Sandberg, A., Schlüter, E., Schönbrodt, F. D., Sherman, M. F., Sommer, S. A., Sotak, K., Spain, S., Spörlein, C., Stafford, T., Stefanutti, L., Tauber, S., Ullrich, J., Vianello, M., Wagenmakers, E.-J., Witkowiak, M., Yoon, S., and Nosek, B. A. (2018), “Many Analysts, One Data Set: Making Transparent How Variations in Analytic Choices Affect Results,” Advances in Methods and Practices in Psychological Science, 1, 337–356, DOI: 10.1177/2515245917747646.
- Wickham, H., Averick, M., Bryan, J., Chang, W., McGowan, L. D., François, R., Grolemund, G., Hayes, A., Henry, L., Hester, J., Kuhn, M., Pedersen, T. L., Miller, E., Bache, S. M., Müller, K., Ooms, J., Robinson, D., Seidel, D. P., Spinu, V., Takahashi, K., Vaughan, D., Wilke, C., Woo, K., and Yutani, H. (2019), “Welcome to the Tidyverse,” Journal of Open Source Software, 4, 1686, DOI: 10.21105/joss.01686.