Abstract
Understanding the abstract principles of statistical experimental design can challenge undergraduate students, especially when learned in a lecture setting. This article presents a concrete and easily replicated example of experimental design principles in action through a hands-on learning activity for students enrolled in an experimental design course. The activity, conducted during five 50-min classes, requires the students to work as a team to design and execute a simple and safe factorial experiment and collect and analyze the data. During three in-class design meetings, the students design and plan all aspects of the experiment, including choosing the response variable and factors, making a list of needed supplies, creating a randomized run schedule with the MINITAB DOE utility, and writing a statistical analysis plan. A feasibility study is conducted in the fourth class. During the fifth and last class, the students conduct the experiment. Each student writes a lab report including all background research, methods, analyses, and conclusions, as well as a reflection on the learning experience. Students’ reflections indicate the active-learning experience was enjoyable and boosted course engagement and perceived conceptual understanding.
1 Introduction
The benefits of active-learning projects are well documented, whether in the general education setting (Bonwell and Eison Citation1991) or specifically in statistics education (Anderson-Cook Citation1998; Kvam Citation2000; Anderson-Cook and Dorai-Raj Citation2001). In this article, an active-learning project is proposed to give students in an undergraduate design and analysis of experiments (DOE) course an opportunity to plan and execute their own experiment. This specific active-learning project was conducted in a DOE course at West Chester University (WCU) in fall of 2019. The experiment was a 3 × 2 × 2 factorial design, measuring the effect that three factors have on the bounce height of a tennis ball when dropped from a set position. During the project, the students were responsible for making all decisions. They chose the response variable, factors and levels, and sample size. They employed statistical design principles to maximize both efficiency and data quality. They discussed and proposed a statistical analysis plan. They executed the experiment, collected and analyzed the data according to the plan, and wrote a lab report that detailed all aspects of the experience, including a reflection on lessons learned through their active-learning experience.
The principal learning outcome for the course is for students to understand not only the important design principles such as randomization, replication, and blocking, but also how their inclusion in experimental design improves the data quality and the validity of the inference. These abstract principles can prove difficult to bring to life in a lecture setting. This active-learning project fosters conceptual understanding by giving students the hands-on experience of employing the concepts. The project used five 50-min classes: three for planning meetings, one for a feasibility study, and one for the actual experiment. The materials used were easily obtained and inexpensive, and the space required for execution of the experiment was a simple storage room. This active-learning project was an efficient and fun way to effectively teach abstract DOE principles and develop technical writing skills.
2 Motivation
2.1 The GAISE Report
In 2005, the American Statistical Association (ASA) published the Guidelines for Assessment and Instruction in Statistics Education (GAISE) college report. The purpose of the GAISE report was to create guidelines for undergraduate statistics education that would produce a student who is statistically literate. The report gave six recommendations for teaching an undergraduate statistics course (Aliaga et al. Citation2005):
Teach statistical thinking.
Focus on conceptual understanding.
Integrate real data with a context and a purpose.
Foster active learning.
Use technology to explore concepts and analyze data.
Use assessments to improve and evaluate student learning.
In 2016, the GAISE report was revised and once again published by the ASA. The original six recommendations remained, with the addition of two additional points of emphasis for the first recommendation regarding statistical thinking (Carver et al. Citation2016):
Teach statistics as an investigative process of problem-solving and decision-making.
Give students experience with multivariable thinking.
While the focus of the report is an introductory-level statistics course, the authors believe that “the GAISE recommendations also apply to statistics courses beyond the introductory level” (Carver et al. Citation2016, p. 7). This DOE active-learning project implements many of the GAISE recommendations. Consequently, the project meets its established learning outcomes, which are described in the next section.
2.2 Student Learning Outcomes for the Project
This project simulates the experience of working as a part of an experimental design team that is responsible for experimental planning and execution, data entry and analysis, and communication of the results in a written report. Prior to the start of the project, the students have heard multiple lectures on design and analysis of factorial experiments. They have learned the principles of randomization, blocking, replication, and power. They have learned that factorial data often possesses the regularities of effect sparsity, hierarchy, and heredity: three characteristics that support the use of a factorial design. Effect sparsity means that the number of discernible (significant) effects is usually small; hierarchy signifies that main effects are usually larger than interaction effects, and heredity implies that an interaction term is usually only discernible if at least one of its parent factors is discernible (Li, Sudarsanam, and Frey Citation2006). The students have used software to create a randomized run schedule and to analyze data and create graphs.
Upon completion of this active-learning project, it is intended that the students achieve the following outcomes:
Establish a research question.
Identify all variables to be measured. This includes the response and all factors with levels. The response should be easy to measure and record and should directly relate to the research question. Factor levels should be properly spaced.
Plan all aspects of the experiment, including required materials, location, and time requirements.
Employ the principles of statistical experimental design, such as randomization and blocking, during the planning phase to maximize the quality of the data produced.
Analyze the data using the appropriate statistical analyses and graphs.
Write a lab report that documents the experimental methods and statistical analyses and effectively communicates both the results of the experiment and a reflection on the advantages of proper experimental planning.
3 Details of the Active-Learning Project
3.1 Timing of the Project
This project begins during week nine of a 15-week semester. The project is completed by week 13, and lab reports are submitted the following week. Conducting the experiment during the latter part of the semester ensures that the students have been exposed to the principles that they must employ. For example, they must understand the importance of replication, its connection to power, and having enough degrees of freedom to test for interactions. Additionally, blocking may be required due to an unavoidable source of variation. They should understand that randomization mitigates the effect of lurking variables and that the choice of factor levels and level spacing is important. Starting later in the semester is also helpful in that it allows time for the students to get to know one another. Students must closely collaborate for three meetings and two experiment sessions, so familiarity with one’s classmates makes the design meetings more productive.
3.2 The Planning Stage
After several in-class discussions, the students chose to experiment with tennis balls. Specifically, they chose to investigate if the height that a tennis ball bounces when dropped changes based on the temperature of the ball (cold, room temperature, or warm), the tennis ball brand (Penn and Wilson), or whether the tennis ball was “pressurized,” that is, stored in a can. After selecting the research question, the students met during the regular class time in a conference room for the next three Fridays. In the conference room, the students sat around a large table for most discussions, and at times broke into smaller groups to work on specific tasks.
During the first meeting, the class chose the response variable and all factors and levels. This required the students to search the internet for relevant research and to browse online retailers for brands and types of tennis balls. Once they chose the factors and levels, the students planned the execution of the experiment during the next two meetings. The class decided that tennis balls would be dropped from a fixed height using a “grabber,” or long-handled pick-up tool. The same student would drop each tennis ball to minimize dropper-to-dropper variation. Two students would record each drop, with one using an iPhone 10 on a tripod and the other using a Nikon camera on a tripod. Two different students would create a poster backdrop with height measurements (in inches from the floor) to be attached to the wall and used to gauge the height of each bounce.
The original plan was to conduct the experiment in an on-campus exercise science lab. The lab gave a feeling of legitimacy to the scientific endeavor. Unfortunately, the team lost its spot in the lab at the last minute due to a scheduling conflict. After scouting several locations, the students chose a utility room of the WCU Mathematics Department for their temporary experimental lab. This room provided sufficient space, including enough wall space to serve as a backdrop for the video footage, and seating for the data entry teams. The room had a refrigerator for chilling the tennis balls, and the students commandeered an empty utility cart for the sous vide (tennis ball warmer).
The students chose brand as the first factor and purchased Penn and Wilson tennis balls from an online retailer. Half of the tennis balls were pressurized (stored in a can) and half were not pressurized (stored in a plastic bag). This was the second factor. The third factor was temperature. The tennis balls were randomly assigned to one of three temperatures: low, medium, and high. The utility room’s refrigerator chilled the tennis balls and provided the low temperature setting at approximately 35 °F. The medium temperature was room temperature, measured to be 72 °F. The warm tennis balls were sealed in plastic bags and warmed to 110 °F in a sous vide (water bath) that belonged to one of the students.
3.3 Using Randomization, Replication, and Blocking
According to the plan, the students needed to complete a total of 36 experimental runs within one 50-min class period. Each run included selecting the appropriate tennis ball (brand, pressure, and temperature), recording the ball being dropped, and transferring the video footage via AirDrop. While the students were confident that they could complete the experiment within the timeframe, they wanted to create a contingency for a possible shortage of time. They recognized that employing a completely randomized design could result in certain factor-level combinations not being tested if they sat adjacent at the end of the randomized run schedule. To avoid this outcome, they designed the experiment to be executed in three runs where the treatment order was randomized within each run. With this scheme, if time ran short, they would have at least two observations per treatment. Experimental run would be included as a blocking variable in the analysis. The students considered and discussed additional issues, such as the possible strong influence of outliers due to the small sample size of only three replications per treatment. They also recognized that the run schedule addressed the possible lurking effect of an increase in room temperature during the experiment.
3.4 Pilot Study: Evaluating the Feasibility of the Process
In previous lectures, the importance of using a feasibility or pilot study prior to the experiment to maximize quality and efficiency was discussed. A feasibility study was defined as a reduced-size version of a planned experiment that serves as a “test run” to evaluate methodology, equipment and instrumentation, and the data collection process. Pilot and/or feasibility studies are an underused element of experimental design (van Teijlingen and Hundley Citation2002). While a feasibility study does not guarantee a successful experiment, it may identify potential stumbling blocks or weaknesses in a design.
Conducted one week prior to the experiment, the purpose of our feasibility study was to assess the work space, determine the drop height, create the height gauge, and fix the positions of the cameras. During this meeting, the students dropped the same tennis ball about 20 times. They practiced recording the drop, transferring the video file, examining the video, and recording the data in the MINITAB data sheet. They also attached the height gauge backdrop to the wall and determined the camera distances so that the space was ready for the day of the experiment.
The advantages of the trial run were immediately evident to the students. It alleviated several concerns, primarily that they would not complete the experiment in the allotted time. It also gave them confidence about the efficiency and ease of the data generation and data recording processes. During the trial run, the students experimented with different distances from the height gauge backdrop on the wall to the camera tripod to optimize the visibility of the backdrop in the video. The experiment was ready to be executed when the day arrived.
3.5 Execution of Experiment
On the final day of the project, the class met in the utility room to drop 36 tennis balls, record the drops, and measure the bounce height. The experiment went off without a hitch due to the students’ thorough and extensive planning and the lessons learned from the feasibility study.
Each of the 19 students had a specific task. One student was responsible for reading the run schedule. She announced each run by temperature, brand, and pressurization. Several students then performed tennis ball retrieval from either the room temperature bag, the refrigerator, or the sous vide. One student manned the grabber and dropped tennis balls on the command of the two camera operators. The iPhone operator transferred video recordings five at a time to the data entry teams. The second camera served as a backup system. Three data entry teams of two students each received the videos on their own phones, watched the videos to assess the bounce height and recorded the data so that each experimental run had three recorded observations. The data were recorded directly into the MINITAB DOE randomized data sheet. The teams then compared their results and corrected any data entry errors. The data were shared with the class and made available for analysis by the end of the day.
3.6 Data Analysis and Report Writing
The students strengthened their technical writing skills by writing a lab report upon completion of the experiment. This report included an abstract, an introduction, a methods section, statistical analyses, a discussion, and a conclusion. MINITAB was used to create all tables and graphs. The planned analyses called for a three-way ANOVA, post-hoc multiple comparisons (if appropriate), a Pareto chart for effect sizes, and residual analyses. Students were responsible for conducting their own analyses and were encouraged to include additional tables or graphs they felt were illuminative. In the report, they were expected to identify all active effects and whether the system exhibited the principles of sparsity, heredity, or hierarchy. The discussion section served as a reflection on what they learned from the active-learning project, as well as a metric to assess whether the learning objectives of the project had been met. Some of their feedback is presented in a following section.
4 Results and Student Feedback
If you play tennis, you may be interested to know that tennis balls that are warmed to 110 °F, that come in a pressurized can, and that are made by Wilson bounce the highest. The class found that the three-way interaction term was statistically discernible (significant) at the 0.05 level (p = 0.03), and the blocking variable of experimental run was not (p = 0.13). The results of the statistical analyses can be found in the Appendix. While this was not the aim of the activity, the students found the results to be interesting.
The students responded positively to all aspects of the activity. They were actively engaged in the three planning meetings. They enthusiastically participated in both the feasibility study and the experiment. The discussion section of the lab report, which required a reflection on the process, captured the students’ opinions of the activity. Specifically, the instructions for writing this section were “to discuss what you took from the extensive planning before the execution of the experiment. Include a brief summary of important topics discussed at planning meetings and things we learned during the pilot study.” The most common student sentiment was that the preparation completed in the planning meetings and feasibility study improved the efficiency and ease of executing the experiment and the quality of the resulting data. Some specific comments were:
“In these meetings we discussed the equipment we could use for the experiments for the recording, storage and maintaining of the temperature, how to measure the response, and how we could reduce human and lurking error.”
“Through planning we were able to take into consideration replication and even blocking which would have been very useful in case of a time constraint issue.”
“While running through the pilot study, we soon realized we would not be able to send data quickly and efficiently from the high-end camera to other people’s phones. We had to change the way we collect data by recording the dropped ball with an iPhone, so the video recordings could be sent to video analyzers quickly and efficiently.”
“Since we had limited time to run this experiment, the [pilot study] helped us prepare and perform it in an efficient manner. This experiment could not have turned out as well as it did if we had avoided the preparations leading up to it, so this might have been the most important part of the experiment.”
“I understand the value that comes with working with a team and know that I will be a part of more teams in the future.”
5 Variations
The tennis ball experiment was the third iteration of an active-learning project designing and executing an experiment within this course. Previous classes chose to experiment with cooking or baking techniques, performed in the kitchen of a new dormitory on campus. Year one involved baking brownies. We compared scratch-made brownies and boxed-mix brownies and prepared the brownie pans with either butter or cooking spray. Our 2 × 2 factorial experiment also included a blocking variable (two ovens). Student testers evaluated taste on a scale of 1–5. Year two compared gourmet and discount popcorn (popped in a Whirly-Pop popper) using two different popping times and two different amounts of oil. This 23 factorial experiment also included a blocking variable (two stovetops). The response variable was the percentage of unpopped kernels. The tennis ball experiment was the easiest to plan and conduct and the least messy, albeit the least delicious, of the three learning activities. Internet searches provided the ideas for all three experiments. All of these experiments were well-planned by the students, employing components of randomization, consistent experimental settings, blocking, and replication. In every case, the students ensured a properly designed experiment with proper planning.
The tennis ball experiment cost the WCU Mathematics Department just under $60. The only supplies purchased were tennis balls. Students volunteered the use of their iPhones, a digital camera, a grabber, and a sous vide. Photos of these items are included in the web appendix (website: https://www.wcupa.edu/sciences-mathematics/mathematics/lPyott/webAppendix.aspx). The costs were similar in previous semesters for brownie baking materials and popcorn poppers.
6 Conclusion
Statistical literacy, as advocated by the 2016 GAISE (Carver et al. Citation2016) report, is challenging for both undergraduates to achieve and instructors to deliver. Instructors want students to finish their undergraduate studies with knowledge of statistical theory and application, competence in using statistical software, and technical writing skills for effective communication. An active-learning project such as this one is an engaging and effective way to boost statistical literacy. The activity requires students to employ statistical thinking during the planning stage of an experiment. Through collaboration, the students identify issues and use the design concepts taught in class to resolve them. Students use technology for both the design of the experiment and the analysis of the data it generates. This classroom exercise addresses all six of the GAISE (Carver et al. Citation2016) recommendations for producing a statistically literate student.
As previously stated, 19 students enrolled in the course and participated in the experiment. Using five 50-min class periods may seem like too large of a sacrifice of lecture or assessment time, but the learning opportunity that comes from this type of active-learning project cannot be overstated. The project does not require an excessive time commitment from the instructor because the students complete most of the tasks involved. A class size larger than 20 would certainly present a challenge of having all students involved and engaged in one experiment. Classes larger than 20 students would require grouping the students into teams. In this situation, the instructor would present the research question; the teams would then be responsible for designing and executing their experiments. A discussion of replicability of results would follow naturally.
While MINITAB was used in this project, other software packages such as SPSS would suffice. Future iterations of this project will include the use of the statistical programming language R as more students in the course become adept R users.
References
- Aliaga, M., Cobb, G., Cuff, C., Garfield, J., Gould, R., Lock, R., Moore, T., Rossman, A., Stephenson, B., Utts, J., Velleman, P., and Witmer, J. (2005), “Guidelines for Assessment and Instructions in Statistics Education: College Report,” available at https://www.amstat.org/asa/files/pdfs/GAISE/2005GaiseCollege_Full.pdf.
- Anderson-Cook, C. M. (1998), “Designing a First Experiment: A Project for Design of Experiment Courses,” The American Statistician, 52, 338–342.
- Anderson-Cook, C. M., and Dorai-Raj, S. (2001), “An Active Learning In-Class Demonstration of Good Experimental Design,” Journal of Statistics Education, 9, DOI: 10.1080/10691898.2001.11910645.
- Bonwell, C. C., and Eison, J. A. (1991), “Active Learning: Creating Excitement in the Classroom. 1991 ASHE-ERIC Higher Education Reports,” George Washington University, Washington, DC.
- Carver, R., Everson, M., Gabrosek, J., Horton, N., Lock, R., Mocko, M., Rossman, A., Rowell, G. H., Velleman, P., Witmer, J., and Wood, B. (2016), “Guidelines for Assessment and Instruction in Statistics Education (GAISE) College Report 2016,” American Statistical Association, Alexandria, VA, available at http://www.amstat.org/asa/files/pdfs/GAISE/GaiseCollege_Full.pdf.
- Kvam, P. (2000), “The Effect of Active Learning Methods on Student Retention in Engineering Statistics,” The American Statistician, 54, 136–140.
- Li, X., Sudarsanam, N., and Frey, D. (2006), “Regularities in Data From Factorial Experiments,” Complexity, 11, 32–45. DOI: 10.1002/cplx.20123.
- van Teijlingen, E., and Hundley, V. (2002), “The Importance of Pilot Studies,” Nursing Standard, 16, 33–36. DOI: 10.7748/ns.16.40.33.s1.
Appendix:
Statistical Analysis of Tennis Ball
Experiment Data
Fig. A1 Boxplots of bounce height (inches) by brand, temperature, and pressurization.
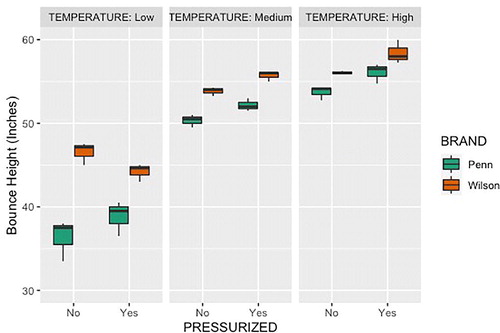
Fig. A2 MINITAB Pareto chart for standardized effect sizes.
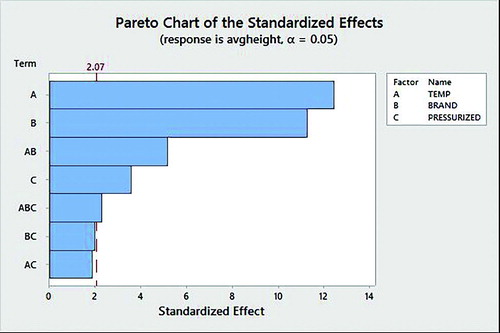
Table A1 MINITAB three-way ANOVA table for tennis ball factorial experiment.