?Mathematical formulae have been encoded as MathML and are displayed in this HTML version using MathJax in order to improve their display. Uncheck the box to turn MathJax off. This feature requires Javascript. Click on a formula to zoom.
Abstract
Longitudinal data makes it possible to investigate change in time and its causes. While this type of data is getting more popular there is limited knowledge regarding the measurement errors involved, their stability in time and how they bias estimates of change. In this paper we apply a new method to estimate multiple types of errors concurrently, called the MultiTrait MultiError approach, to longitudinal data. This method uses a combination of experimental design and latent variable modelling to disentangle random error, social desirability, acquiescence and method effect. Using data collection from the Understanding Society Innovation Panel in the UK we investigate the stability of these measurement errors in three waves. Results show that while social desirability exhibits very high stability this is very low for method effects. Implications for social research is discussed.
1. Introduction
Longitudinal data is essential for answering the most fundamental questions in the social sciences. Its ability to estimate individual level change as well as help make causal inferences is essential in a number of fields such as sociology, economics, psychology, political science, education and health. This is obvious also in the increasing number of longitudinal studies being implemented around the world as panel studies (Turek et al., Citation2021), ageing studies (Program on Global Aging & Health & Policy, Citation2021) or probability online panels (Blom et al., Citation2016).
However, while the amount of longitudinal data being produced and analysed increases there is a continuing gap in our understanding of measurement error in this context. It is common knowledge that measurement error can bias means and regression coefficients as well as estimates of changes (Cernat & Sakshaug, Citation2021; Fuller, Citation1987; Hagenaars, Citation2018; Lord & Novick, Citation1968; Saris & Revilla, Citation2016; Saris & Gallhofer, Citation2007) and its importance is highlighted by the preeminent role it plays in frameworks such as the Total Survey Error (Groves, Citation2009; Lynn & Lugtig, Citation2017). Nevertheless, most of the statistical methods developed for estimating measurement error either consider only one type of measurement error at a time (such as the quasi-simplex model, Alwin, Citation2007; Cernat et al., Citation2021) or need extra data for validation (such as the longitudinal vignettes and the combined Hidden Markov Chain, Paccagnella, Citation2021; Pavlopoulos et al., Citation2021). Furthermore, few of the methods have the ability to separate multiple sources of measurement error. By modelling multiple causes of measurement error concurrently, we can avoid bias while better understanding the data generating process. This, in turn, will lead to improvements in future data collection. Additionally, understanding the stability of measurement error in time is fundamental for understanding its impact on estimates of change.
In this paper we propose a new approach to estimating multiple sources of measurement error concurrently using longitudinal data and show an application in a probability panel in the UK. By implementing the newly developed MultiTrait MultiError (MTME, Cernat & Oberski, Citation2019, Citation2021) in a longitudinal study we are able to separate four source of measurement error: social desirability, acquiescence, method effects and random error. Furthermore, by estimating auto-regressive effects for the sources of measurement error we can estimate their stability as well as the impact on substantive estimates of change.
2. Literature Review
Measurement error has received considerable attention in a number of fields such as psychology, education, sociology and survey methodology (e.g., Billiet & McClendon, Citation2000; Groves, Citation2009; Lord & Novick, Citation1968; Moors et al., Citation2014; Tourangeau et al., Citation2000). Fundamentally, this refers to a difference between a concept of interest and the answer recorded during data collection. In addition to the critical risk of not measuring the intended concept (also known as validity), measurement error can bias means and totals as well as estimates of variation and regression coefficients (Fuller, Citation1987; Hagenaars, Citation2018; Saris & Revilla, Citation2016; Saris & Gallhofer, Citation2007).
A number of approaches have been developed to estimate and correct for such errors, such as latent variable modelling (e.g., Alwin, Citation2007; Bollen, Citation1989; Saris & Gallhofer, Citation2007), data collection experiments (e.g., Tourangeau et al., Citation2000), anchoring vignettes (e.g., King et al., Citation2003) or data integration (e.g., Oberski et al., Citation2017; Pavlopoulos et al., Citation2021). Nevertheless, fewer methods have been developed specifically for estimating measurement error in the context of longitudinal data. We will next briefly discuss some of the main sources of measurement error in the context of survey data collection, followed by an overview of the main methods developed to estimate measurement error in longitudinal data. Then we will discuss the method proposed in this paper, which we call the Longitudinal MultiTrait MultiError (LMTME) approach.
2.1. Sources of Measurement Error
Measurement error has a central role in the theory of data collection in survey methodology. The Total Survey Error framework (Groves, Citation2009) separates validity, which is defined as the difference between the concept of interest and the measurement instrument, and measurement error, which is the difference between our intended measures and the respondent’s answers. Considering closer the act of answering questions Tourangeau et al. (Citation2000) propose a four step framework of processing and answering survey questions: interpret the question, search memory, integrate information and translate into a response. Cognitive shortcuts in any of these stages can lead to measurement error.
Saris and Gallhofer (Citation2007) distinguish two types of measurement error: random and correlated error. Random error refers to response errors that affect only one variable at a time, although it can still bias regression and change estimates (Fuller, Citation1987; Hagenaars, Citation2018; Saris & Revilla, Citation2016). Correlated error refers to situations where answer tendencies carryover across multiple survey questions for particular respondents. This can bias multivariate statistical models (e.g. Pankowska et al., Citation2018; Spector et al., Citation2019) and can suppress estimates of change (Hagenaars, Citation2018). Well-known examples of correlated errors are: social desirability, acquiescence and method effects.
Social desirability refers to the tendency of respondents to edit their answers in order to present themselves in a favorable light (DeMaio, Citation1984; Tourangeau et al., Citation2000). This can impact sensitive behaviors where there are strong social norms. It can be present in a number of topics such as alcohol use, smoking, sexual behaviors or attitudes to immigration (Fisher & Katz, Citation2000; Kreuter et al., Citation2008; Tourangeau et al., Citation2000). Some contexts tend to facilitate this behavior, such as the presence of an interviewer or a third person (Krumpal, Citation2013). It has also been shown to be correlated with personality trait (Bäckström, Citation2007; Graziano & Tobin, Citation2002), making it potentially an individual level stable characteristic (Haberecht et al., Citation2015; Lönnqvist et al., Citation2007; Schmitt & Steyer, Citation1993).
Acquiescence, also known as “yea-saying,” refers to the tendency of agreeing with survey questions regardless of their content (Billiet & McClendon, Citation2000; McClendon, Citation1991). This is typically done to minimize cognitive effort, i.e., satisficing (Krosnick, Citation1991), and is facilitated when the first answer category is a positive one (Billiet & McClendon, Citation2000). Billiet and Davidov (Citation2008) have also shown this to be relatively stable in time.
Method effects refers to the impact of the data collection tool on the response answers. This is typically defined as the impact of the response scale in the social sciences (Andrews, Citation1984; Saris & Gallhofer, Citation2007) or ratters in phycology (Grimm et al., Citation2009; Holtmann et al., Citation2020; Koch et al., Citation2020). Characteristics of the response scale have been found to impact response answers in a number of different contexts (Alwin, Citation2021; Moors et al., Citation2014; Saris et al., Citation2011; Saris et al., Citation2010 ). This has also been shown to be stable in time (Grimm et al., Citation2009; Holtmann et al., Citation2020).
2.2. Models for Estimating Measurement Error in Longitudinal Data
While measurement error has received considerable attention in multiple fields, relatively few methods have been developed to estimate it in the context of longitudinal data. One of the methods proposed especially for this type of data is the quasi-simplex model (QSM, Alwin, Citation2007; Cernat et al., Citation2021; Heise, Citation1969; Wiley & Wiley, Citation1974). The model postulates a measurement model using a latent variable approach as well as an auto-regressive structural part that enables the estimation of change in time of the trait, or “true score.” With at least three waves of data the model can be estimated, albeit with some strong assumptions: random error or the variance of the residual is constant in time. Using this model it is possible to estimate the amount of random error and reliability in time, although this model assumes the absence of correlated errors.
A similar approach can be used in the context of categorical observed and latent variables by applying the Hidden Markov Chain Model (HMCM, Van De Pol & De Leeuw, Citation1986; van de Pol & Langeheine, Citation1990). The model can estimate misclassification and can also be extended to include sources of correlated errors (Bassi et al., Citation2000). Similarly to the QSM, the model can be estimated with only one variable measured at three points in time if assumptions regarding the stability of measurement error and of the traits are made. These can be freed if more information is available, such as more waves of data or multiple indicators per wave.
Yet another approach to estimating measurement error in longitudinal data is to use multiple indicators measuring the same concept at each point in time. Billiet and McClendon (Citation2000) have shown that response style factors, such as acquiescence, can be estimated when a set of balanced questions, positive and negatively worded, measure the same concept. Billiet and Davidov (Citation2008) have shown that this can be extended to longitudinal data. They found that while acquiescence is not perfectly stable in time it does have a strong correlation between two waves of a longitudinal study.
A similar approach is used in the context of estimating method effects using MultiTrait MultiMethod (MTMM, Andrews, Citation1984; Campbell & Fiske, Citation1959; Saris & Gallhofer, Citation2007). Typically, this involves an experimental design where respondents answer the same question using different response scales at two different points in time (typically the start and end of a survey). Using such a design in combination with a latent variable modelling approach, it is possible to separate trait variance from method variance and random error. This model has also been expanded to longitudinal data by collecting multiple waves of data using the same design and then investigating the relationship of the method factors across time (Geiser et al., Citation2010; Holtmann et al., Citation2020; Koch et al., Citation2020; Scherpenzeel & Saris, Citation2007).
Another popular method for estimating measurement error developed recently is the anchoring vignette (King et al., Citation2003). In this approach, respondents are asked both to rate themselves on the construct of interest as well as a number of vignettes that present a set of standardized situations. Using the rating in the vignettes it is possible to correct for differences in the way respondents use the response scales, also known as differential item functioning (DIF) or lack of equivalence. This model has also been applied to the longitudinal context, making it possible to correct for the change in time of DIF (Angelini et al., Citation2011; Paccagnella, Citation2021). This approach is similar to longitudinal equivalence in the context of multi-item constructs (Leitgöb et al., Citation2021; Little, Citation2013) although it does also account for individual level variation in rating behaviour.
An alternative approach to estimating measurement error is to include external data, especially if it can be considered a gold-standard or error free. As this is rarely possible when measuring complex concepts some of the models discussed above have been expanded to integrate data from multiple sources. This makes it possible to have multiple measures of the same concept and to treat the different data sources as different “methods.” An example in the context of MTMM is presented by Oberski et al. (2017) which combined survey and administrative data from the German Federal Employment Agency. A similar approach has been used recently in the context of longitudinal data and HMCM. For example, Pavlopoulos et al. (Citation2021) used the Dutch Labour Force Survey and the Employment Register to correct for random and correlated error in employment status across time. The approach can also be extended to create error free synthetic data using imputations (Boeschoten et al., Citation2021) and to correct for bias if estimates of measurement error are know a priori (Pankowska et al., Citation2018).
While the models presented above are valuable in estimating and correcting for measurement error they also have some limitations. Firstly, they typically estimate only one type of measurement error (QSM, HMCM) or at most two (e.g., MTMM). Additionally, the estimates of measurement error can be a combination of multiple sources of error. For example, it is not clear what are the causes of longitudinal DIF, even when using anchoring vignettes. Similarly, the estimation of method effect, be it from an experiment within a single dataset or from multiple data sources, can confound multiple types of errors, such as method effect with acquiescence or primacy/recency. Furthermore, by concentrating on one or two types of measurement errors they assume that alternative sources of measurement error don’t exist. For example, the MTMM assumes that social desirability does not impact the measurement of the questions. This contradicts the large body of literature discussing this source of error, especially in the case of sensitive topics (DeMaio, Citation1984; Fisher & Katz, Citation2000; Kreuter et al., Citation2008; Tourangeau et al., Citation2000). Finally, there is relatively little knowledge regarding the stability of different sources of measurement error. This can be essential in the context of longitudinal data as it might imply different biasing effects on the estimates of change. In the next section we propose a model that can tackle some of these issues.
2.3. The Longitudinal MTME
Recently the MultiTrait MultiError (MTME) approach has been proposed as a way to estimate multiple types of errors concurrently (Cernat & Oberski, Citation2019, Citation2021). The MTME, similar to the traditional MTMM, combines an experimental design with a latent variable model to estimate traits and measurement error. Cernat and Oberski (Citation2019) argue that instead of just implementing an experiment, such as the classical MTMM, researchers should carefully consider the sources of measurement error in their variables of interest and develop experiments to estimate all the relevant ones. They further show how it is possible to construct a statistical model that concurrently estimates the different sources of measurement error in a latent variable framework using survey experiments.
More precisely the MTME generalizes the MTMM by enabling researchers to include multiple sources of error in the same experiment (instead of just method effects). For each source of error researchers need to develop an appropriate experiment. For example, an experiment could reverse the order of an Agree-Disagree response scale to manipulate the level of acquiescence (Billiet & Davidov, Citation2008; Billiet & McClendon, Citation2000) while another one could use three different response scales: 5 point, 7 point and 10 point, to calculate the impact of the response scale (i.e., method, W. Saris & Gallhofer, Citation2007). By combining all the experiments different types of question wordings could be developed, for example a 5 point Agree-Disagree scale and a 5 point Disagree-Agree one. To estimate the measurement error in this context, a within experimental design is needed where respondents answer the questions using multiple question wordings. To minimize the burden on survey participants a split-ballot approach can be used (Cernat & Oberski, Citation2019; Saris et al., Citation2004). Using this approach the sample is divided in random subgroups, each one receiving the questions using two different wordings. These would be normally be spaced (within the survey or in multiple surveys) to minimize memory effects (Saris & Van Meurs, Citation1991). The experiment can be expanded to multiple types of measurement error given large enough samples to collect data for all possible combinations of wordings (Cernat & Oberski, Citation2019).
Cernat and Oberski (Citation2021) show how it is possible to use such a design to estimate concurrently four sources of measurement error in six questions measuring attitudes to immigration: social desirability, acquiescence, method effect and random error. They find that while all sources of error are present random error is the largest non-trait source of variation. On the other hand, social desirability, acquiescence and method effect impact both the variance and the mean estimates of the six questions investigated.
While the MTME can be a valuable tool for estimating measurement error in the context of cross-sectional data in this paper we will highlight how it can be extended to a longitudinal context and the value of doing so. In the next section we will present the data and the statistical model used for estimating the Longitudinal MTME.
3. Data and Methods
3.1. Data
In this paper we are using the Understanding Society Innovation Panel, a yearly probability panel in the United Kingdom started in 2008 (Institute for Social & Economic Research, Citation2021). A stratified and clustered sample design was implemented in England, Scotland and Wales. Strata were based in Government Office Region, proportion of non-manual workers and population density. Using a systematic random sampling approach 120 sectors were drawn with 23 address selected within each one. Refreshment samples in waves 4 and 7 added 960 and 1560 new addresses. Within each address all adults over 16 were eligible for an interview. In this analysis we use waves 7, 8 and 9 as they included the MTME design presented below.
In wave 1 the household response rate was 59% and the conditional individual response rate was 88.9% (Institute for Social & Economic Research, Citation2021). In wave 7 the conditional response rate at the household level was 78.5% while the conditional individual response rate was 82%. For wave 8 they were 82.7% and 85.4% while for wave 9 they were 84.7% and 85.4%. For more details about the design and outcomes of the study please refer to the user guide (Institute for Social & Economic Research, Citation2021).
4. MTME Design
To implement the MTME experiment we used six questions that measure attitudes towards immigrants (). In order to estimate the three types of correlated errors we devised experiments for each one:
Table 1. The six questions used to measure attitudes towards immigration (original wording).
Method effect: respondents received a two point response scale or a 11 point response scale;
Acquiescence: some respondents received an Agree-Disagree scale or a Disagree-Agree scale. This is based on the expectation that having the agree category first makes it easier to acquiesce;
Social desirability: some respondents received positively worded questions while others received negatively worded ones. This is based on the expectation that the framing of the question presents the respondents with a social norm for a topic. Social desirability would encourage respondents to agree with the social norm.
By combining the three experiments we develop eight different wordings for the questions of interest (). For example, wording 1 (W1) uses a negative wording of the question and a two point Agree-Disagree response scale. To implement the MTME design the respondents had to answer the six questions using two of these wordings, once at the start of the survey and once at the end of it. In order to control for the possible effect of wording order on the results we divided the sample in 48 groups that were randomly allocated the questions, with one type of wording at the start of the survey and one at the end. The average time between the two wordings was approximately 30 min. We repeated the same design for all three waves analyzed here, respondents being randomly allocate to one of the 48 groups in each wave.
Table 2. The eight experimental wordings used in the data collection.
4.1. Statistical Model
The data collected includes a MTME design with three correlated errors repeated in three different waves. As a result, we will expand on the model proposed by Cernat and Oberski (Citation2021) to include the longitudinal dimension, leading to the Longitudinal MTME.
We represent the observed variable on the t-th trait, m-th method, a-th acquiescence direction, s-th social desirability and the i-th wave as In our application we observe
possible combinations. We then consider a response variable
for binary (2-point) variables, this is the inverse probit,
when
and it is the identity otherwise,
when
Our model for each response variable is then a linear factor model:
Where the loadings
and
are restricted according to the design matrix presented in . Here we use two different strategies for estimating measurement error. By using effect coding (coding the loadings for one type of wording as +1 and for the other as −1) we can estimate the average effect of the intervention. We use this strategy for estimating Acquiescence and Social Desirability. An alternative way to estimate the effect is dummy coding by using one of the experimental designs as the reference (coding the loadings to 0 for that type of wording). We use this strategy for the method effect to facilitate the estimation of the model (in line with Cernat & Oberski, Citation2021). We allow a method-specific scaling factor
for each latent variable, with
for identification purposes. In our application, the scaling factor
scales standardized effects on the probit scale (for 2-point scales) to effects on the unstandardized 11-point scale.
Table 3. Design matrix for MTME model measuring attitudes towards immigrants in UKHLS-IP.
The variance of the observed variables could be estimated using:
Where
is the variance of the factor variables and
the variance of the residual. This formula can also be used to decompose variance between the different sources of measurement.
In addition to estimating the MTME model at each wave we also include structural relationships between the latent variables as auto-regressive paths (for i > 0):
Where the
coefficients represent the stability of the latent variables (or lag-1 autoregressive coefficients) while the
represents the time specific variation ().
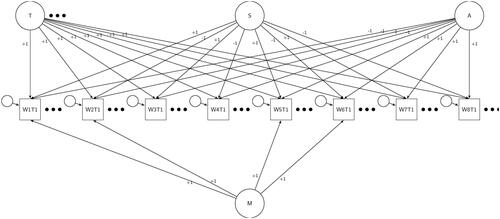
Figure 1. MTME model made in each wave. Circles represent latent variables while square observed variables. Loadings are fixed based on the strategy presented in . Here only the observed and latent variables for trait 1 is presented for each of wording for space reasons.
In the results section we first present the MTME model run separately at each wave in time. This will enable us to see if the aggregate estimate of measurement error are stable and if the model is indeed converging at each wave. We then estimated the LMTME and we will focus on the stability coefficients and the effects on estimates of change.
To estimate the model, we have used Bayesian estimation as implemented in Mplus 8.6 (Muthén & Muthen, Citation2017). We chose Bayesian estimation for the computational convenience of Gibbs sampling for this complex model with relatively large number of latent variables and large amount of missing information (Missing Completely At Random by design). Additionally, it enables us to add priors to prevent inadmissible estimates and nonconvergence commonly found in MTMM models (Helm et al., Citation2017, p. 201). We used weakly informative priors for the measurement model (see Cernat & Oberski, Citation2021, for more details)Footnote1. For estimation we used the default PX1 Gibbs sampler (Asparouhov & Muthén, Citation2010), with four chains and 200,000 iterations (out of which 100,000 are the burn-in).
5. Results
The models converged and the overall credible interval for the chi-square statistic was between 56.4 and 350.1 with 63 free parameters and a posterior predictive p-value of 0.004 for wave 7, between −4.5 and 284.0 (p. 0.029) for wave 8 and between −3.7 and 283.7 (p 0.028) for wave 9. For the LMTME model the chi-square statistic was between 115.6 and 950.8 (p 0.006) with 207 free parameters. The trace plots and posterior distributions did not indicate convergence issues. The traceplots show a good mix and the four chains consistently overlap. The potential scale reduction factor (Gelman & Rubin, Citation1992) was 1.005, 1.02 and 1.001 in waves 7, 8 and 9 and 1.09 for the LMTME.
Using the MTME models estimated at each wave we calculate the variances of the three types of correlated error and the six traits (). Our main interest is in the three types of correlated errors. We see that all of them have credibility intervals that do not include 0. This implies that they have an impact on the estimates and all of them show individual level variation. On the other hand we see that they do not change in time, on aggregate, as their credibility intervals overlap in the three waves. For the traits we see that the first three have less variation compared to the last three and also there appears to be an increase in variance in wave 8 compared to wave 7.
Table 4. Variances for latent variables in the MTME model for three waves.
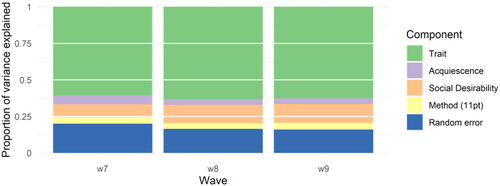
A more intuitive way to represent the findings of the MTME is to decompose the total variance by five sources: trait, acquiescence, social desirability, method and random error. We first aggregate over all the questions and by wave to see the relative sizes of the measurement errors and their aggregate stability. highlights that in the three waves trait, or the amount of valid variation, represents around 60% of the total variation. This is followed by random error, which represents around 12%, social desirability and method variation. Looking at the aggregate estimates it appears the measurement error is relative stable, with a slight decrease of random error and acquiesce after wave 1 and a slight increase in social desirability.
Figure 2. Variance decomposition by wave and component based on the MTME.
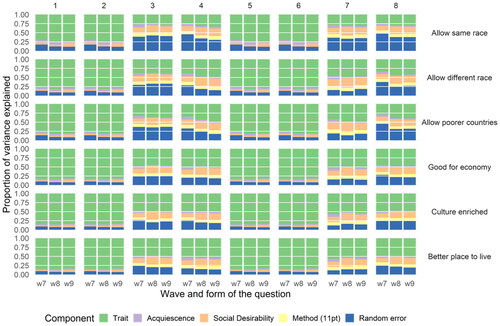
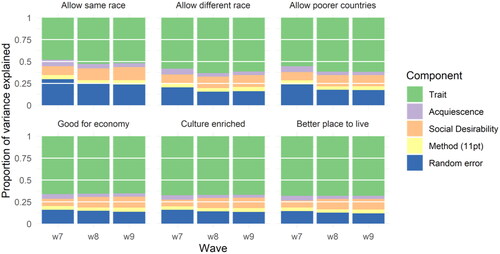
We can further decompose the variation separately by question as well (). Here we see that the first three questions measuring attitudes towards immigration have lower quality compared to the other three, with larger proportions of random errors. The first question seems especially problematic with trait variation representing only around 50% of the total amount of variation. It is also notable that on aggregate measurement error seem relatively stable for each of the six questions. It is possible to further drill down to identify the best question format for each question and wave ( in the Appendix). This can be a useful tool for improving survey design and for instrument development.
Figure 3. Variance decomposition by wave, question and component based on the MTME.
The MTME model also enables the estimation of the means of the latent variables. Values that are different from 0 indicate that the experimental design also impacts the average of the answers (). For example, changing the response scale from agree-disagree to disagree-agree leads to a shift in the average response of 0.25 standard deviations. Similarly, changing from a positively worded question to a negative one leads to a shift of 0.18 standard deviations, on average. Similarly, using an 11 point scale instead of a 2 point scale leads to lower averages of around 0.4 standard deviations. We also notice that the mean bias is fairly stable in time (credibility intervals not overlapping) with the exception of wave 8 where the effect of the method on the average appears larger compared to wave 7. While in regards to the bias in the mean we cannot say which type of wording is better without the use of gold standard data or by making some assumptions (e.g., more is better) the fact that the average of the observed scores is shifted by a particular type of wording is an indicator that the decisions regarding the question design are not trivial and can lead to bias.
Table 5. Means for latent variables in the MTME model for three waves.
6. Stability of Measurement Error
So far we only investigated the aggregate change in measurement error. Nevertheless, this can be misleading as individual level stability can have different patterns to those seen on aggregate. Furthermore, individual level stability is more important for understanding change in time of measurement error as well as looking at the biasing effect on estimates of change (as estimated in popular models such as latent growth models and multilevel model for change).
To understand individual level change in measurement error we estimate the LMTME model, which includes a measurement model at each wave, concurrently, as well as the stability of the latent variables. presents the stability coefficients for the three sources of correlated error. We see a wide range of stability. At one extreme, social desirability appears to be very stable with standardized coefficient stability of around 0.9 (where 1 represents no change in rank order in time). This implies that this type of correlated error is a very stable individual characteristic that does not appear to change in time. This would be in line with some other research showing that social desirability is linked with personality traits (Haberecht et al., Citation2015; Lönnqvist et al., Citation2007; Schmitt & Steyer, Citation1993). At the other extreme the impact of the response scale, or method effect, has very low stability, coefficients including 0 in the credibility interval. This implies the method, or response scale, has purely a contextual effect and is not a stable characteristic. Finally, acquiescence seems to be moderately stable with standardized coefficients of around 0.43. This type of correlated error appears to have some individual level consistency in time.
Table 6. Standardized stability coefficients for the latent variables representing the correlated errors.
In addition to the insights regarding the stability of correlated measurement error over time the LMTME model also makes it possible to correct for measurement error by estimating change in time using the trait variables instead of the observed variables. compares the stability coefficients for the six questions measuring attitudes towards immigration as estimated by the LMTME compared with estimates from a model that does not correct for the three sources of correlated error. Overall, it appears that ignoring measurement error leads to an underestimation of stability. This is the case for five out of the six questions analysed. For three of these questions the credibility intervals don’t overlap, indicating a consistent underestimation of stability when ignoring measurement error. This implies that models that estimate individual level change, like multilevel models for change and latent growth models, can overestimate the amount of change if measurement error is present and not corrected. Part of the spurious change appears to be caused by the different sources of measurement error.
Table 7. Standardized stability coefficients for the traits in the LMTME model and a model without correction for measurement error.
We should also note that the underestimation of stability is not a given. For example, for the “Allow same race” indicator the stability is higher when not correcting for measurement error (although we do note that credibility intervals overlap). So, the impact of measurement error on estimates of change will depend on the question and the mix of measurement errors and their stability.
7. Conclusion
In this paper we propose the Longitudinal MultiTrait MultiError (LMTME) as a way to concurrently estimate multiple types of measurement error at multiple points in time. We show how the MTME experimental design and modelling approach can be extended by repeating the same data collection procedure over multiple waves and how change in time can be modelled using auto-regressive coefficients. We present an application of this approach with three correlated errors that was implemented in the Innovation Panel. Using this design we can separate five sources of variation in questions measuring attitudes towards immigration: trait, random error, social desirability, acquiescence and method effect.
We found that, on aggregate, the amount of measurement error appears to be stable over three waves of the study when running the MTME separately. Nevertheless, this ignores individual level change. The LMTME presents a starkly different picture. It indicates that social desirability is extremely stable, with standardized coefficients around 0.9, and method effects are almost completely contextual, with stability of 0. Acquiescence measurement error is somewhere in between with a stability of around 0.4.
We also show that correlated measurement error can impact estimates of change. Most often its presence leads to an underestimation of stability and, thus, an overestimation of individual level change. This would imply that part of the observed change in longitudinal data may be due to measurement error. The impact of measurement error on change estimates will depend on the amount of measurement error and their stability and it can also to lead to an overestimation of stability in some cases.
The study has a number of limitation and should be only one part of a more thorough investigation of this new research method. In particular, here we only investigated one specific MTME design as implemented in a longitudinal study in the UK. Future studies should explore different designs and data sources to further understand the strengths and limitations of the method. It should also be noted that LMTME has similar assumptions to the MTME (and more generally to any within experimental design), as discussed by Cernat and Oberski (Citation2021). While having a year between measurements should minimize the effect of memory on the LMTME, within wave memory effects and the impact of panel conditioning on the model should be explored in the future. The timing is also important for the estimation of stability. In this study we had equal timing between data collection and respondents participated in the same period in each wave. When this is not the case autoregressive models may lead to incorrect estimates. Solutions such as those proposed by Cole and Maxwell (Citation2003) should be considered when the design does not meet these requirements. Also, the ability of the method to estimate measurement error depends on the experimental design used. For example, our estimation of social desirability relays on the effectiveness of our framing experiment. Future research should explore different ways to manipulate social desirability levels.
The model can also be expanded in a number of ways and this should be further investigated in the future. One direction could be the separation of within and between variation as Hamaker et al. (Citation2015). This could further clarify the sources of variation of traits and measurement error. Similarly, second order factors could be introduced to capture trait specific information. For example, in our application with six immigration questions the traits could be measured either by one or two second order factors (the first three questions measure a slightly different concept to the last three). This would facilitate some substantive analyses. Similarly, different types of measurement errors could be included in the model. Here we assumed continuous types of measurement error but they could also have a mixture distribution to estimate errors such as extreme response styles (Moors et al., Citation2014; Oberski et al., Citation2015). Similarly, the model can be extend to investigate the equivalence of the measurement error by restricting different components of the model and comparing the fit statistics. Finally, depending on the number and nature of the latent variables it may be possible to include correlations between some of these (for example between acquiescence and social desirability). Nevertheless, this may lead to estimation issues and may make the substantive interpretation of the factors difficult.
Keeping in mind the need for further research, we do believe the model presented in this paper offers a unique view on measurement error in survey data. To our knowledge the MTME is the first model to concurrently estimate such a wide range of measurement errors. This bypasses some the assumptions of previous models that look at one type of error at a time, leading to a more holistic view that gives more accurate estimates and shows relative sizes of different measurement errors. The LMTME builds on this and enables the investigation of stability in measurement error both in aggregate and at an individual level. The model also makes it possible to correct for measurement error and our results show that often ignoring measurement error in longitudinal studies can lead to an overestimation of change.
The results also have some implications for survey research. We have seen that on aggregate, measurement error seems to be relatively stable over three years of data collection. That being said, at the individual level, the three correlated errors explored in this paper show very different patterns. Especially interesting are the findings regarding social desirability and method effects. It appears that the former is extremely stable. This result contributes to the lively debate regarding the relationship between personality and social desirability (Haberecht et al., Citation2015; Lönnqvist et al., Citation2007; Schmitt & Steyer, Citation1993). One notable difference is that our approach does not use a separate scale to measure social desirability, as often done in the psychology literature (Haberecht et al., Citation2015; Lönnqvist et al., Citation2007; Schmitt & Steyer, Citation1993). On the other hand, method variance seems to be almost entirely contextual, with no visible carryover effect from one wave to another. This seems to contradict some of the research that implemented the longitudinal MTMM but it should be noted that often they refer to ratters as methods and not response scales, as we do here (Geiser et al., Citation2010; Holtmann et al., Citation2020; Koch et al., Citation2020; Scherpenzeel & Saris, Citation2007). On the other hand, our results regarding acquiescence seem to confirm prior research (Billiet & Davidov, Citation2008), highlighting moderate stability.
The fact that measurement errors have such different levels of stability indicates that they have different underlying mechanisms and imply that minimizing them might need different strategies. For example, studies focused on estimates of change may want to carefully consider social desirability and changes in design that may impact it. Based on these results it does appear that this type of measurement error can lead to an underestimation of true change. As a result, changes such as moving of panel studies from face to face to web data collection could bias estimates of change as the former can have higher levels of social desirability (e.g., Cernat et al., Citation2016).
Notes
1 We have also estimated the model with different priors and found similar results, indicating consistent findings.
References
- Alwin, D. (2007). The margins of error: A study of reliability in survey measurement. Wiley-Blackwell.
- Alwin, D. F. (2021). Developing reliable measures: An approach to evaluating the quality of survey measurement using longitudinal designs. In Measurement error in longitudinal data. Oxford University Press. https://doi.org/10.1093/oso/9780198859987.003.0006
- Andrews, F. M. (1984). Construct validity and error components of survey measures: A structural modeling approach. Public Opinion Quarterly, 48, 409–442. https://doi.org/10.1086/268840
- Angelini, V., Cavapozzi, D., & Paccagnella, O. (2011). Dynamics of reporting work disability in Europe. Journal of the Royal Statistical Society: Series A (Statistics in Society), 174, 621–638. https://doi.org/10.1111/j.1467-985X.2011.00705.x
- Asparouhov, T., & Muthén, B. (2010). Bayesian analysis using Mplus: Technical implementation (pp. 1–38). Mplus.
- Bäckström, M. (2007). Higher-order factors in a five-factor personality inventory and its relation to social desirability. European Journal of Psychological Assessment, 23, 63–70. https://doi.org/10.1027/1015-5759.23.2.63
- Bassi, F., Hagenaars, J. A., Croon, M. A., & Vermunt, J. K. (2000). Estimating true changes when categorical panel data are affected by uncorrelated and correlated classification errors: An application to unemployment data. Sociological Methods & Research, 29, 230–268. https://doi.org/10.1177/0049124100029002003
- Billiet, J., & Davidov, E. (2008). Testing the stability of an acquiescence style factor behind two interrelated substantive variables in a panel design. Sociological Methods & Research, 36, 542–562. https://doi.org/10.1177/0049124107313901
- Billiet, J., & McClendon, M. (2000). Modeling acquiescence in measurement models for two balanced sets of items. Structural Equation Modeling: A Multidisciplinary Journal, 7, 608–628. https://doi.org/10.1207/S15328007SEM07045
- Blom, A. G., Bosnjak, M., Cornilleau, A., Cousteaux, A.-S., Das, M., Douhou, S., & Krieger, U. (2016). A comparison of four probability-based online and mixed-mode panels in Europe. Social Science Computer Review, 34, 8–25. https://doi.org/10.1177/0894439315574825
- Boeschoten, L., Filipponi, D., & Varriale, R. (2021). Combining multiple imputation and hidden markov modeling to obtain consistent estimates of employment status. Journal of Survey Statistics and Methodology, 9, 549–573. https://doi.org/10.1093/jssam/smz052
- Bollen, K. (1989). Structural equations with latent variables. Wiley-Interscience Publication.
- Campbell, D. T., & Fiske, D. W. (1959). Convergent and discriminant validation by the multitrait-multimethod matrix. Psychological Bulletin, 56, 81–105. https://doi.org/10.1037/h0046016
- Cernat, A., & Sakshaug, J. W. (Eds.). (2021). Measurement error in longitudinal data. Oxford University Press.
- Cernat, A., Couper, M. P., & Ofstedal, M. B. (2016). Estimation of mode effects in the health and retirement study using measurement models. Journal of Survey Statistics and Methodology, 4, 501–524. https://doi.org/10.1093/jssam/smw021
- Cernat, A., Lugtig, P., Uhrig, S. N., & Watson, N. (2021). Assessing and relaxing assumptions in quasi-simplex models. In A. Cernat & J. W. Sakshaug (Eds.), Measurement error in longitudinal data (pp. 155–171). Oxford University Press.
- Cernat, A., & Oberski, D. L. (2019). Extending the within‐persons experimental design: The multitrait‐multierror MTME approach. In P. Lavrakas, M. Traugott, C. Kennedy, A. Holbrook, E. de Leeuw, & B. West (Eds.), Experimental methods in survey research (1st ed., pp. 481–500). Wiley. https://doi.org/10.1002/9781119083771.ch24
- Cernat, A., & Oberski, D. L. (2021). Estimating stochastic survey response errors using the multitrait-multierror model. Journal of the Royal Statistical Society Series A, 185, 134–155.
- Cole, D., & Maxwell, S. (2003). Testing mediational models with longitudinal data: Questions and tips in the use of structural equation modeling. Journal of Abnormal Psychology, 112, 558–577. https://doi.org/10.1037/0021-843X.112.4.558
- DeMaio, T. (1984). Social desirability and survey measurement: A review. In C. Turner & E. Martin (Eds.), Surveying subjective phenomena (pp. 257–282). Russell Sage Foundation.
- Fisher, R. J., & Katz, J. E. (2000). Social-desirability bias and the validity of self-reported values. Psychology and Marketing, 17, 105–120. https://doi.org/10.1002/(SICI)1520-6793(200002)17:2<105::AID-MAR3>3.0.CO;2-9
- Fuller, W. A. (1987). Measurement error models. Wiley-Interscience.
- Gelman, A., & Rubin, D. B. (1992). Inference from iterative simulation using multiple sequences. Statistical Science, 457–472.
- Geiser, C., Eid, M., Nussbeck, F. W., Courvoisier, D. S., & Cole, D. A. (2010). Multitrait-multimethod change modelling. AStA Advances in Statistical Analysis, 94, 185–201. https://doi.org/10.1007/s10182-010-0127-0
- Graziano, W. G., & Tobin, R. M. (2002). Agreeableness: Dimension of personality or social desirability artifact? Journal of Personality, 70, 695–727. https://doi.org/10.1111/1467-6494.05021
- Grimm, K. J., Pianta, R. C., & Konold, T. (2009). Longitudinal multitrait-multimethod models for developmental research. Multivariate Behavioral Research, 44, 233–258. https://doi.org/10.1080/00273170902794230
- Groves, R. M. (Ed.). (2009). Survey methodology (2nd ed.). Wiley.
- Haberecht, K., Schnuerer, I., Gaertner, B., John, U., & Freyer-Adam, J. (2015). The stability of social desirability: A latent change analysis. Journal of Personality, 83, 404–412. https://doi.org/10.1111/jopy.12112
- Hagenaars, J. A. (2018). Confounding true and random changes in categorical panel data. In M. Giesselmann, K. Golsch, H. Lohmann, & A. Schmidt-Catran (Eds.), Lebensbedingungen in Deutschland in der Längsschnittperspektive (pp. 245–266). Springer. https://doi.org/10.1007/978-3-658-19206-8_14
- Hamaker, E. L., Kuiper, R. M., & Grasman, R. P. P. P. (2015). A critique of the cross-lagged panel model. Psychological Methods, 20(1), 102–116. https://doi.org/10.1037/a0038889
- Heise, D. R. (1969). Separating reliability and stability in test-retest correlation. American Sociological Review, 34, 93–101. https://doi.org/10.2307/2092790
- Helm, J. L., Castro-Schilo, L., & Oravecz, Z. (2017). Bayesian versus maximum likelihood estimation of multitrait–multimethod confirmatory factor models. Structural Equation Modeling: A Multidisciplinary Journal, 24, 17–30. https://doi.org/10.1080/10705511.2016.1236261
- Holtmann, J., Koch, T., Bohn, J., & Eid, M. (2020). Multimethod assessement of time-stable and time-variable interindividual differences. European Journal of Psychological Assessment, 36, 1024–1043. https://doi.org/10.1027/1015-5759/a000577
- Institute for Social and Economic Research (2021). Understanding society – the UK household longitudinal study, innovation panel, waves 1-13, user manual (pp.1–214). University of Essex. https://doc.ukdataservice.ac.uk/doc/6849/mrdoc/pdf/6849_ip_waves_1-13_user_manual_oct_2021.pdf
- King, G., Murray, C. J. L., Salomon, J. A., & Tandon, A. (2003). Enhancing the validity and cross-cultural comparability of measurement in survey research. American Political Science Review, 97, 567–583. https://doi.org/10.1017/S0003055403000881
- Koch, T., Holtmann, J., Eid, M., & West, S. G. (2020). Analyzing longitudinal multirater data with changing and stable raters. Structural Equation Modeling: A Multidisciplinary Journal, 27, 73–87. https://doi.org/10.1080/10705511.2019.1638784
- Kreuter, F., Presser, S., & Tourangeau, R. (2008). Social desirability bias in CATI, IVR, and web surveys the effects of mode and question sensitivity. Public Opinion Quarterly, 72, 847–865. https://doi.org/10.1093/poq/nfn063
- Krosnick, J. A. (1991). Response strategies for coping with the cognitive demands of attitude measures in surveys. Applied Cognitive Psychology, 5, 213–236. https://doi.org/10.1002/acp.2350050305
- Krumpal, I. (2013). Determinants of social desirability bias in sensitive surveys: A literature review. Quality & Quantity, 47, 2025–2047. https://doi.org/10.1007/s11135-011-9640-9
- Leitgöb, H., Seddig, D., Schmidt, P., Sosu, E., & Davidov, E. (2021). Longitudinal measurement (non)invariance in latent constructs: Conceptual insights, model specifications, and testing strategies. In A. Cernat & J. Sakshaug (Eds.), Measurement error in longitudinal data. Oxford University Press. https://doi.org/10.1093/oso/9780198859987.003.0010
- Little, T. D. (2013). Longitudinal structural equation modeling. Guilford Press.
- Lönnqvist, J.-E., Paunonen, S., Tuulio-Henriksson, A., Lönnqvist, J., & Verkasalo, M. (2007). Substance and style in socially desirable responding. Journal of Personality, 75, 291–322. https://doi.org/10.1111/j.1467-6494.2006.00440.x
- Lord, F. M., & Novick, M. R. (1968). Statistical theories of mental test scores. Addison-Wesley Publishing Company, Inc.
- Lynn, P., & Lugtig, P. J. (2017). Total survey error for longitudinal surveys. In P. P. Biemer, E. de Leeuw, S. Eckman, B. Edwards, F. Kreuter, L. E. Lyberg, N. C. Tucker, & B. T. West (Eds.), Total survey error in practice (pp. 279–298). John Wiley & Sons, Inc. https://doi.org/10.1002/9781119041702.ch13
- McClendon, M. (1991). Acquiescence and recency response-order effects in interview surveys. Sociological Methods & Research, 20, 60–103. https://doi.org/10.1177/0049124191020001003
- Moors, G., Kieruj, N. D., & Vermunt, J. K. (2014). The effect of labeling and numbering of response scales on the likelihood of response bias. Sociological Methodology, 44, 369–399. https://doi.org/10.1177/0081175013516114
- Muthén, L. K., & Muthen, B. (2017). Mplus user’s guide: Statistical analysis with latent variables, user’s guide. Muthén & Muthén.
- Oberski, D. L., Hagenaars, J. A. P., & Saris, W. E. (2015). The latent class multitrait-multimethod model. Psychological Methods, 20, 422–443. https://doi.org/10.1037/a0039783
- Oberski, D. L., Kirchner, A., Eckman, S., & Kreuter, F. (2017a). Evaluating the quality of survey and administrative data with generalized multitrait-multimethod models. Journal of the American Statistical Association, 112, 1477–1489. https://doi.org/10.1080/01621459.2017.1302338
- Paccagnella, O. (2021). Self-evaluation, differential item functioning, and longitudinal anchoring vignettes. In Measurement error in longitudinal data. Oxford University Press. https://doi.org/10.1093/oso/9780198859987.003.0012
- Pankowska, P., Bakker, B., Oberski, D. L., & Pavlopoulos, D. (2018). Reconciliation of inconsistent data sources by correction for measurement error: The feasibility of parameter re-use. Statistical Journal of the IAOS, 34, 317–329. https://doi.org/10.3233/SJI-170368
- Pavlopoulos, D., Pankowska, P., Bakker, B., & Oberski, D. (2021). Modelling error dependence in categorical longitudinal data. In Measurement error in longitudinal data. Oxford University Press. https://doi.org/10.1093/oso/9780198859987.003.0008
- Program on Global Aging, Health & Policy (2021). Gateway to global aging data. https://g2aging.org/?section=documentation
- Saris, W., & Gallhofer, I. (2007). Design, evaluation, and analysis of questionnaires for survey research (1st ed.). Wiley-Interscience.
- Saris, W., Oberski, D. L., Revilla, M., Zavala-Rojas, D., Lilleoja, L., Gallhofer, I., Gruner, T. (2011). The development of the program SQP 2.0 for the prediction of the quality of survey questions (RECSM Working Paper No. 24; RECSM Working Paper). RECSM. https://www.semanticscholar.org/paper/The-development-of-the-program-SQP-2.0-for-the-of-Saris-Oberski/4bcdce3e737830efc6e20632c4536e1240a7ee07
- Saris, W. E., & Revilla, M. (2016). Correction for measurement errors in survey research: Necessary and possible. Social Indicators Research, 127, 1005–1020. https://doi.org/10.1007/s11205-015-1002-x
- Saris, W. E., Révilla, M., Krosnick, J. A., & Shaeffer, E. M. (2010). Comparing questions with agree/disagree response options to questions with item-specific response options. Survey Research Methods, 4, 61–79.
- Saris, W., Satorra, A., & Coenders, G. (2004). A new approach to evaluating the quality of measurement instruments: The split-ballot MTMM design. Sociological Methodology, 34, 311–347. https://doi.org/10.1111/j.0081-1750.2004.00155.x
- Saris, W., & Van Meurs, A. (1991). Evaluation of measurement instruments by meta-analysis of multitrait multimethod studies. North-Holand.
- Scherpenzeel, A., & Saris, W. (2007). Multitrait-multimethod models for longitudinal research. In K. van, J. Oud, & A. Satorra (Eds.), Longitudinal models in the behavioral and related sciences (pp. 381–401). Lawrence Erlbaum Associates Publishers.
- Schmitt, M. J., & Steyer, R. (1993). A latent state-trait model (not only) for social desirability. Personality and Individual Differences, 14, 519–529. https://doi.org/10.1016/0191-8869(93)90144-R
- Spector, P. E., Rosen, C. C., Richardson, H. A., Williams, L. J., & Johnson, R. E. (2019). A new perspective on method variance: A measure-centric approach. Journal of Management, 014920631668729, 45, 855–880. https://doi.org/10.1177/0149206316687295
- Tourangeau, R., Rips, L. J., & Rasinski, K. (2000). The psychology of survey response (1st ed.). Cambridge University Press.
- Turek, K., Kalmijn, M., & Leopold, T. (2021). The comparative panel file: Harmonized household panel surveys from seven countries. European Sociological Review, 37, 505–523. https://doi.org/10.1093/esr/jcab006
- Van De Pol, F., & De Leeuw, J. (1986). A latent Markov model to correct for measurement error. Sociological Methods & Research, 15, 118–141. https://doi.org/10.1177/0049124186015001009
- van de Pol, F., & Langeheine, R. (1990). Mixed markov latent class models. In C. C. Clogg (Ed.), Sociological methodology (Vol. 20, pp. 213–247). Blackwell. https://doi.org/10.2307/271087
- Wiley, J., & Wiley, M. (1974). A note on correlated errors in repeated measurements. Sociological Methods & Research, 3, 172–188. https://doi.org/10.1177/004912417400300202
Appendix
Figure A1. Variance decomposition by wave, form and question.