
 ?Mathematical formulae have been encoded as MathML and are displayed in this HTML version using MathJax in order to improve their display. Uncheck the box to turn MathJax off. This feature requires Javascript. Click on a formula to zoom.
Abstract
Linear energy transfer (LET) dependence of yields of O2-dependent and O2-independent hydrogen peroxide (H2O2) in water irradiated by ionizing radiation was investigated. The radiation-induced hydroxyl radical (•OH) generation in an aqueous solution was reported to occur in two different localization densities, the milli-molar (relatively sparse) and/or molar (markedly-dense) levels. In the milli-molar-level •OH generation atmosphere, •OH generated at a molecular distance of ∼7 nm are likely unable to interact. However, in the molar-level •OH generation atmosphere, several •OH were generated with a molecular distance of 1 nm or less, and two •OH can react to directly make H2O2. An aliquot of ultra-pure water was irradiated by 290-MeV/nucleon carbon-ion beams at the Heavy-Ion Medical Accelerator in Chiba (HIMAC, NIRS/QST, Chiba, Japan). Irradiation experiments were performed under aerobic or hypoxic (<0.5% oxygen) conditions, and several LET conditions (13, 20, 40, 60, 80, or >100 keV/μm). H2O2 generation in irradiated samples was estimated by three methods. The amount of H2O2 generated per dose was estimated and compared. O2-independent H2O2 generation, i.e. H2O2 generation under hypoxic conditions, increased with increasing LET. On the other hand, the O2-dependent H2O2 generation, i.e. subtraction of H2O2 generation under hypoxic conditions from H2O2 generation under aerobic conditions, decreased with increasing LET. This suggests that the markedly-dense •OH generation is positively correlated with LET. High-LET beams generate H2O2 in an oxygen-independent manner.
Introduction
The biological effects of ionizing radiation are induced by two different mechanisms, direct action and indirect action [Citation1‒3]. Direct action starts from direct ionization/excitation of a biologically important molecule by ionizing radiation. Indirect action starts from a chemical reaction of a biological molecule with reactive species, such as reactive oxygen species (ROS) or other free radical species, generated via water radiolysis [Citation4]. As ionizing radiation does not discriminate among molecular interactions, the ratio of direct and indirect action is determined by the volume ratio of target molecules. Ionizing radiation interacts with water molecules, which account for approximately 70% of the weight of living organisms, at a higher rate than other molecules. Thus, roughly 70% of the biological effects of ionizing radiation are generally considered to be due to indirect action mediated by ROS and/or other reactive species.
In a precise sense, the ratio of direct and indirect reactions may be decided depending on the micro-/nano-environment in the cell. Water molecules in the cytoplasm are held in a lattice/grid or reticulate structure made of proteins, similar to jelly. In the nucleus, DNA is wound-up and packed closely, and there is less water, which may be hydrate water. In the membrane structure, almost no water exists. Therefore, the ratio of direct and indirect reactions may depend on the density of biological molecules. In addition, the type of ROS that acts as the main player in such micro/nano-environments in the cell is an important factor for determining the ratio of direct actions to indirect actions. The chemical reactivity and physical properties, such as membrane permeability, are different depending on the ROS.
A water molecule can be ionized (EquationEquations (1(1)
(1) ‒4)) or excited (EquationEquation (5)
(5)
(5) ) by ionizing radiation, and then generate hydroxyl radicals (•OH), hydrogen radicals (•H), hydrated electrons (e−aq), and other ions [Citation5,Citation6]:
(1)
(1)
(2)
(2)
(3)
(3)
(4)
(4)
(5)
(5)
The •OH are a chemically short-lived free radical species, generally recognized as the most reactive attacker among ROS. The radiation-induced •OH in an aqueous solution were reported to be generated in two different locations at the milli-molar (relatively sparse) and/or molar (markedly dense) levels [Citation7‒9]. On the other hand, •H is likely given by reacting e−aq with hydrogen ion (H+) (EquationEquation (2)(2)
(2) ) or generated from excited water simultaneously with •OH (EquationEquation (5)
(5)
(5) ).
At the location of relatively sparse •OH generation, •OH generated at a molecular distance of ∼7 nm are likely unable to interact during their markedly short lifetime. Instead, •H can react with dissolved oxygen (O2) to generate hydroperoxyl radicals (HO2•) (EquationEquation (6)(6)
(6) ).
(6)
(6)
Then, a pair of HO2• molecules can react to generate H2O2 and O2 (EquationEquation (7)(7)
(7) ).
(7)
(7)
One H2O2 molecule is generated by consuming one O2 molecule. Thus, O2-dependent H2O2 generation can be an index of such sparse ionization.
At the location of markedly dense •OH generation, several •OH are generated with a molecular distance of 1 nm or less, and two or more •OH can react to directly make H2O2. H2O2 can be generated O2-independently by the reaction of a pair of •OH (EquationEquation (8)(8)
(8) ).
(8)
(8)
In such markedly dense •OH conditions, the H2O2 can react with another •OH and may yield hydroperoxyl radicals (HO2•) (EquationEquation (9)(9)
(9) ).
(9)
(9)
Then, a pair of HO2• molecules can react to again generate H2O2 and O2 (EquationEquation (7)(7)
(7) ). Ratios of the relatively sparse •OH yields to the total •OH yields decreased with increasing LET [Citation7,Citation9]. Therefore, there will be markedly dense generation at the principal location of •OH generation by higher LET beams. Indeed, O2 consumption decreased with increasing LET [Citation9,Citation10]. Previous reports [Citation7,Citation9,Citation10] suggested that O2-independent H2O2 generation increases with increasing LET.
Carbon-ion beams have a track structure consisting of a core region, which is formed by linear dense ionization caused by primary particles and the penumbra region, which is branched ionization tracks formed by secondary electrons [Citation11]. Therefore, O2-dependent and -independent formation of H2O2 is expected in the penumbra and core regions, respectively. In addition, the ratio of the O2-dependent and -independent formation of H2O2 may be an index of the ratio of relatively sparse and markedly dense ionization/excitation. In this study, LET dependence of the O2-independent H2O2 formation in water during carbon-ion beam irradiation was measured experimentally under hypoxic conditions. The LET dependence of the O2-dependent and O2-independent formation of H2O2 was compared.
Materials and methods
Chemicals
5,5-Dimethyl-1-pyrroline-N-oxide (DMPO) was purchased from Dojindo Laboratories, Ltd. (Kumamoto, Japan). H2O2 solution (30%) was purchased from FUJIFILM Wako Pure Chemical Corporation (Osaka, Japan). Other chemicals were of analytical grade. Deionized water (deionization by the Milli-Q system, Merck Millipore, Billerica, MA) was used for all experiments.
Preparation of samples for irradiation under aerobic or hypoxic conditions
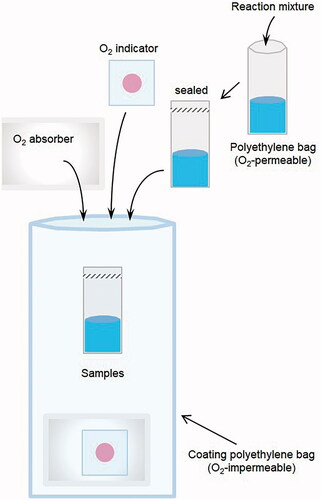
Irradiation experiments were performed under aerobic or hypoxic (<0.5% oxygen) conditions. For irradiation under aerobic conditions, an aliquot of sample solution, i.e. 350 μL of milli-Q water, was placed into a polyethylene micro tube for X-ray irradiation or a polyethylene bag for carbon-ion beam irradiation. For both X-ray and carbon-beam irradiation under hypoxic conditions, milli-Q water was sealed in an O2-permeable polyethylene bag. The samples for hypoxic experiments were moved into a glove box, and then N2 gas was pumped into the glove box to create a 0.5% or less O2 atmosphere. The polyethylene bag containing the sample solution was again sealed in an O2-impermeable bag with an O2-absorber and colorimetric O2-indicator (). The O2-impermeable bag, O2-absorber, and O2-indicator were purchased from I.S.O. Inc. (Yokohama, Japan). The O2-indicator remains pink in a hypoxic (<0.5% O2) atmosphere and changes to bluish-violet when it detects oxygen. The change in color of the O2-indicator is reversible.
Figure 1. Schematic drawing of the sample preparation for irradiation under hypoxic conditions. An aliquot (300‒350 μL) of sample solution was sealed in an O2-permeable polyethylene bag using a heat sealer. The samples were moved into a glove box, and then N2 gas was pumped into the glove box to create a 0.5% or less O2 atmosphere. The PTFE tubing or polyethylene bag containing the sample solution was again sealed in an O2-impermeable bag with an O2-absorber and colorimetric O2-indicator.
X-ray irradiation
The reaction mixture in the polyethylene tube or bag was irradiated by 64 Gy of X-rays using PANTAK 320S (Shimadzu, Kyoto, Japan) at room temperature. The effective energy was 80 keV under the following conditions: X-ray tube voltage was 200 kV, X-ray tube current was 20 mA, and the thickness and materials of the pre-filter were 0.5-mm copper and 0.5-mm aluminum. The dose rate of X-ray irradiation was 3.04–3.15 Gy/min when the distance between the X-ray tube and the sample was 280 mm.
Carbon-ion beam irradiation
The polyethylene bag containing the reaction mixture was attached to a flat acrylic sample holder and irradiated by 64 Gy of 290-MeV/nucleon carbon-ion beams using the Heavy-Ion Medical Accelerator in Chiba (HIMAC, National Institute of Radiological Sciences, Chiba, Japan) at room temperature. Irradiation was performed using several LET conditions (13, 20, 40, 60, 80, or over 100 keV/μm). The calculated LET at the surface of the sample was based on the thickness of the binary filter and the polyethylene bag wall. The dose was planned at the surface of the sample and the dose rates varied depending on the LET.
Quantification of H2O2 generated in an irradiated water sample
H2O2 generation in irradiated water samples was estimated by the UV method proposed in this paper to simplify an experimental procedure and minimize variations in experimental conditions. For comparison, two other methods (see Appendix), the quinoid-dye method and Fenton method, were performed to confirm the reproducibility.
UV method: The •OH synthesized from H2O2 under the UVB irradiation were spin-trapped with DMPO, and the •OH adduct of DMPO (DMPO-OH) was then measured as an index of H2O2 using the X-band electron paramagnetic resonance (EPR) spectrometer. A 90-μl aliquot of irradiated water sample was placed into a micro tube, and 10 μL of 1 M DMPO water solution was added and mixed. The water sample was irradiated with UVB (12,000 μW/cm2) for 5 min. Immediately after UVB irradiation, the water sample was drawn into PTFE (i.d. 0.32 ± 0.001 inches, wall 0.002 ± 0.0005 inches; ZEUS, Orangeburg, SC) tubing and measured using the X-band EPR. X-band EPR spectra were measured repeatedly 13 times every 30 s, and the average intensity of 13 measurements was recorded. The amount of H2O2 generated per dose was estimated using a standard curve previously prepared using a series of H2O2 water solutions of known concentrations (4.9‒29.4 μM).
X-band EPR measurement
The PTFE tubing containing an aliquot of sample solution was placed in the TE mode cavity using a special sample holder and measured using the X-band EPR spectrometer (JEOL, Tokyo Japan). EPR data acquisition was controlled by the WIN-RAD ESR Data Analyzer System (Radical Research, Inc., Hino, Tokyo). The second line from the lower field of four lines of DMPO-OH was scanned. EPR spectra were measured under the following conditions: microwave frequency: 9.45 GHz, microwave power: 2 mW, lower magnetic field: 335.5 mT, field sweep width: +0.75 mT, field sweep resolution: 1024 points, sweep time: 15 s, time constant: 0.01 s, field modulation frequency: 100 kHz, and field modulation width: 0.063 mT. The acquired EPR spectra were analyzed using an in-house line fitting program and the Gaussian line shape was fitted. The signal height and line width of the fitted Gaussian line were measured, and the EPR signal intensity was calculated as (signal height) × (line width)2.
Statistical analysis
Significant differences between values for comparison were estimated using the TTEST function in Microsoft Excel 2010. Suitable “tail” and “type” for the TTEST function were selected as follows: The “tail” was 2 (two-tailed distribution) for stability tests because the difference between the two data groups was compared simply. The “type” was 2 (equal variance) or 3 (unequal variance), which was estimated using the FTEST function, and Student’s or Welch’s t-test was performed according to the “type.” Grades of significance were estimated by p < 0.05, p < 0.01, and p < 0.001.
Results and discussion
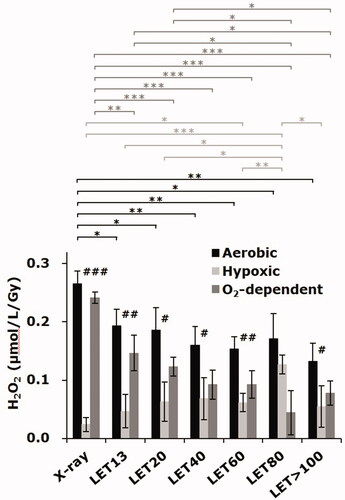
The results of quantification of radiation-induced H2O2 in water under aerobic or hypoxic conditions obtained by the UV method are shown in . Under aerobic conditions, the yield of H2O2 decreased with increasing LET, consistent with a previous report [Citation9]. However, the yield of H2O2 under hypoxic conditions increased with increasing LET, peaking at LET = 80 keV/μm. The H2O2 detected in the sample irradiated under the hypoxic conditions was generated O2-independently. The H2O2 detected in the sample irradiated under the aerobic conditions was the total of O2-independent and -dependent generation. Therefore, the difference in the yield of H2O2 under aerobic conditions from that under hypoxic conditions is the yield of O2-dependent H2O2. The yield of O2-dependent H2O2 decreased with increasing LET. Reduced H2O2 yields under aerobic conditions, i.e. the total of O2-independent and -dependent H2O2, were due to the LET dependency of O2-dependent H2O2 generation.
Figure 2. Carbon-ion beam induced H2O2 in water obtained by the UV method. The columns and the error bars indicate the average and SD of three experiments. Each experiment was carried out with triplicate measurements of aerobic and hypoxic samples. The O2-dependent H2O2 yield, which was the difference between averages of aerobic and hypoxic samples, was calculated in each experiment and averaged among three experiments. #, ##, and ### indicate significance between aerobic and hypoxic conditions with p < 0.05, p < 0.01, and p < 0.001, respectively. *, **, and *** indicate significance between the different LET conditions with p < 0.05, p < 0.01, and p < 0.001, respectively.
It was previously reported that the O2 consumption in the aerobic aqueous sample irradiated by X-rays or carbon-ion beams under several LET conditions decreased with increasing LET [Citation9]. For example, the H2O2 yields in water under aerobic conditions estimated in a previous study [Citation9], which were quantified by the Fenton method (see Appendix in the current paper), were 0.26, 0.20, and 0.17 μmol/L/Gy for X-rays, 20-keV/μm carbon-ion beams, and 80-keV/μm carbon-ion beams, respectively. These values were similar to those observed by the UV method in the current study. As described in the Appendix, however, values observed by the Fenton method and/or quinoid-dye method exhibited relatively large variability among experiments. The LET-dependence of H2O2 yields was almost the same by all methods.
Furthermore, it was previously reported that the ratio of the yield of H2O2 to the O2 consumption in the aqueous sample increased with increasing LET [Citation9]. Oxygen consumption was estimated to be 0.41, 0.39, and 0.15 μmol/L/Gy for X-rays, 20-keV/μm carbon-ion beams, and 80-keV/μm carbon-ion beams, respectively. The ratios of H2O2 generation to oxygen consumption were 0.63, 0.51, and 1.13, for X-rays, 20-keV/μm carbon-ion beams, and 80-keV/μm carbon-ion beams, respectively. This suggests that O2-independent H2O2 generation increases with higher LET irradiation. To confirm this prediction in the previous study experimentally, the H2O2 yields by X-ray or carbon-ion beam irradiation under hypoxic conditions were measured in the current study, which demonstrated that O2-independent H2O2 generation, i.e. H2O2 yields under hypoxic conditions, is positively correlated with LET.
The H2O2 generation under hypoxic conditions likely results from the direct reaction between •OH based on EquationEquation (8)(8)
(8) or a combination of EquationEquations (9)
(9)
(9) and Equation(7)
(7)
(7) in an initially generated dense •OH cluster. Therefore, the O2-independent H2O2 generation is an index of dense •OH generation, which simultaneously suggests dense ionization. The suppression of O2-dependent H2O2 generation, which is based on EquationEquations (6)
(6)
(6) and Equation(7)
(7)
(7) , with increasing LET suggested that sparse ionization is suppressed by increasing LET. Such sparse ionization expected for lower LET radiation may be causing sparse •H and •OH generation, and may lead to greater effects of radiation on oxygen through O2-dependent HO2• and/or H2O2 generation. Relatively stable and membrane permeable H2O2 can travel longer distances and may have a higher chance of reaching itself at a biological target molecule in a cell.
O2-independent H2O2 generation may be important in vivo. The tissue O2 concentration, even in healthy normoxic tissues, is lower than that in the air-equilibrated in vitro situation. The O2 concentration in air-saturated water at 37 °C is 0.21 mM. Extracellular pO2 levels in fat and muscle tissues of healthy mice were reported to be 20 mmHg and 40 mmHg [Citation12], corresponding to 0.027 and 0.054 mM, respectively. In in vivo hypoxic environments, particularly in hypoxic tumors, it will be less than 5 mmHg [Citation13] or 0.007 mM. Bubbling water with 1% O2 can increase the oxygen concentration to around 0.01 mM in water at 37 °C. Higher H2O2 generation in such a low pO2 environment may play a role in the high therapeutic performance of high LET radiation.
Conclusion
H2O2 generation under aerobic conditions, i.e. total H2O2 generation, decreased with increasing LET. H2O2 generation under hypoxic conditions, i.e. O2-independent H2O2 generation, increased with increasing LET. The O2-dependent H2O2 generation, i.e. subtraction of H2O2 generation under hypoxic conditions from that under aerobic conditions, decreased with increasing LET. Higher LET beams can create more H2O2 in an O2-independent manner than lower LET beams and/or photons. As the reaction of 2 •OH is required to generate H2O2 O2-independently, this study suggests that O2-independent H2O2 generation is an index of dense •OH, which produces an intermolecular distance of less than 1 nm. The dense •OH generation and sequential O2-independent H2O2 generation are positively correlated with LET. In conclusion, this study demonstrated that the markedly dense ionization process of high LET radiation resulted in O2-independent H2O2 generation.
Supplemental Material
Download PDF (270.5 KB)Disclosure statement
No potential conflict of interest was reported by the authors.
Additional information
Funding
References
- Hall EJ. Scientific view of low-level radiation risks. Radiographics. 1991;11(3):508–509.
- Goodhead DT. Mechanisms for the biological effectiveness of high-LET radiations. J Radiat Res. 1999;40:1–13.
- Hirayama R, Ito A, Tomita M, et al. Contribution of direct and indirect actions in cell killing by high-LET radiation. Radiat Res. 2009;171(2):212–218.
- Alizadeh E, Sanz AG, Garcia G, et al. Radiation damage to DNA: the indirect effect of low energy electron. J Phys Chem Lett. 2013;4(5):820–825.
- Mitchell JB, DeGraff W, Kaufman D, et al. Inhibition of oxygen-dependent radiation-induced damage by the nitroxide superoxide dismutase mimic, tempol. Arch Biochem Biophys. 1991;289(1):62–70.
- Mitchell JB, Russo A, Kuppusamy P, et al. Radiation, radicals, and images. Ann N Y Acad Sci. 2000;899:28–43.
- Matsumoto K, Ueno M, Nakanishi I, et al. Density of hydroxyl radicals generated in an aqueous solution by irradiating carbon-ion beam. Chem Pharm Bull. 2015;63(3):195–199.
- Ogawa Y, Sekine-Suzuki E, Ueno M, et al. Localized hydroxyl radical generation at mmol/l and mol/l levels in water by photon irradiation. J Clin Biochem Nutr. 2018;63(2):97–101.
- Matsumoto K, Nyui M, Ueno M, et al. A quantitative analysis of carbon-ion beam-induced reactive oxygen species and redox reactions. J Clin Biochem Nutr. 2019;65(1):1–7.
- Matsumoto K, Aoki I, Nakanishi I, et al. Distribution of hydrogen peroxide-dependent reaction in a gelatin sample irradiated by carbon ion beam. Magn Reson Med Sci. 2010;9(3):131–140.
- Muroya Y, Plante I, Azzam EI, et al. High-LET ion radiolysis of water: visualization of the formation and evolution of ion tracks and relevance to the radiation-induced bystander effect. Radiat Res. 2006;165(4):485–491.
- Matsumoto A, Matsumoto S, Sowers AL, et al. Absolute oxygen tension (pO2) in murine fatty and muscle tissue as determined by EPR. Magn Reson Med. 2005;54(6):1530–1535.
- Kishimoto S, Krishna MC, Khramtsov VV, et al. In vivo application of proton-electron double-resonance imaging. Antioxid Redox Signal. 2018;28(15):1345–1364.
- Kasahara Y, Ashihara Y. Colorimetry of angiotensin-I converting enzyme activity in serum. Clin Chem. 1981;27(11):1922–1925.
- Ueda U, Matsumoto K, Endo K. Evidence of hepatic endogenous hydrogen peroxide in bile of selenium-deficient rat. Biochem Biophys Res Commun. 2000;271(3):699–702.
- Ui I, Okajo A, Endo K, et al. Effect of hydrogen peroxide in redox status estimation using nitroxyl spin probe. Free Radic Biol Med. 2004;37(12):2012–2017.
Appendix
Quantification of H2O2 generated in an irradiated water sample by alternative methods
Quinoid-dye method: The H2O2 concentration in the irradiated water samples was measured using the spectrophotometric method [Citation14]. This method is based on measurement of a red quinoid dye formed by a reaction of 4-aminoantipyrine, phenol, and H2O2 under coexisting peroxidase. This quinoid dye can be detected by absorbance at 505 nm using a spectrophotometer.
Fenton method: The •OH synthesized from H2O2 under the presence of Fe2+ were spin-trapped with DMPO, and the •OH adduct of DMPO (DMPO-OH) was then measured as an index of H2O2 using the X-band EPR spectrometer [Citation15, Citation16]. Irradiated water samples (160 µL) were placed in a micro tube and then 500 mmol/L DMPO (20 µL) was added. When 1.0 mmol/L FeSO4 (20 µL) was added, the sample was immediately mixed, transferred to a 25-cm segment of PTFE tubing, and measured using the X-band EPR spectrometer within a minute of mixing. X-band EPR spectra were measured repeatedly 10 times every 30 s, and the maximum intensity among 10 measurements was recorded. The amount of H2O2 generated per dose was estimated using a standard curve previously prepared using a series of H2O2 water solutions of known concentrations (4.9‒29.4 μM).
Standard curves for the quantification of H2O2 were obtained by three methods (Supplementary Figure 1). The relation between the H2O2 concentration in the sample solution and absorption of quinoid dye at 505 nm (Supplementary Figure 1(A)) or EPR signal intensity of DMPO-OH (Supplementary Figure 1(B,C)) was linear. Each standard curve was used for the corresponding experiment.
Although the three methods produced slightly different values, they were all similar (Supplementary Figure 2). The quinoid-dye method gave slightly higher values and the Fenton method gave slightly lower values than the UV method. The values obtained in this study using the quinoid-dye method were higher than those in a previous report [Citation9], whereas those obtained by the Fenton method were lower [Citation9]. These two methods had relatively large variations among individual experiments.
The values obtained by the quinoid-dye method were affected by reaction time and temperature. The enzymatic reaction of three compounds, i.e. phenol, 4-aminoantipyrine, and H2O2, is also affected by quality of peroxidase. Therefore, the standard curve for quantification should be remade for each experiment. This reaction may be good for biological samples, but it requires additional caution. The values obtained by the Fenton method depended largely on the concentration of Fe2+. Relatively low concentrations of H2O2 in the sample water can be detected with good sensitivity, but FeSO4 solution must be freshly prepared and the standard curve for quantification should be remade for each experiment. The values obtained by the UV method only depend on UVB irradiation time under a constant light intensity and the standard curve can be reused if the same lot of DMPO is used.