
Abstract
Glutathione (γ-L-glutamyl-L-cysteinyl-glycine, GSH) is a tripeptide that is part of the antioxidant defense system and contributes to numerous redox-regulatory processes. In vivo, reduced GSH and oxidized glutathione disulfide (GSSG) are present in redox equilibrium and their ratio provides important information on the cellular redox state. Here, we compared three different methods for in vivo quantification of glutathione in tissues of hypertensive rats, an accepted animal model of oxidative stress. In the present study, we used hypertensive rats (infusion of 1 mg/kg/d angiotensin-II for 7 days) to determine the levels of reduced GSH and/or GSH/GSSG ratios in different tissue samples. We used an HPLC-based method with direct electrochemical detection (HPLC/ECD) and compared it with Ellman’s reagent (DTNB) dependent derivatization of reduced GSH to the GS-NTB adduct and free NTB (UV/Vis HPLC) as well as with a commercial GSH/GSSG assay (Oxiselect). Whereas all three methods indicated overall a decreased redox state in hypertensive rats, the assays based on HPLC/ECD and DTNB derivatization provided the most significant differences. We applied a direct, fast and sensitive method for electrochemical GSH detection in tissues from hypertensive animals, and confirmed its reliability for in vivo measurements by head-to-head comparison with two other established assays. The HPLC/ECD but not DTNB and Oxiselect assays yielded quantitative GSH data but all three assays reflected nicely the qualitative redox changes and functional impairment in hypertensive rats. However, especially our GSH/GSSG values are lower than reported by others pointing to problems in the work-up protocol.
Introduction
Oxidative stress, as a consequence of the imbalance between the production of free radicals, reactive oxygen species (ROS) and reactive nitrogen species (RNS) and their degradation by antioxidants, plays a key role in most cardiovascular and neurodegenerative diseases [Citation1–4]. Excessive formation of ROS and RNS results in DNA, lipid and protein damage causing changed/disrupted cellular physiological processes such as enhanced apoptosis [Citation5,Citation6]. Reduced glutathione (γ-L-glutamyl-L-cysteinyl-glycine, GSH) is considered to play a key role in the elimination of ROS and RNS, and determination of the GSH/GSSG ratio may represent one useful read-out of disturbed (extra-) cellular redox metabolism among other redox pairs [Citation7] and accordingly a surrogate marker of oxidative stress. GSH form is prevailing and accounts for more than 98% of total glutathione [Citation8–10]. This tripeptide has a huge impact on detoxifying xenobiotics and heavy metals, maintaining cell homeostasis, controlling gene expression, modulation of immune function and fibrogenesis and in-signal transduction [Citation11–15]. Besides the direct reaction of GSH with ROS and RNS that displays rather slow kinetics, enzymes such as glutathione peroxidase, members of the peroxiredoxin family, glutathione S-transferase and glutaredoxins utilize GSH for the degradation of hydrogen peroxide and other peroxides [Citation14]. Therefore, oxidative stress reduces cellular GSH by direct and indirect pathways [Citation16,Citation17].
Accordingly, in this study, we applied a direct, fast and sensitive method for GSH quantification by electrochemical detection and compared it with an Ellman’s reagent (DTNB)-based HPLC method [Citation18–20] and a commercial GSH/GSSG assay as reported in [Citation21]. In order to compare the three different assays, we used the established rat model of angiotensin-II-induced hypertension that was previously fully characterized regarding the increased blood pressure, impaired vascular function and aggravated inflammation as well as oxidative stress, including uncoupling of endothelial nitric oxide synthase, crosstalk of phagocytic NADPH oxidase with mitochondrial ROS formation [Citation22–24], and the central role of myelomonocytic cells [Citation25]. Importantly, for the comparison of GSH/GSSG assays, we used the identical angiotensin-II treated rats that were included for functional characterization and determination of ROS formation in a previous study (see summary of key data in ) [Citation26].
Figure 1. Effects of 1-week angiotensin-II treatment on blood pressure and vascular function in rats as previously published. AT-II infusion caused arterial hypertension (increased systolic, mean and diastolic blood pressure) on day 4, 5 and 6, or only on day 6, respectively, as measured by tail cuff plethysmography (A, B, C). Arterial hypertension was associated with endothelial dysfunction (impaired acetylcholine, ACh response) but not with smooth muscle dysfunction (unchanged nitroglycerin, NTG response) as measured by isometric tension method using isolated aortic ring segments (D, E). Leukocyte-derived ROS formation (oxidative burst) in whole blood upon stimulation with phorbol ester (PDBu) was increased in AT-II-treated rats as measured by L-012 enhanced chemiluminescence (F). Continuous AT-II infusion increased lucigenin-enhanced chemiluminescence in isolated aortic rings (G). Levels of 2-OH-Pr2+ and Pr2+ were determined by HPLC after ex vivo incubation of the HPr+ probe with freshly isolated aortic tissue (I). Data are presented as mean ± SEM from n = 5–6 (A, B, C, F, G, I) and 12 (D, E) animals/group. p < 0.05: * vs. CTR. Adapted from [Citation26] with permission under the Creative Commons Attribution License agreement.
![Figure 1. Effects of 1-week angiotensin-II treatment on blood pressure and vascular function in rats as previously published. AT-II infusion caused arterial hypertension (increased systolic, mean and diastolic blood pressure) on day 4, 5 and 6, or only on day 6, respectively, as measured by tail cuff plethysmography (A, B, C). Arterial hypertension was associated with endothelial dysfunction (impaired acetylcholine, ACh response) but not with smooth muscle dysfunction (unchanged nitroglycerin, NTG response) as measured by isometric tension method using isolated aortic ring segments (D, E). Leukocyte-derived ROS formation (oxidative burst) in whole blood upon stimulation with phorbol ester (PDBu) was increased in AT-II-treated rats as measured by L-012 enhanced chemiluminescence (F). Continuous AT-II infusion increased lucigenin-enhanced chemiluminescence in isolated aortic rings (G). Levels of 2-OH-Pr2+ and Pr2+ were determined by HPLC after ex vivo incubation of the HPr+ probe with freshly isolated aortic tissue (I). Data are presented as mean ± SEM from n = 5–6 (A, B, C, F, G, I) and 12 (D, E) animals/group. p < 0.05: * vs. CTR. Adapted from [Citation26] with permission under the Creative Commons Attribution License agreement.](/cms/asset/d227c765-57c7-40b3-9315-48e01690854a/ifra_a_2016735_f0001_c.jpg)
Materials and methods
Animals and treatment
All together 24 Wistar rats (6–10 weeks old, 300–350 g body weight, from Charles River Laboratories, Sulzfeld, Germany) were included in the study. The same rats were used to measure the superoxide anion radical (O2•−) as published previously [Citation26]. All treatments were performed in accordance with the Guide for the Care and Use of Laboratory Animals as adapted by the National Institutes of Health and were approved by the University Hospital Mainz Ethics Committee and the authorities (Landesuntersuchungsamt Rheinland-Pfalz, permit number: 23 177-07/G 18-1-001). Arterial hypertension was induced by infusion with angiotensin-II (AT-II, 1.0 mg/kg/d) via mini-osmotic pumps (model 2001 from Alzet, Cupertino, CA) for seven days [Citation26]. Control animals had sham pumps with solvent alone (0.9% saline). Animals were sacrificed by heart puncture and lethal blood removal under isoflurane anesthesia and subsequently kidney, heart, brain and liver as well as blood (for plasma/serum generation) were removed and used for further studies.
Glutathione measurement by Ellman’s reagent-based derivatization and HPLC-dependent UV/vis detection
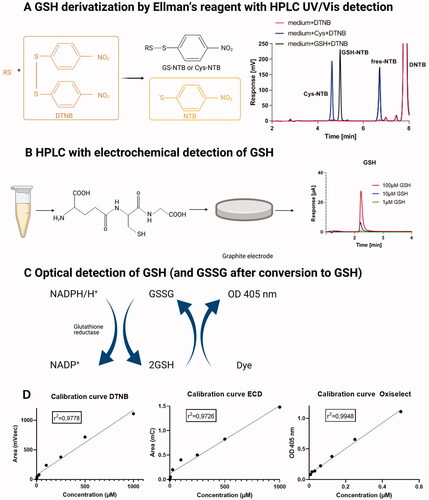
Ellman’s reagent (5,5′-dithiobis-(2-nitrobenzoic acid, DTNB) can be used for derivatization of thiol groups and photometric quantification of a released nitro-chromophore [Citation18–20]. The derivatization reaction yields a mixed disulfide of the thiol with 2-nitro-5-thiobenzoic acid (NTB) as well as free NTB (reflecting the presence of all reduced thiols, also including protein-bound cysteines) that both display long-wavelength absorption (). A defined amount (approximately 100 mg) of tissue from different organs was homogenized in PBS (1 ml/100 mg tissue, with exception for the liver, which was homogenized analogously in KH buffer) with an ultrasound needle (Bandelin, Sonoplus, Berlin, Germany) for 30 s. Next, samples were mixed with acetonitrile (ACN) in a 1:1 ratio and centrifuged for 10 min with 20,000 g. The supernatant was then incubated with 1 mM DTNB for 20 min and stored at −80 °C for at least 24 h. Fifty microliters of these samples were subjected to HPLC analysis. Quantification was performed using standards from incubations of DTNB (2 mM) with cysteine or GSH (each 10–1000 µM). The mobile phase consisted of component (A) citric acid buffer (50 mM, pH 2) and component (B) acetonitrile/water (90:10 v/v%) and a gradient was applied: 0 min, 0% B; 9 min, 100% B; 10 min 100% B; 10.5 min, 0% B. The flow was 1 ml/min and all products were detected at 338 nm and a C18-Nucleosil 100-3 (125 × 4) column from Macherey and Nagel (Düren, Germany) was used. Typical retention times were 4.6 min for the DTNB-cysteine adduct, 5.0 min for the DTNB-GSH adduct and 6.7 min for the free NTB (). The calibration curve is shown in .
Figure 2. Schematic overview of glutathione detection methods. (A) Mechanism of derivatization of reduced thiols by Ellman’s reagent (DTNB) along with representative chromatograms of standards from HPLC analysis with UV/Vis detection. (B) Principle of electrochemical detection of GSH accompanied by representative chromatograms of standards from HPLC analysis. (C) Principle of photometric GSH and GSSG detection with the Oxiselect assay kit, combined with glutathione reductase dependent reduction of GSSG. (D) Calibration curves are shown for each assay.
Glutathione measurement by HPLC-dependent electrochemical detection
An HPLC method with electrochemical detection was established in our laboratory that was modified from previous protocols [Citation27,Citation28]. For the electrochemical detection of GSH an UltiMate 3000 system with Dionex™ CoulArray™ (Coulometric Array Detector, Thermo Fisher Scientific GmbH, Dreieich, Germany) was used. The system was controlled by two different software programs: Chromeleon Chromatography Management System (Chromeleon) software and CoulArray software. The detector consisted of two coulometric multi-electrodes allowing to measure up to eight different redox potentials. At the end of each analysis, a short cleaning procedure of the electrochemical cells (setting all cells to 800 mV) was applied as previously described [Citation29]. The same supernatant as employed for GSH determination by the DTNB/HPLC method was also used for GSH here. The only significant differences were that samples were further centrifuged through a 30 kDa size exclusion filter device and only 10 µl was used for the analysis. The mobile phase consisted of a solution of 50 mM NaH2PO4 at pH4 with an isocratic profile. The flow was 0.5 ml/min and GSH was detected at 800 mV. Electrochemical cells were set up at 250, 400, 600 and 800 mV (). The analysis time was 9 min. A Kinetex C18 column (100 × 4.6 mm, 2.6 μm, Phenomenex, Aschaffenburg, Germany) was used and the column temperature was maintained at 37 °C. The typical retention time was 2.2–2.6 min for GSH (). The calibration curve is shown in .
For determination of the GSH/GSSG ratios the tissues from different rats were used (4 control and 4 AT-II infused) and the isolation as well as HPLC separation protocol was adapted from [Citation30]. Samples were homogenized in 50 mM NaH2PO4 at pH 7 containing 0.1 mM EDTA using an ultrasound needle. Next, the sample was diluted 1:1 with 85% phosphoric acid and centrifuged for 10 min at 20,000 g. Afterwards, the samples were transferred into filter tubes (30 kDa size exclusion filter device) and centrifuged for 30 min at 20,000 g. Finally, 10 µl of supernatant was injected into the HPLC system. The mobile phase consisted of a solution of 50 mM NaH2PO4 at pH 4 with an isocratic profile. The flow was 0.5 ml/min and GSH and GSSG were detected at 800 mV. The analysis time was 9 min. A Kinetex C8 column (100 × 4.6 mm, 2.6 μm, Phenomenex, Aschaffenburg, Germany) was used and the column temperature was maintained at 37 °C. The typical retention time was 2.3–2.5 min for GSH and 3.3–3.5 min for GSSG.
Glutathione and glutathione disulfide quantification by a photometric assay
The same supernatant as employed for GSH determination by the DTNB/HPLC method was also used for GSH/GSSG measurement with an additional dilution of 1:10 in metaphosphoric acid (MPA). A photometric OxiSelect™ Total Glutathione Assay Kit (Cell Biolabs, San Diego, CA, USA) was used for the quantitative measurement of the total concentration of glutathione (GSH + GSSG) from plasma as described [Citation21]. The assay is based on an enzymatic recycling reaction of GSH (). The detection sensitivity limit was 8 nM. Glutathione reductase (GR) reduces oxidized glutathione (GSSG) to reduced GSH in the presence of reduced nicotinamide adenine dinucleotide phosphate (NADPH). Subsequently, the chromophore reacts with the reduced thiol group of GSH to produce a colored compound that absorbs at 405 nm (MILENA KINETIC ANALYZER, Diagnostic Products Corporation, Los Angeles, CA, USA). The total glutathione (GSH + GSSG) content was determined by comparison with a predetermined GSH standard curve. We also performed a measurement without adding GR in order to determine only the reduced glutathione within the samples. The difference between the measurement with and without GR yielded the GSSG concentrations and allowed the calculation of the GSH/GSSG ratio, respectively. The calibration curve is shown in .
Statistical analysis
Results are expressed as mean ± SEM. Unpaired t-test (two-tailed) or, where appropriate, equivalent non-parametric Welch’s t-test or Mann–Whitney U-test was used for all data (Prism for Windows, version 9.01, GraphPad Software Inc.). One-way ANOVA with Tukey’s correction for comparison of multiple means was used for datasets with multiple groups. Testing for equal variance and normal distribution was performed using the same software. P-values < 0.05 were considered as statistically significant. The number of measurements in the different comparisons may vary since not all animals were used in all assays.
Results
Electrochemical detection of glutathione in different tissues and fluids of control and angiotensin-II treated rats using HPLC/ECD
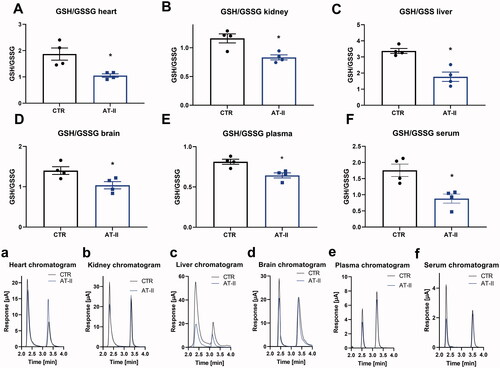
A significant decrease in GSH was detected in cardiac tissue, kidney, liver and plasma of hypertensive, AT-II-treated rats (). Furthermore, there was a marginal, nonsignificant trend of decreased GSH concentration in the brain and serum in the AT-II group (). Overall, established hypertension led to decreased GSH levels in several organs, which was detectable using HPLC-based electrochemical quantification. When determining the GSH/GSSG ratio a significant reduction by AT-II treatment was observed in all tissues and fluids ().
Figure 3. Effects of 1-week angiotensin-II treatment on GSH concentrations measured by HPLC/ECD. Levels of GSH were determined in freshly prepared tissue extracts using an HPLC method with direct electrochemical detection in the heart (A), kidney (B), liver (C), brain (D), plasma (E), serum (F) freshly isolated from control or AT-II-infused rats. For calculation of real tissue or fluid GSH concentrations, dilution factors of 1:20 (for tissues) and 1:2 (for fluids) must be considered. (a-f) Representative chromatograms are shown for all measurements. Data are presented as mean ± SEM from n = 7–9 (A–F). p < 0.05: * versus CTR.
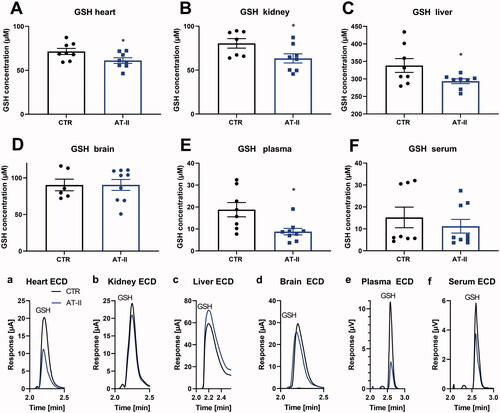
Figure 4. Effects of one-week angiotensin-II treatment on GSH/GSSG ratios measured by HPLC/ECD. Ratios of GSH/GSSG were determined in freshly prepared tissue extracts using a HPLC method with direct electrochemical detection in the heart (A), kidney (B), liver (C), brain(D), plasma (E), serum (F) freshly isolated from control or AT-II-infused rats. (a–f) Representative chromatograms are shown for all measurements. Data are presented as mean ± SEM from n = 4 (A–F). p < 0.05: * vs. CTR.
Optical detection of GSH and protein-bound thiols by derivatization of plasma samples by Ellman’s reagent in different tissues and fluids of normotensive and hypertensive rats using HPLC
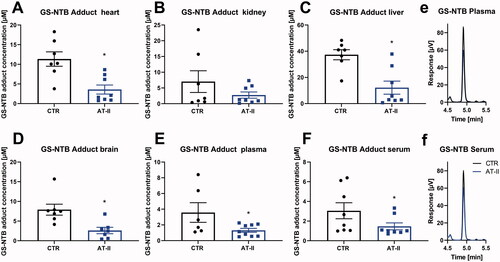
Levels of free NTB from the reaction of reduced thiols (including low-molecular-weight thiols such as GSH and free cysteine as well as protein-bound thiols) with DTNB were significantly decreased in almost all of the analyzed tissues and fluids except in the liver of AT-II-treated rats (). Solely hepatic levels decreased only by trend. Levels of the GS-NTB adduct were also measured within the same HPLC run and showed a significant decrease in almost all of the analyzed tissues and fluids except in the kidney, where the levels were decreased only by trend ().
Figure 5. Effects of one-week angiotensin-II treatment on free NTB levels measured by HPLC/Ellman’s reagent quantification. Levels of free NTB (formed from all reduced thiols, for example, GSH, cysteine but also protein-bound) were determined in freshly prepared tissue extracts using Ellman’s reagent derivatization of reduced thiols combined to an HPLC method with UV detection in the heart (A), kidney (B), liver (C), brain (D), plasma (E), serum (F) freshly isolated from control or AT-II-infused rats. For calculation of real tissue or fluid concentrations of reduced thiols, dilution factors of 1:20 (for tissues) and 1:2 (for fluids) must be considered.(a,d) Representative chromatograms are shown for heart and brain measurements. Data are presented as mean ± SEM from n = 6–9 (A–F). p < 0.05: * versus CTR.
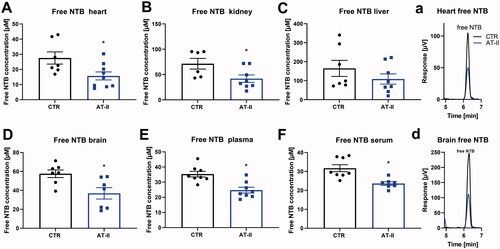
Figure 6. Effects of 1-week angiotensin-II treatment onGS-NTB adduct levels measured by HPLC/Ellman’s reagent quantification. Levels of GS-NTB adduct (formed from reduced GSH) were determined in freshly prepared tissue extracts using Elman’s reagent derivatization of reduced thiols combined with an HPLC method with UV detection in the heart (A), kidney (B), liver (C), brain (D), plasma (E), serum (F) freshly isolated from control or AT-II-infused rats. For calculation of real tissue or fluid GSH concentrations, dilution factors of 1:20 (for tissues) and 1:2 (for fluids) must be considered. (e,f) Representative chromatograms are shown for plasma and serum measurements. Data are presented as mean ± SEM from n = 6–9 (A–F). p < 0.05: * vs. CTR.
Photometric detection of glutathione and glutathione disulfide in different tissues and fluids of angiotensin-II-treated rats
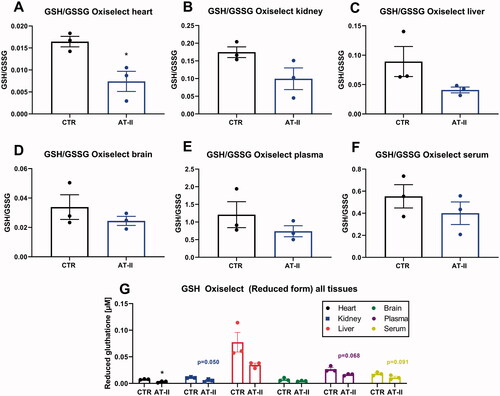
Using a commercial photometric assay kit, the GSH/GSSG ratio was determined and revealed a significant decrease only for heart tissue of hypertensive animals when compared to controls. In the rest of the tissues, nonsignificant trends of various strengths toward decrease upon AT-II treatment were observed (). The absolute GSH concentrations were lower in all tissues of the hypertensive animals, at least by trend ().
Figure 7. Effects of one-week angiotensin-II treatment on GSH/GSSG ratios by commercial kit determination. Ratio of GSH/GSSG was determined in freshly prepared tissue extracts with Oxiselect assay kit in the stored heart (A), kidney (B), liver (C), brain (D), plasma (E), serum (F) freshly isolated from control or AT-II-infused rats. (G) Absolute concentrations of reduced glutathione in all tissue extracts and fluids comparing control and hypertensive animals. For calculation of real tissue or fluid GSH concentrations, dilution factors of 1:200 (for tissues) and 1:20 (for fluids) must be considered. Data are presented as mean ± SEM from n = 3 (A-G). p < 0.05: * vs. respective CTR.
Discussion
Since GSH is the most abundant intracellular nonprotein thiol which plays a major role in the redox homeostasis and oxidative stress defense and its aberrant intracellular levels are closely related to various cardiovascular and neurodegenerative diseases [Citation31], its determination (especially the GSH/GSSG ratio) provides a direct read-out of the cellular redox state, and consequently, the severity of oxidative stress burden in the respective disease condition. However, one of the most challenging points in the detection of GSH is its specific measurement along with other thiol-containing molecules in the cell and biological fluids [Citation14].
GSH is a ubiquitous biological antioxidant that is indispensable for balancing the redox state of the cell and allowing physiological (beneficial) cellular redox signaling. The potent antioxidant function of GSH is further enhanced by three members of the glutathione peroxidase (GPx) family and by one of the peroxiredoxins (Prdx 6). Reactions with these enzymes reduce hydrogen peroxide (H2O2) by GSH into H2O and GSSG [Citation14]. GSSG is consequently reduced back to GSH by GR at the cost of NADPH forming a redox cycle [Citation32,Citation33]. As GSH/GSSG ratio describes the intracellular redox potential to prevent redox imbalance when oxidative stress overpowers the cellular capacity for reducing GSSG to GSH, GSSG can be released out of the cells or reacts with a protein sulfhydryl group leading to the formation of a mixed disulfide. Therefore, oxidative stress reduces cellular GSH. Vice versa GSH is directly engaged in cellular redox signaling by at least two mechanisms [Citation34]: Protein S-glutathionylation and cysteine S-nitrosation through thiol or thiolate (−S−) exchange with S-nitrosoglutathione (GSNO). In addition, GSH can also indirectly take place in redox signaling by altering cellular redox homeostasis [Citation35].
Previous studies have suggested that a dysregulated GSH system might be associated with hypertension. For example, inhibition of GSH synthesis (using buthionine sulfoximine) significantly increases oxidative stress and blood pressure in healthy rats [Citation36]. It has also been observed that GPx expression is diminished in the plasma of patients with end-stage renal diseases [Citation37–39]. Furthermore, lack of GPx expression was shown to be connected to endothelial dysfunction [Citation39,Citation40] and atherosclerosis [Citation41]. For this reason, we used an established animal model of arterial hypertension to test a method with electrochemical detection of GSH (or GSH/GSSG) and compare it head-to-head with two other well-accepted methods. One of the important advantages of the present method is that it uses lower potentials as compared to a previously described protocol [Citation42].
There are several complications to measure free GSH and GSSG levels precisely. GSH can be non-enzymatically oxidized to GSSG by molecular oxygen during sample storage. Furthermore, GSH reacts with protein disulfides, and consequently, thiol disulfide exchange can take place. Under regular conditions, GSH is present in mammalian cells in concentrations between 1–10 mM [Citation43], and the molar ratio of GSH/GSSG is maintained at about 100:1 to 1,000:1 [Citation44]. Thus, oxidation of the small amount of GSH to GSSG (even during work-up of the samples) or the presence of protein-SSG adducts notably affect the GSH/GSSG ratio [Citation45].
The key steps of sample preparation for thiol quantification are as follows [Citation46]: 1. Sample collection and conservation; 2. Precipitation of proteins; 3. Blocking of free thiol groups; 4. Reduction of disulfides; 5. Derivatization. Numerous chemiluminescence [Citation47], spectrofluorometric [Citation48] and spectrophotometric [Citation49,Citation50] methods have been used for GSH determination in different biological samples. Moreover, chromatographic methods with enhanced specificity and sensitivity were developed using high-performance liquid chromatography (HPLC) coupled to ultraviolet [Citation51], fluorescence [Citation52] and coulometric electrochemical detection [Citation53] as well as mass spectroscopy [Citation54] and capillary electrophoresis [Citation55,Citation56]. However, most of these methods require either precolumn or postcolumn derivatization of GSH with fluorescent (monobromobimane, o-phthalaldehyde), and chromophoric (N-ethylmaleimide or iodoacetic acid) agents or reduction with reducing agents [Citation57], which often rely on time-consuming protocols and are prone to the loss of sensitivity in each derivatization step.
Due to the different methods for measurement of GSH, GSSG and consecutive GSH/GSSG ratio applied for in vivo determination of cellular redox state, published reports show quite pronounced differences in concentrations. In humans, glutathione concentrations were primarily determined in the blood (). The main occurrence of GSH and GSSG was found primarily in red blood cells, explaining why GSH/GSSG ratio in human studies is usually not determined in plasma or serum. The different studies summarized in show a variation of up to 163-fold change for the GSH/GSSG ratio, which is mostly due to a variation of up to 108-fold change for the GSSG concentration (varying between 0.64 and 69.2 µM), whereas the determination of the concentration of reduced GSH seemed to be quite reproducible (varying between 0.78 and 1.4 mM, ). Importantly, two studies also investigated concentrations of reduced GSH in normotensive versus hypertensive subjects, which were reduced in one but increased in the other study, again highlighting the uncertainty of thiol determination in biological samples.
Table 1. GSH, GSSG and GSH/GSSG ratio values in human whole blood samples.
In laboratory animals, also other organ systems besides blood were investigated for their GSH, GSSG concentrations and GSH/GSSG ratio (). The GSH concentrations showed a significant variation among the different tissues and fluids measured from rats, displaying an 822-fold difference when comparing GSH concentrations in the liver with serum or plasma. Even the GSH concentrations measured in plasma by two independent studies showed a 22-fold difference (). Also, GSSG concentrations showed a roughly 43-fold difference when comparing values from the liver with serum or blood. Finally, the GSH/GSSG ratios between different tissues and fluids showed a 600-fold difference when comparing values from blood and lung. Even the GSH/GSSG ratio measured in the lung by two independent studies showed a 62-fold difference ().
Table 2. GSH, GSSG and GSH/GSSG ratio values in different rat tissue.
We show here that the decreased GSH amount in different tissues and fluids correlated with the previously reported increased ROS formation in rats with AT-II induced hypertension but also with impairment of functional parameters such as endothelial dysfunction and elevated blood pressure [Citation26]. When comparing our HPLC/ECD data () with those from published studies in rats (), we can confirm that liver showed the highest concentrations of reduced GSH, whereas plasma and serum showed the lowest levels. The absolute concentrations varied from published ones, probably due to differences in sample dilution during the work-up of the tissues and fluids. Even within our study, there were pronounced differences in GSH concentrations (up to 1000-fold) when comparing the electrochemical method with the results from plate reader-based spectrophotometric measurements using the commercial assay (compare and ), even when adjusting for the different dilution factors introduced during the work-up of the samples. These differences are most probably the result of different tissue preparation protocols and whether samples were used on the same day as done for ECD/HPLC or stored several weeks as done for the OxiSelect assay (usually samples for a 96-well plate assay are collected until all samples are ready to be measured in a single plate assay).
A major advantage of the HPLC-based electrochemical detection method is definitely the fact that it represents a direct method without requiring derivatization. In addition, a very small amount of sample is required (10 µL). So all together, it makes this method fast, economical, sensitive and, in our hands, specific for reduced glutathione. Others were also able to detect GSH and GSSG in the same run using the HPLC/ECD method, in order to report the GSH/GSSG ratio, which is a more accurate read-out of oxidative stress conditions than only reporting the reduced GSH concentrations [Citation27,Citation28]. Even electrochemical detection of GSNO in the same run should be possible [Citation27]. When we measured GSH/GSSG ratios by the HPLC/ECD method, we found values in the different tissues that were below those reported in the literature, ranging from 10- to 150-fold lower values when comparing to data generated by other methods [Citation58–62] or 2- to 10-fold lower values when comparing to values based on a similar HPLC/ECD method [Citation30,Citation63] (compare and ). Ellman’s reagent-based derivatization and HPLC-dependent UV/Vis detection method also yielded significant differences between the different tissues and fluids isolated from normotensive versus hypertensive rats and may be a method of choice for rapid analyses of the redox state in tissues isolated from animal models of diseases involving oxidative stress components. This may be due to the fact that derivatization “conserves” the thiol state by adding DTNB – so no autoxidation or loss due to oxidative degradation afterwards. As a result, it explains why concentrations of reduced GSH (GS-NTB) are magnitudes higher than those GSH concentrations measured by plate reader-based spectrophotometric method (Oxiselect). In addition, DTNB assay yields not only free reduced GSH levels (GS-NTB adduct) but also the sum of all reduced thiols including protein-bound thiols (free NTB), which may even better reflect the redox state of a given biological sample than GSH/GSSG alone. However, since the major changes in redox state are usually due to alterations of GSSG concentrations, the DTNB assay may need combination with GR to become more sensitive. Importantly, Ellman’s reagent-based derivatization is designed for fresh samples, conserving the thiol redox state, which can then be stored for weeks or even months until measurement. The HPLC-based electrochemical detection was applied to freshly isolated samples explaining the high recovery of reduced GSH. In contrast, the samples for the colorimetric plate reader-based method (Oxiselect) were collected over weeks and stored at −80 °C until measurement of the 96-well plate, which may explain the quite low recovery of reduced GSH (in part also due to the extra dilution step of 1:10 as compared to HPLC assays) and high levels of GSSG shifting the GSH/GSSG ratio to levels <1.
The remaining question is why the DTNB method detected lower reduced GSH concentrations than those found by the HPLC/ECD method (compare and ). The GS-NTB adduct concentrations are 5- to 10-fold lower in all tissues, plasma and serum than the GSH concentrations determined by HPLC/ECD. Even more surprising is the finding that even the total concentration of all reduced thiols (including low-molecular-weight thiols and protein-bound thiols as reflected by free NTB levels) is up to 3-fold lower in all tissues than the GSH concentrations determined by HPLC/ECD (compare and ). Only total thiol concentrations in plasma and serum are higher using the DTNB method as compared to HPLC/ECD data. At least, total reduced thiol concentrations (reflected by free NTB) are always higher than the GSH concentrations (reflected by GS-NTB adduct), when comparing only the results of the DTNB assay (compare and ). The only possible explanation for this observation is that the DTNB assay is only semi-quantitative for the tissue homogenates, most probably due to the incomplete cell or cellular compartments lysis during ultrasound-dependent cell disruption. Accordingly, DTNB may not reach all thiol-containing structures within the protein homogenate. This would be in line with the observation that total reduced thiol concentrations in plasma and serum measured by the DTNB assay are higher than the respective GSH concentrations determined by the HPLC/ECD method.
Limitations of the study
As already mentioned above, the values for the GSH/GSSG ratio determined by us are below the range reported in the literature. Reasons for this may be based on the fact that even oxidation of the small amount of GSH to GSSG occurring during work-up of the samples may cause significant shifts of the GSH/GSSG ratio [Citation45]. This limitation obviously also applies to the studies published by others as documented by large variations of the values for the GSH/GSSG ratio that are mainly based on a large range of GSSG values among different tissues and studies (varying between 0.64 and 69.2 µMin ). The values for reduced GSH were much more reproducible and only showed a roughly 2-fold variation (). In contrast, the values for the GSH/GSSG ratio showed even large variations of more than 60-fold when comparing the results of two independent studies (). Our determined values for the GSH/GSSG ratio were magnitudes lower than those reported by other studies using different methods [Citation58–62] and still 2- to 10-fold lower than GSH/GSSG values reported by others also using the HPLC/ECD method [Citation30,Citation63] (compare and ). A potential explanation for this short-coming may be that there was appreciable autoxidation of GSH during our sample work-up, although we used a published protocol [Citation30], which may have resulted in a dramatic shift of the GSH/GSSG ratio. It is tempting to speculate whether addition of antioxidants without direct thiol reactivity (e.g. tris(2-carboxyethyl)phosphine) or metal chelators (e.g. diethylenetriamine pentaacetic acid) could have prevented this shift of the GSH/GSSG ratio. Taken together, we cannot make the claim that we measure GSH and GSSG quantitatively but most importantly, the qualitative read-out of our HPLC/ECD data is in accordance with the data of all other assays of the present study as well as the functional data reported previously [Citation26]: AT-II-induced hypertension is associated with a decrease in reduced thiols as well as GSH as well as with a lower GSH/GSSG ratio in different organs and body fluids.
Conclusions
In conclusion, we validated a simple, fast, direct, sensitive and specific HPLC-based electrochemical detection method for the determination of GSH concentrations as well as GSH/GSSG ratios in animal tissues and fluids. This chromatographic method has a number of advantages, including quick sample preparation, as it requires no derivatization step, a very short retention time of GSH and short duration of the analysis. The HPLC/ECD method also yielded the highest concentrations of detected reduced GSH and therefore may reflect the in vivo concentrations of reduced GSH most accurately. In addition, the HPLC/ECD method allowed the determination of GSH/GSSG ratios without the need for pretreatment of the samples by GR. Of note, the GSH/GSSG ratios detected were lower than those reported in the literature, which may indicate that further optimization of the tissue sampling protocol is required. However, also the HPLC assay with optical detection upon derivatization of GSH and other thiols with Ellman’s reagent (DTNB) produced appreciable significance rates in the different tissues and allowed not only the quantification of GSH but also protein-bound thiols, although this assay seemed to be only semi-quantitative using our protocol. The commercial kit assay produced the lowest values of reduced GSH and very low GSH/GSSG ratios, which may be related to the prolonged storage time of the samples.
For the first time, we here provide data on the head-to-head comparison of three different methods for glutathione determination in tissues and biological fluids of control versus hypertensive rats. A major outcome of the present study is that all three assays can at least qualitatively detect changes in the reduced GSH levels or GSH/GSSG ratios and accordingly can reveal differences in the redox environment of control versus hypertensive rats. However, the absolute quantitative data showed large variations among the three different assays.
Acknowledgments
The authors thank Jacek Zielonka (Medical College of Wisconsin, Milwaukee, WI 53226, USA) for helping to establish the electrochemical HPLC method for GSH detection in our laboratory and his helpful comments for improvement of the manuscript. The authors are indebted to Angelica Karpi, Nicole Glas and Jörg Schreiner for expert technical assistance.
Disclosure statement
The authors declare that they have no conflicts of interest.
Additional information
Funding
References
- Griendling KK, FitzGerald GA. Oxidative stress and cardiovascular injury: part I: basic mechanisms and in vivo monitoring of ROS. Circulation. 2003;108(16):1912–1916.
- Griendling KK, FitzGerald GA. Oxidative stress and cardiovascular injury: part II: animal and human studies. Circulation. 2003;108(17):2034–2040.
- Munzel T, Gori T, Bruno RM, et al. Is oxidative stress a therapeutic target in cardiovascular disease? Eur Heart J. 2010;31(22):2741–2748.
- Lin MT, Beal MF. Mitochondrial dysfunction and oxidative stress in neurodegenerative diseases. Nature. 2006;443(7113):787–795.
- Espinosa-Diez C, Miguel V, Mennerich D, et al. Antioxidant responses and cellular adjustments to oxidative stress. Redox Biol. 2015;6:183–197.
- Kaminskyy VO, Zhivotovsky B. Free radicals in cross talk between autophagy and apoptosis. Antioxid Redox Signal. 2014;21(1):86–102.
- Flohe L. The fairytale of the GSSG/GSH redox potential. Biochim Biophys Acta. 2013;1830(5):3139–3142.
- Zitka O, Skalickova S, Gumulec J, et al. Redox status expressed as GSH:GSSG ratio as a marker for oxidative stress in paediatric tumour patients. Oncol Lett. 2012;4(6):1247–1253.
- Diaz-Vivancos P, de Simone A, Kiddle G, et al. Glutathione-linking cell proliferation to oxidative stress. Free Radic Biol Med. 2015;89:1154–1164.
- Akerboom TP, Bilzer M, Sies H. The relationship of biliary glutathione disulfide efflux and intracellular glutathione disulfide content in perfused rat liver. J Biol Chem. 1982;257(8):4248–4252.
- Bayram B, Rimbach G, Frank J, et al. Rapid method for glutathione quantitation using high-performance liquid chromatography with coulometric electrochemical detection. J Agric Food Chem. 2014;62(2):402–408.
- Wu G, Fang YZ, Yang S, et al. Glutathione metabolism and its implications for health. J Nutr. 2004;134(3):489–492.
- Ballatori N, Krance SM, Notenboom S, et al. Glutathione dysregulation and the etiology and progression of human diseases. Biol Chem. 2009;390(3):191–214.
- Forman HJ, Zhang H, Rinna A. Glutathione: overview of its protective roles, measurement, and biosynthesis. Mol Aspects Med. 2009;30(1-2):1–12.
- Suthanthiran M, Anderson ME, Sharma VK, et al. Glutathione regulates activation-dependent DNA synthesis in highly purified normal human T lymphocytes stimulated via the CD2 and CD3 antigens. Proc Natl Acad Sci USA. 1990;87(9):3343–3347.
- Lu SC. Glutathione synthesis. Biochim Biophys Acta. 2013;1830(5):3143–3153.
- Lu SC. Regulation of glutathione synthesis. Mol Aspects Med. 2009;30(1-2):42–59.
- Sha LK, Sha W, Kuchler L, others, et al. Loss of Nrf2 in bone marrow-derived macrophages impairs antigen-driven CD8(+) T cell function by limiting GSH and cys availability. Free Radic Biol Med. 2015;83:77–88.
- Meier JK, Schnetz M, Beck S, et al. Iron-bound lipocalin-2 protects renal cell carcinoma from ferroptosis. Metabolites. 2021;11(5):329.
- Oelze M, Kroller-Schon S, Steven S, others, et al. Glutathione peroxidase-1 deficiency potentiates dysregulatory modifications of endothelial nitric oxide synthase and vascular dysfunction in aging. Hypertension. 2014;63(2):390–396.
- Azarova I, Klyosova E, Polonikov A. The link between type 2 diabetes mellitus and the polymorphisms of glutathione-metabolizing genes suggests a new hypothesis explaining disease initiation and progression. Life (Basel). 2021;11(9):886.
- Kalinovic S, Oelze M, Kroller-Schon S, et al. Comparison of mitochondrial superoxide detection ex vivo/in vivo by mitoSOX HPLC method with classical assays in three different animal models of oxidative stress. Antioxidants (Basel). 2019;8(11):514.
- Kroller-Schon S, Steven S, Kossmann S, others, et al. Molecular mechanisms of the crosstalk between mitochondria and NADPH oxidase through reactive oxygen species-studies in white blood cells and in animal models. Antioxid Redox Signal. 2014;20(2):247–266.
- Oelze M, Daiber A, Brandes RP, others, et al. Nebivolol inhibits superoxide formation by NADPH oxidase and endothelial dysfunction in angiotensin II-treated rats. Hypertension. 2006;48(4):677–684.
- Wenzel P, Knorr M, Kossmann S, others, et al. Lysozyme M-positive monocytes mediate angiotensin II-induced arterial hypertension and vascular dysfunction. Circulation. 2011;124(12):1370–1381.
- Kalinovic S, Stamm P, Oelze M, et al. Detection of extracellular superoxide in isolated human immune cells and in an animal model of arterial hypertension using hydropropidine probe and HPLC analysis. Free Radic Biol Med. 2021;168:214–225.
- Yap LP, Sancheti H, Ybanez MD, et al. Determination of GSH, GSSG, and GSNO using HPLC with electrochemical detection. Methods Enzymol. 2010;473:137–147.
- Myers JM, Antholine WE, Zielonka J, Myers CR. The iron-chelating drug triapine causes pronounced mitochondrial thiol redox stress. Toxicol Lett. 2011;201(2):130–136.
- Vujacic-Mirski K, Bruns K, Kalinovic S, et al. Development of an analytical assay for electrochemical detection and quantification of Protein-Bound 3-Nitrotyrosine in biological samples and comparison with classical, Antibody-Based methods. Antioxidants (Basel) 2020;9(5):388.
- Scott RB, Reddy KS, Husain K, Schlorff EC, et al. Dose response of ethanol on antioxidant defense system of liver, lung, and kidney in rat. Pathophysiology. 2000;7(1):25–32.
- Ren X, Zou L, Zhang X, et al. Redox signaling mediated by thioredoxin and glutathione systems in the central nervous system. Antioxid Redox Signal. 2017;27(13):989–1010.
- Fernandez-Checa JC, Kaplowitz N, Garcia-Ruiz C, et al. GSH transport in mitochondria: defense against TNF-induced oxidative stress and alcohol-induced defect. Am J Physiol. 1997;273(1 Pt 1):G7–17.
- Garcia-Ruiz C, Fernandez-Checa JC. Mitochondrial glutathione: hepatocellular survival-death switch. J Gastroenterol Hepatol. 2006;21 Suppl 3:S3–S6.
- Forman HJ, Fukuto JM, Torres M. Redox signaling: thiol chemistry defines which reactive oxygen and nitrogen species can act as second messengers. Am J Physiol Cell Physiol. 2004;287(2):C246–C256.
- Zhang H, Forman HJ. Glutathione synthesis and its role in redox signaling. Semin Cell Dev Biol. 2012;23(7):722–728.
- Vaziri ND, Wang XQ, Oveisi F, et al. Induction of oxidative stress by glutathione depletion causes severe hypertension in normal rats. Hypertension. 2000;36(1):142–146.
- Koenig JS, Fischer M, Bulant E, et al. Antioxidant status in patients on chronic hemodialysis therapy: impact of parenteral selenium supplementation. Wien Klin Wochenschr. 1997;109(1):13–19.
- Zima T, Spicka I, Stipek S, et al. Antioxidant enzymes and lipid peroxidation in patients with multiple myeloma. Neoplasma. 1996;43(2):69–73.
- Chrissobolis S, Didion SP, Kinzenbaw DA, et al. Glutathione peroxidase-1 plays a major role in protecting against angiotensin II-induced vascular dysfunction. Hypertension. 2008;51(4):872–877.
- Forgione MA, Weiss N, Heydrick S, et al. Cellular glutathione peroxidase deficiency and endothelial dysfunction. Am J Physiol Heart Circ Physiol. 2002;282(4):H1255–H1261.
- Lewis P, Stefanovic N, Pete J, et al. Lack of the antioxidant enzyme glutathione peroxidase-1 accelerates atherosclerosis in diabetic apolipoprotein E-deficient mice. Circulation. 2007;115(16):2178–2187.
- Khan A, Khan MI, Iqbal Z, et al. A new HPLC method for the simultaneous determination of ascorbic acid and aminothiols in human plasma and erythrocytes using electrochemical detection. Talanta. 2011;84(3):789–801.
- Meister A. Glutathione metabolism and its selective modification. J Biol Chem. 1988;263(33):17205–17208.
- Dalle-Donne I, Rossi R, Colombo G, et al. Protein S-glutathionylation: a regulatory device from bacteria to humans. Trends Biochem Sci. 2009;34(2):85–96.
- Santa T. Recent advances in analysis of glutathione in biological samples by high-performance liquid chromatography: a brief overview. Drug Discov Ther. 2013;7(5):172–177.
- Lazzarino G, Amorini AM, Fazzina G, et al. Single-sample preparation for simultaneous cellular redox and energy state determination. Anal Biochem. 2003;322(1):51–59.
- Nakashima K, Umekawa C, Nakatsuji S, et al. High-performance liquid chromatography/chemiluminescence determination of biological thiols with N-[4-(6-dimethylamino-2-benzofuranyl)phenyl]maleimide. Biomed Chromatogr. 1989;3(1):39–42.
- Parmentier C, Leroy P, Wellman M, et al. Determination of cellular thiols and glutathione-related enzyme activities: versatility of high-performance liquid chromatography-spectrofluorimetric detection. J Chromatogr B Biomed Sci Appl. 1998;719(1-2):37–46.
- Wang Y, Liu Y, Ding F, et al. Colorimetric determination of glutathione in human serum and cell lines by exploiting the peroxidase-like activity of CuS-polydopamine-Au composite. Anal Bioanal Chem. 2018;410(20):4805–4813.
- Rahman I, Kode A, Biswas SK. Assay for quantitative determination of glutathione and glutathione disulfide levels using enzymatic recycling method. Nat Protoc. 2006;1(6):3159–3165.
- Giustarini D, Dalle-Donne I, Colombo R, et al. An improved HPLC measurement for GSH and GSSG in human blood. Free Radic Biol Med. 2003;35(11):1365–1372.
- Cereser C, Guichard J, Drai J, et al. Quantitation of reduced and total glutathione at the femtomole level by high-performance liquid chromatography with fluorescence detection: application to red blood cells and cultured fibroblasts. J Chromatogr B Biomed Sci Appl. 2001;752(1):123–132.
- Hiraku Y, Murata M, Kawanishi S. Determination of intracellular glutathione and thiols by high performance liquid chromatography with a gold electrode at the femtomole level: comparison with a spectroscopic assay. Biochim Biophys Acta. 2002;1570(1):47–52.
- Norris RL, Eaglesham GK, Shaw GR, et al. A sensitive and specific assay for glutathione with potential application to glutathione disulphide, using high-performance liquid chromatography-tandem mass spectrometry. J Chromatogr B Biomed Sci Appl. 2001;762(1):17–23.
- Piccoli G, Fiorani M, Biagiarelli B, et al. Simultaneous high-performance capillary electrophoretic determination of reduced and oxidized glutathione in red blood cells in the femtomole range. J Chromatogr A. 1994;676(1):239–246.
- Yao X, Wang Y, Chen G. Simultaneous determination of aminothiols, ascorbic acid and uric acid in biological samples by capillary electrophoresis with electrochemical detection. Biomed Chromatogr. 2007;21(5):520–526.
- Monostori P, Wittmann G, Karg E, et al. Determination of glutathione and glutathione disulfide in biological samples: an in-depth review. J Chromatogr B Analyt Technol Biomed Life Sci. 2009;877(28):3331–3346.
- Tietze F. Enzymic method for quantitative determination of nanogram amounts of total and oxidized glutathione: applications to mammalian blood and other tissues. Anal Biochem. 1969;27(3):502–522.
- Giustarini D, Dalle-Donne I, Milzani A, et al. Low molecular mass thiols, disulfides and protein mixed disulfides in rat tissues: influence of sample manipulation, oxidative stress and ageing. Mech Ageing Dev. 2011;132(4):141–148.
- Mitrea DR, Malkey R, Florian TL, et al. Daily oral administration of chlorogenic acid prevents the experimental carrageenan-induced oxidative stress. J Physiol Pharmacol. 2020;71(1):55–65.
- Olmos Moya PM, Martinez Alfaro M, Kazemi R, et al. Simultaneous electrochemical speciation of oxidized and reduced glutathione. Redox profiling of oxidative stress in biological fluids with a modified carbon electrode. Anal Chem. 2017;89(20):10726–10733.
- Litterio MC, Jaggers G, Sagdicoglu Celep G, et al. Blood pressure-lowering effect of dietary (-)-epicatechin administration in L-NAME-treated rats is associated with restored nitric oxide levels. Free Radic Biol Med. 2012;53(10):1894–1902.
- Park HJ, Mah E, Bruno RS. Validation of high-performance liquid chromatography-boron-doped diamond detection for assessing hepatic glutathione redox status. Anal Biochem. 2010;407(2):151–159.
- Alisik M, Neselioglu S, Erel O. A colorimetric method to measure oxidized, reduced and total glutathione levels in erythrocytes. J Lab Med. 2019;43(5):269–277.
- Irigaray P, Caccamo D, Belpomme D. Oxidative stress in electrohypersensitivity selfreporting patients: results of a prospective in vivo investigation with comprehensive molecular analysis. Int J Mol Med. 2018;42(4):1885–1898.
- Giustarini D, Dalle-Donne I, Milzani A, et al. Detection of glutathione in whole blood after stabilization with N-ethylmaleimide. Anal Biochem. 2011;415(1):81–83.
- Moore T, Le A, Niemi AK, et al. A new LC-MS/MS method for the clinical determination of reduced and oxidized glutathione from whole blood. J Chromatogr B Analyt Technol Biomed Life Sci. 2013;929:51–55.
- Sinha R, Sinha I, Calcagnotto A, et al. Oral supplementation with liposomal glutathione elevates body stores of glutathione and markers of immune function. Eur J Clin Nutr. 2018;72(1):105–111.
- Schmitt B, Vicenzi M, Garrel C, et al. Effects of N-acetylcysteine, oral glutathione (GSH) and a novel sublingual form of GSH on oxidative stress markers: a comparative crossover study. Redox Biol. 2015;6:198–205.
- Vacchi-Suzzi C, Viens L, Harrington JM, et al. Low levels of lead and glutathione markers of redox status in human blood. Environ Geochem Health. 2018;40(4):1175–1185.
- Rybka J, Kupczyk D, Kędziora-Kornatowska K, et al. Glutathione-related antioxidant defense system in elderly patients treated for hypertension. Cardiovasc Toxicol. 2011;11(1):1–9.
- Vasconcelos SM, Goulart MO, Silva MA, et al. Markers of redox imbalance in the blood of hypertensive patients of a community in northeastern Brazil. Arq Bras Cardiol. 2011;97(2):141–147.