Abstract
A noval cellulose acetate/chitosan multimicrospheres (CACM) was prepared by the method of w/o/w emulsion. The concentration of cellulose acetate (CA) and the ratio of CA/chitosan (CS) had influence on the CACM size, and appearance. Ranitidine hydrochloride loading, and releasing efficiency in vitro were investigated. The optimal condition for preparation of the microspheres was CA concentration at 2% and the ratio of CA/CS at 3/1. The microspheres size was 200–350 μm. The appearance of microspheres was spherical, porous, and nonaggregated. The highest loading efficiency was 21%. The ranitidine release from the CACM was 40% during 48 hr in buffers.
Chitosan (CS), a polysaccharide composed of glucosamine, can be derived by deacetylation of chitin that is obtained from crustacean shells, some microorganisms, and fungi such as yeast. CS has been examined extensively in the pharmaceutical industry for its potential in controlled release of drug delivery due to its excellent biocompatibility, biodegradability, bioactivity, and nontoxicity (Lehr et al. Citation1992; LueBen et al. Citation1994). Various sustained release drug carriers have been made from CS such as microparticles (Agnihotri and Aminabhavi Citation2004), tablets (Nunthanid et al. Citation2004), gels (Mi et al. Citation1999), and beads (Guo et al. Citation2004). CS microspheres have been widely investigated for use as controlled release delivery systems for hormones (Berthold, Cremer, and Kreuter Citation1996), vitamins (Shi and Tan Citation2002), proteins (Remuñán-López et al. Citation1998), and enzymes (Chen and Chen Citation1998).
However, a common restriction is CS' limited capacity for controlling release of the encapsulated compound and the necessity of a further covalent cross-linking process to avoid its rapid dissolution in the gastric cavity. This is because the free amino groups in the CS molecule can be ionized in acidic media to lead to the rapid dissolution of the polymer. Although chemical cross-linking with aldehydes has been used to overcome this problem (Jameela and Jayakrishnan Citation1995; Blanco et al. Citation2000; Genta et al. Citation1998), the toxicity of the aldehydes significantly limit the exploitation of these cross-linked microcapsules (Shu and Zhu Citation2001).
To deal with this problem, cellulose acetate (CA) was selected as a hydrophobic coating to entrap the hydrophilic CS microcores. CA, made from a renewable resource of processed wood pulp, is widely used in oral pharmaceutical products and is regarded as a nontoxic, nonirritant, and biodegradable material.
CA also is widely used in pharmaceutical formulations in both sustained release applications and taste masking. CA is used as a semipermeable coating on tablets, especially on osmotic pump-type tablets and implants that allow for controlled, extended release of actives (Santus and Baker Citation1995; Makhija and Vavia Citation2003). CA films, in conjunction with other materials, also offer sustained release without the necessity of drilling a hole in the coating as is typical with osmotic pump systems. CA films also have been used in transdermal drug delivery studies (Rao and Diwan Citation1997). Thus, CA as a coating material of microspheres needs to be described.
In this article, we report on a new microsphere (CACM) with CA coating and CS core prepared by the methods of w/o/w and emulsification solvent evaporation. The effects of CA on sustained release were studied while the preparation conditions of CS core were fixed. Ranitidine hydrochloride, a competitive, reversible inhibitor of the action of histamine on the histamine H2-receptors, was selected as model drug to evaluate the potential of the loaded microspheres as an oral delivery system.
MATERIALS AND METHODS
CS, molecular weights 1130KD; deacetylation grade 91%, was prepared in our laboratory. CA (supplier's specification: viscosity 300–500 Pas, acetyl content 55%), glycerin monostearate, methylene chloride, ethanol, and acetic acid glacial were all chemical reagents provided by Sigma (St. Louis, MO, USA). Ranitidine hydrochloride was kindly donated by the Xinhua Pharmaceutical Factory (Shijiazhuang, China).
Preparation of Microspheres
CS (0.4 g) was dissolved in 20 ml acetic acid aqueous solution (2%, v/v) at 25°C. Tween-80 (1%, v/v) and ranitidine hydrochloride (w/w, ranitidine hydrochloride/CS+CA = 1/4) were added into CS solution with stirring to dissolve completely. CA (0.4, 0.8, 1.2, and 2 g, respectively) and glycerin monostearate (w/w, glycerin monostearate/CA = 2/10) were dissolved in 40 ml mixture of methylene chloride and ethanol (v/v = 3/1). The CS solution was poured dropwise into the cellulose solution with continuous stirring at 2000 rpm for 10 min to form the primary w/o emulsified solution. Then the emulsified solution was added into 180 ml of sodium polyphosphate solution (3%, w/v) under moderate stirring for 30 min to allow evaporation of the solvent. Finally, the microspheres were filtered and dried at 25°C, and the product was the cellulose acetate/chitosan multimicrospheres (CACM).
Size Determination and Morphological Characterization of Microspheres
The size and the surface properties of the CACM were performed by a scanning electron microscopy (JSM-840 scanning microscope, JEOL). Prior to observation, samples were coated with gold under vacuum. The size distribution of the microspheres was analyzed using standard sieves.
FT/IR Spectrometry
The infrared spectrums of ranitidine hydrochloride, CS, CA, glycerin monostearate, blank microspheres, and drug-loaded microspheres were recorded on an FT/IR-430 Fourier Transform Infrared Spectrometer (Jasco Co., Tokyo, Japan) at room temperature based on the method of Shigemasa et al. (Citation1996). A pellet was formed from 2 mg sample and 100 mg of KBr.
Determination of Drug Loading Efficiency
The CACM (50 mg) were triturated and put into 100 ml of distilled water. The suspension of microspheres was stirred continuously at 160 rpm in a vibrating incubator at 37 ± 0.5°C (HZQ-F160 All-temperature vibrating incubator/Harbin Donglian Electronic & Technology Development, China) to extract the entrapped ranitidine. Then the suspension was filtered and the filtrate was collected to measure the content of ranitidine hydrochloride by ultraviolet spectroscopy (Tu-1800 UV-vis spectrophotometer, Beijing Purkinje General Instrument, China) at 314 nm. The standard curves of ranitidine hydrochloride were achieved in distilled water.
The efficiency of drug loading was calculated from the following equation:
Where A was the total amount of drug and B was the amount of drug loaded in the microspheres.
Evaluation of In Vitro Drug Release
The CACM, 100 mg, were placed in 100 ml PBS solutions contained in Erlenmeyer flasks (250 ml). The Erlenmeyer flasks were closed with plastic membrane. The solutions were stirred continuously at 160 rpm in a vibrating incubator at 37 ± 0.5°C. Triplicate samples were run.
At predetermined time intervals, samples of 4 ml were taken from solution and replaced by an equal volume of buffer to maintain a constant volume. The samples were assayed by spectrophotometry at 314 nm. And the results were compared to evaluate the releasing efficiency of ranitidine hydrochloride. The standard curves of ranitidine chloride were achieved in phosphate-buffer saline (0.2M PBS, pH6.8 and pH7.4) and phosphate-citric acid buffer (pH3.8), respectively.
RESULTS AND DISCUSSION
Characteristics of the Microspheres
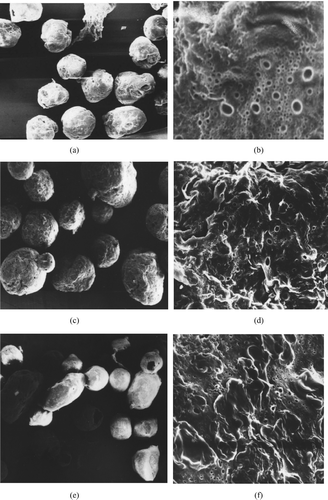
The CACM prepared by the w/o/w method were spherical, free-flowing, and nonaggregated with a size interval of 200–350 μm. The microspheres were affected by the CA concentration and the ratio of coating material (CA) and core material (CS), respectively, which are shown in . shows the micrographs of CACM of CA at 1% concentration; shows that at 2% concentration.
FIG. 1 Scanning electron micrograph of CACM (a,c,e × 20, b,d,f × 1400). (a) (b): CA 1% (w/v), CA/CS = 2/1 (w/w); (c) (d): CA 2% (w/v), CA/CS = 2/1 (w/w); (e) (f): CA 2% (w/v), CA/CS = 5/1 (w/w).

The microspheres made from CA of concentration (1%) had a smaller size than that made from higher concentration (2%). While the CA concentration was increased from 1% to 5%, the microsphere size became bigger and bigger. These results could be explained by the increasing viscosity of CA solution and the increasing amount of coating material. With increasing the CA concentration, the diffusion of CS solution became more difficult and increased the mean droplet size. The appearance of microspheres became more corrugated and the structure became more compact with increasing CA concentration (seen in and ). However, the highest CA concentration to make the microspheres in this description was 5%. Higher concentrations were not practical, because they could not form a homogeneous emulsified solution at higher concentration, which would have led to the formation of agglomerates. The optimal concentration of CA to make CACM was 2%, and it was selected for the following study.
Different ratios (1/1, 2/1, 3/1, 5/1, 10/1, v/v, respectively) of coating material (CA) and core material (CS) at 2% concentration were selected to make CACM. The micrographs of the microspheres made from the CA/CS ratio of 2/1 and 5/1 are shown in and , respectively. The CACM made from higher CA/CS ratio (5/1) had smaller size and more irregular appearance () than that made from lower CA/CS ratio such as 2/1 (). With the ratio of CA/CS increasing from 1/1 to 3/1, the size of the microspheres was decreased and had almost the same size from 3/1 to 5/1; however, the microsphere size increased when the CA/CS ratio increased from 5/1 to 10/1. The reason might be that the coating material and core material could be emulsified completely in optimal ratio of CA/CS (3/1 to 5/1).
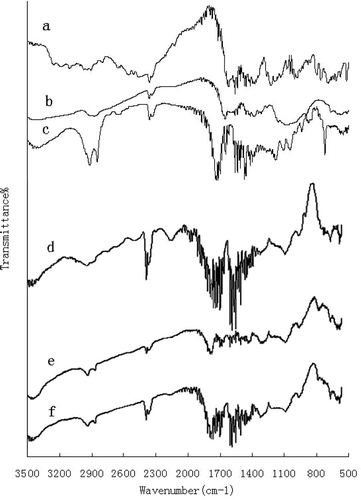
The infrared spectra of CACM and materials are shown in . The characteristics of ranitidine hydrochloride () were 2400 cm−1 (C═NH) and 1610 cm−1 (C─N) (Agatonovic-Kustrin et al. Citation2001). The basic characteristics of chitosan () were at 2867 cm−1 (C─H stretch), 1598 cm−1 (N─H bend), 1154 cm−1 (bridge-O-stretch), and 1094 cm−1 (C─O stretch) (Brugnerotto et al. Citation2001). The characteristics of CA are shown in . The characteristic broad band around 1034 cm−1 for the ─C─O─C─ and the band corresponding to C═O of the acetate appears around 1723 cm−1 (Al-Ahmed, Mohammad, and Rahman Citation2004). The characteristics of CACM with ranitidine hydrochloride (e) and blank CACM (f) also are presented in .
Loading Efficiency
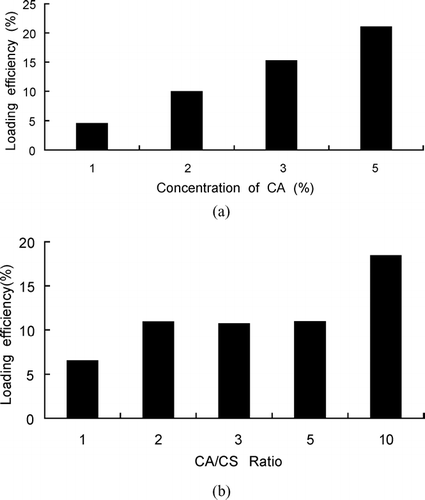
The CACM made from higher concentration of CA solution () or higher ratio of CA/CS () had higher loading efficiency of ranitidine hydrochloride, and with increasing CA concentration or the ratio of CA/CS, the loading efficiency became higher. This could be explained by the amount of coating material that increased with increasing CA concentration or the ratio of CA/CS. The increased amount of coating material may decrease the diffusion of internal drug in core material and then increase the loading efficiency.
In Vitro Release
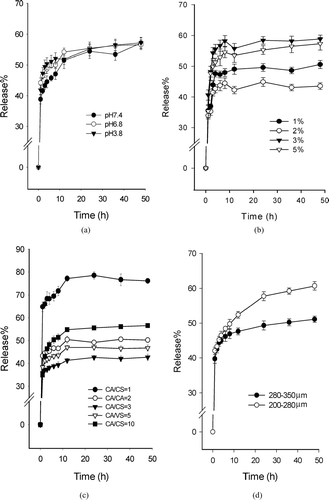
The ranitidine hydrochloride release profiles from CACM in PBS solutions with different pH value were shown in . The results showed no significant differences in the release profile among pH3.8, pH6.8, and pH7.4. This result could be explained by the CA coating which had no remarkable difference in dissolution characteristics in different pH values (Schultz and Kleinebudde et al. Citation1997; Makhija et al. Citation2003).
FIG. 4 Release profiles of ranitidine hydrochloride (data shown are mean ±S.D., N = 3). (a) Mean percent drug release from CACM (CA, 2%, w/v; CA/CS = 3/1) in different pH values; (b) Mean percent drug release from CACM related to CA concentration (CA/CS = 2/1, pH 6.8); (c) Mean percent drug release from CACM made from different ratio of CA/CS (CA, 2%; pH6.8); (d) Mean percent drug release from CACM of different size (CA, 2%; CA/CS = 5/1; pH3.8).

From the release profile, we can see that the release of ranitidine from CACM was characterized by a rapid release phase, which is related to the drug entrapped near the surface of the microspheres, followed by a slow release phase. The drug release was affected by the CA concentrations, and the release profile in pH6.8 PBS is shown in . The CACM made from 2% CA had a slowest release rate of ranitidine and the CACM made from lower (1%) or higher concentration (3% and 5%) of CA had relatively higher release rate. The microspheres prepared with 2% CA concentration released only 40% of ranitidine during 48 hr and the microspheres prepared with 3% CA concentration released 60% in the meantime. The results showed that an optimum concentration of CA was at 2% for the controlled release of ranitidine from CACM.
The release profile of the CACM prepared from different ratios of CA/CS was shown in . The release rate decreased with increasing the ratio of CA/CS from 1/1 to 3/1. However, with increasing the CA/CS ratio from 3/1 to 10/1, the release rate increased a bit. The microspheres prepared with the ratio of CA/CS of 3/1 released only 40% of ranitidine during 48 hr; the microspheres prepared with the CA/CS ratio of 1/1 released 80%, and the microspheres made from the ratio of 10/1 released nearly 60% in the meantime. Thus, the microspheres made from the CA/CS ratio of 3/1 had the slowest in vitro release rate. These results could be influenced by the amount of coating material. When the coating material was equivalent to the core material, it could better retard the diffusion of the drug through the gel into the solvent. So, the optimal ratio of CA/CS was at 3/1 for the controlled release of ranitidine hydrochloride from CACM. This work was in agreement with Dong et al. (Citation1999) who reported that increasing the ratio of coating and core leads to excellent coating film properties, and it became incompact when the ratio became large enough.
The influence of different microspheres size on drug release in vitro was shown in . We could see that the release rate of larger size (280–350 μm) was slower than that of smaller size (200–280 μm). The release rate of smaller size of the microspheres was nearly 60% of ranitidine and that of larger size of the microspheres was only 50%. Drug release is faster from microspheres of smaller size owing to the decreased diffusional path length and the increased surface area of contact with the dissolution medium. Jameela et al. (Citation1998) reported that for progesterone-loaded CS microspheres, the release rate of drug was a function of the microsphere size.
CONCLUSION
CA, CS, and ranitidine hydrochloride could be made into microspheres by the methods of w/o/w emulsification and solvent evaporation. The microspheres were spherical, free-flowing, and nonaggregated. The size of the CACM was 200–350 μm. With increasing CA concentration, the microspheres size increased. However, with increasing the ratio of CA/CS, the size of CACM decreased. The loading efficiency of ranitidine increased with increasing CA concentration and the ratio of CA/CS in the process of CACM preparation. The optimal conditions to make the CACM was CA at 2% concentration, the ratio of CA/CS at 3/1, and the in vitro release rate of ranitidine was 40%.
The authors are indebted to financial support from the National Natural Science Foundation of China (no. 30370344) and the Scientist Encouragement Foundation of Shandong Province (2004BS7001).
REFERENCES
- Agatonovic-Kustrin S., Rades T., Wu V., Saville D., Tucker I. G. Determination of polymorphic forms of ranitidine–HCl by DRIFTS and XRPD. J. Pharmaceut. Biomed. 2001; 25: 741–750, [CSA]
- Agnihotri S. A., Aminabhavi T. M. Controlled release of clozapine through chitosan microparticles prepared by a novel method. J. Control. Rel 2004; 96: 245–259, [CSA], [CROSSREF]
- Al-Ahmed A., Mohammad F., Rahman M. Z. A. Composites of polyaniline and cellulose acetate: preparation, characterization, thermo-oxidative degradation and stability in terms of DC electrical conductivity retention. Synthetic Met 2004; 144: 29–49, [CSA], [CROSSREF]
- Berthold A., Cremer K., Kreuter J. Preparation and characterization of chitosan microspheres as drug carrier for prednisolone sodium phosphate as model for anti-inflammatory drugs. J. Control. Rel. 1996; 39: 17–25, [CSA], [CROSSREF]
- Blanco M. D., Gómez C., Olmo R., Muñiz E., Teijón J. M. Chitosan microspheres in PLG films as devices for cytarabine release. Int. J. Pharm 2000; 202: 29–39, [INFOTRIEVE], [CSA], [CROSSREF]
- Brugnerotto J., Lizardi J., Goycoolea F. M., Argüelles-Monal W., Desbrières J., Rinaudo M. An infrared investigation in relation with chitin and chitosan characterization. Polymer. 2001; 42: 3569–3580, [CSA], [CROSSREF]
- Chen J. P., Chen J. Y. Preparation and characterization of immobilized phospholipase A2 on chitosan beads for lowering serum cholesterol concentration. J. Mol. Catal. B: Enzym. 1998; 5: 483–490, [CSA], [CROSSREF]
- Dong A. J., An Y. L., Feng S. Y., Sun D. X. Preparation and morphology studies of core-shell type waterborne polyacrylate-polyurethane microspheres. J. Colloid Interf. Sci 1999; 214: 118–122, [CSA], [CROSSREF]
- Genta I., Costantini M., Asti A., Conti B., Montanari L. Influence of glutaraldehyde on drug release and mucoadhesive properties of chitosan microspheres. Carbohyd. Polym 1998; 36: 81–88, [CSA], [CROSSREF]
- Guo T. Y., Xia Y. Q., Hao G. J., Song M. D., Zhang B. H. Adsorptive separation of hemoglobin by molecularly imprinted chitosan beads. Biomaterials 2004; 25: 5905–5912, [INFOTRIEVE], [CSA], [CROSSREF]
- Jameela S. R., Jayakrishnan A. Glutaraldehyde cross-linked chitosan microspheres as a long acting biodegradable drug delivery vehicle: studies on the in vitro releases of mitoxantrone and in vivo degradation of microspheres in rat muscle. Biomaterials 1995; 16: 769–775, [INFOTRIEVE], [CSA], [CROSSREF]
- Jameela S. R., Kumary T. V., Lal A V., Jayakrishnan A. Progesterone-loaded chitosan microspheres: a long acting biodegradable controlled delivery system. J. Control. Rel. 1998; 52: 17–24, [CSA], [CROSSREF]
- Lehr C. M., Bouwstra J. A., Schacht E. H., Junginger H. E. In vitro evaluation of mucoadhesive properties of chitosan and some other natural polymers. Int. J. Pharm 1992; 78: 43–48, [CSA], [CROSSREF]
- LueBen H. L., Lehr C. M., Rentel C. O., et al. Bioadhesive polymers for the peroral delivery of peptide drugs. J. Control. Rel 1994; 29: 329–338, [CSA], [CROSSREF]
- Makhija S. N., Vavia P. R. Controlled porosity osmotic pump-based controlled release systems of pseudoephedrine I. Cellulose acetate as a semipermeable membrane. J. Control. Rel 2003; 89: 5–18, [CSA], [CROSSREF]
- Mi F. L., Shyu S. S., Chen C. T., Schoung J. Y. Porous chitosan microsphere for controlling the antigen release of Newcastle disease vaccine: preparation of antigen-absorbed microspheres and in vitro release. Biomaterials 1999; 20(17)1603–1612, [INFOTRIEVE], [CSA], [CROSSREF]
- Nunthanid J., Laungtana-anan M., Sriamornsak P., et al. Characterization of chitosan acetate as a binder for sustained release tablets. J. Control. Rel 2004; 99: 15–26, [CSA], [CROSSREF]
- Rao P R., Diwan P V. Permeability studies of cellulose acetate free films for transdermal use: influences of plasticizers. Pharm Acta Helv 1997; 72: 47–51, [INFOTRIEVE], [CSA], [CROSSREF]
- Remuñán-López C., Lorenzo-Lamosa M. L., Vila-Jato J. L., Alonso M. J. Development of new chitosan-cellulose multicore microparticles for controlled drug delivery. Eur. J. Pharm. Biopharm 1998; 45: 49–56, [CSA], [CROSSREF]
- Santus G., Baker R. W. Osmotic drug delivery: a review of the patent literature. J. Control. Rel 1995; 35: 1–21, [CSA], [CROSSREF]
- Schultz P., Kleinebudde P. A new multiparticulate delayed release system. Part I: dissolution properties and release mechanism. J. Control. Rel 1997; 47: 181–189, [CSA], [CROSSREF]
- Shi X. Y., Tan T. W. Preparation of chitosan/ethylcellulose complex microcapsule and its application in controlled release of Vitamin D2. Biomaterials 2002; 23: 4469–4473, [INFOTRIEVE], [CSA], [CROSSREF]
- Shigemasa Y., Matsuura H., Sashiwa H., Saimoto H. Evaluation of different absorbance ratios from infrared spectroscopy for analyzing the degree of deacetylation in chitin. Int. J. Biol. Macromol 1996; 18: 237–242, [INFOTRIEVE], [CSA], [CROSSREF]
- Shu X. Z., Zhu K. J. Chitosan/gelatin microspheres prepared by modified emulsification and ionotropic gelation. J. Microencapsul 2001; 18(2)237–245, [INFOTRIEVE], [CSA], [CROSSREF]

