
Abstract
Objectives: This work aimed at investigating the potential of solid lipid nanoparticles (SLN) as carriers for topical delivery of Ketoprofen (KP); evaluating a novel technique incorporating Artificial Neural Network (ANN) and clustered bootstrap for optimization of KP-loaded SLN (KP-SLN); and demonstrating a longitudinal dose response (LDR) modeling-based approach to compare the activity of topical non-steroidal anti-inflammatory drug formulations.
Methods: KP-SLN was fabricated by a modified emulsion/solvent evaporation method. Box–Behnken design was implemented to study the influence of glycerylpalmitostearate-to-KP ratio, Tween 80, and lecithin concentrations on particle size, entrapment efficiency, and amount of drug permeated through rat skin in 24 hours. Following clustered bootstrap ANN optimization, the optimized KP-SLN was incorporated into an aqueous gel and evaluated for rheology, in vitro release, permeability, skin irritation and in vivo activity using carrageenan-induced rat paw edema model and LDR mathematical model to analyze the time course of anti-inflammatory effect at various application durations.
Results: Lipid-to-drug ratio of 7.85 [bootstrap 95%CI: 7.63–8.51], Tween 80 of 1.27% [bootstrap 95%CI: 0.601–2.40%], and Lecithin of 0.263% [bootstrap 95%CI: 0.263–0.328%] were predicted to produce optimal characteristics. Compared with profenid® gel, the optimized KP-SLN gel exhibited slower release, faster permeability, better texture properties, greater efficacy, and similar potency.
Conclusions: SLNs are safe and effective permeation enhancers. ANN coupled with clustered bootstrap is a useful method for finding optimal solutions and estimating uncertainty associated with them. LDR models allow mechanistic understanding of comparative in vivo performances of different topical formulations, and help design efficient dermatological bioequivalence assessment methods.
Introduction
Ketoprofen (KP), a BCS class II drug (poor solubility and high permeability), is a potent non-steroidal anti-inflammatory drug (NSAID) used for alleviating symptoms of rheumatoid arthritis, the most common cause of functional disability with no curative treatment to date (Abramson & Yazici, Citation2006). Owing to its short biological half-life (2–4 hours), large doses of the KP need to be frequently administered through the oral route. Therefore, rheumatoid arthritis patients on KP oral dosage forms for extended periods of time are at risk of developing ulcers, renal failure or liver dysfunction (Singh et al., Citation1994). A smart way to get around the toxic effects of KP is to deliver it through the skin. Unfortunately, this is not an easy way to adopt because of the barrier properties of the stratum corneum.
Being small in size and able to control the release of drug molecules, solid lipid nanoparticles (SLN) have received great attention as potential carriers for topical dermatological delivery (Utreja & Jain, Citation2001). Since it consists of high melting point lipids in the core and nontoxic surfactants in the coat layer, it is capable of housing both lipophilic and hydrophilic drugs (Utreja & Jain, Citation2001). Because of the colloidal nature of the SLN, secondary vehicles (e.g. gels, creams or ointments) must be used to increase its viscosity for dermal administration, facilitate its application, and extend its residence time on the skin (Khurana & Bedi, Citation2013).
Artificial neural network (ANN) is a flexible tool that mimics human brain through passing and processing signals across layers of neurons interconnected by synapses (Sun et al., Citation2003). Hence, ANN is well-suited for approximating complex, non-linear relationships between multiple causal and response variables. Combined with factorial designs that allow investigating several formulation factors simultaneously in a limited number of experiments (Cochran, Citation1992), ANN has been successfully utilized to develop several novel formulations (Hussain et al., Citation1991; Takahara et al., Citation1997; Takayama et al., 1999).
When it comes to optimization based on non-linear models, assessing reliability of optimal solutions is important. Although substantial number of studies use ANN for optimization of drug delivery systems, few of them try to evaluate the robustness of their non-linear optimization. The term “robustness” here describes the ability of the model to replicate the optimal solution, irrespective of prior assumptions. Resampling techniques, such as bootstrapping, can test the robustness of optimization results (Arai et al., Citation2007; Onuki et al., Citation2008; Duangjit et al., Citation2014). The basic idea of bootstrap is random sampling of the original dataset with replacement to generate arbitrary number of subsets belonging to the empirical distribution of the original data. Bootstrap resampling offers a non-parametric technique to estimate confidence intervals, bias, and variance of a given estimator. Profound statistical theory behind bootstrap can be found elsewhere (Efron & Tibshirani, Citation1994).
To assess bioavailability and bioequivalence, The United States (US) Food and Drug Administration (FDA) has relied on in vitro and in vivo methods with in vivo pharmacodynamic effect studies being the most preferred (Title 21 Code of Federal Regulations (CFR) 320.24). For topical corticosteroids, the FDA guidelines released in 1995 recommend multiple dose duration studies that are based on vasoconstrictor assay (http://www.fda.gov/cder/guidance/dd098fn.pdf). The guidelines also suggest measurements over multiple time points and maximum effect (Emax) model to describe the area under effect curve versus dose duration data. To our knowledge, this approach has never been applied to assess the anti-inflammatory response to NSAID topical formulations.
A large number of studies have reported on novel KP topical formulations (more than 50 papers since 1990 on MEDLINE/PubMed using the keywords: Ketoprofen-Formulation-Topical). However, as far as we know, one group attempted to investigate the potentials of SLN as a carrier for topical delivery of KP (Kheradmandnia et al., Citation2010). Therefore, our primary objective was to develop, optimize, and characterize KP-SLN gel for topical delivery. Secondary objectives were to evaluate a clustered bootstrap-ANN methodology for optimization of the SLN loaded with KP; and demonstrate a pharmacodynamic model-based approach to compare anti-inflammatory activity of topical NSAID formulations.
Materials and methods
Materials
Ketoprofen was purchased from Sigma Company (Cairo, Egypt). Glycerylpalmitostearate (Precirol ATO 5) was kindly donated by Gattefossé, France. l-α Phosphatidylcholine (Soybean lecithin) and dialysis bags with molecular weight cut off of 12 000 Da were purchased from Sigma-Aldrich (St. Louis, MO). Carbopol 974 NF, Tween 80, Carrageenan, Disodium hydrogen orthophosphate and Potassium dihydrogen orthophosphate were purchased from El-Nasr Pharmaceutical Chemical Company, Cairo, Egypt. Other chemicals and reagents used were of analytical grade.
Experimental design
Based on a preliminary study, glycerylpalmitostearate (GPS) was selected as the lipid, Tween 80 as the surfactant, and soybean lecithin as the phospholipid for preparing the SLN loaded with KP. The influence of lipid-to-drug ratio (X1), concentration of Tween 80 (X2), and concentration of lecithin (X3) on particle size (Y1), entrapment efficiency (Y2), and cumulative amount of drug permeated through the excised rat skin in 24 hours (Y3) was studied using a Box–Behnken design with four center points (). All experiments were performed in triplicates.
Table 1. Layout of the causal factors levels, and augmented Box–Behnken design for studying KP-SLN.
Preparation of the SLN
The KP-SLN were prepared according to a modified emulsion/solvent evaporation method (Cavalli et al., Citation1996). Briefly, KP, GPS, and soybean lecithin are added to 10 ml methylene chloride forming the oil phase. The aqueous phase was 25 ml surfactant solution in distilled water. Both phases were heated to 60 °C. The organic phase was dropped onto the hot aqueous phase at a constant rate under homogenization and sonication. Homogenization was carried out at 13 500 rpm by Ultra Turrax® T 25 basic homogenizer (IKA, Staufen, Germany) for 10 min. The resulting colloidal dispersion was poured into 25 ml cold distilled water under stirring at 1000 rpm for 2 h at 2 °C in an ice bath to allow for the hardening of the SLN. This nanoemulsion was centrifuged using a cooling centrifuge (SIGMA 3-30K, Steinheim Germany) at 14 000 rpm for 5 h at 4 °C. The precipitate was washed twice with distilled water, freeze-dried and kept at 4 °C for further characterization.
Determination of KP entrapment efficiency
The amount of entrapped KP was determined by lysis of the separated precipitate (20 mg) in 50 ml of methylenechloride, centrifugation of the solution at 4000 rpm for 30 minutes and then analyzing the drug content spectrophotometrically at 259 nm after suitable dilution. The % entrapment of KP was determined using the following formula:
(1)
Particle size and size distribution measurements
Dynamic light scattering was used to assess the mean particle size and size distribution of KP-SLN using a Malvern Nanosizer ZS (Zetasizer Nano ZS, Malvern Instruments, Malvern, UK) (Guinedi et al., Citation2005). The samples were diluted with distilled water before measurement.
Ex vivo skin permeation of KP released from the KP-SLN
Ex vivo permeation was determined by Franz diffusion (surface area 5 cm2). Excised rat abdominal skin (thickness 1.2 ± 0.2 mm) was used as the diffusion membrane. Equal volumes (2 mL) of KP–SLN dispersions equivalent to 5 mg KP was applied on the epidermal surface of the skin, which was stretched over the lower open end of the tube with the subcutaneous side facing upwards and the dermal side facing downwards into the receptor compartment (Attia, Citation2009). The dissolution medium used was phosphate buffer saline (PBS) pH 7.4. The saturated solubility of KP in the dissolution medium was 0.07% w/v. Therefore, to ensure sink conditions, 100 ml of the medium was used. To reach the physiological skin temperature (i.e. 32 ± 1 °C), the thermostating bath temperature was set at 37 ± 1 °C throughout the experiments under continuous stirring with magnetic bar at 100 rpm (Montenegro et al., Citation2012). At predetermined time intervals (1, 2, 3, 4, 5, 6, 8, 10,12 and 24 h), 1 ml was withdrawn from the receptor compartment and was compensated with equal volume of fresh medium to maintain sink condition. The withdrawn samples were filtered through 0.45 μm pore filter and finally measured at 259 nm using a spectrophotometer.
ANN modeling
ANN was built in R version 2.15 using the package “neuralnet” (Günther & Fritsch, Citation2010). The package adopts feed-forward multilayer perceptron (MLP) to approximate functional relationship between causal and response variables. The underlying structure of MLP is units (neurons) organized in an input layer (representing causal factors), hidden layer(s), and an output layer (representing response variables). The units in the neighboring layers are fully interconnected through synapses. Data passes the neural network as signals traveling through synapses. The strength of a signal is represented by a weight attached to each of the synapses. The signals are processed in the neurons and all incoming signals are added and activation function is applied to the resulting sum. MLP with one hidden layer computes the following function:
(2)
where y denotes the response variable, W is the weight vector, X is the causal factors vector, and O is the activation function. In this analysis, the activation function was set to inverse logit function:
(3)
The ANN is trained using measured responses. During the training process, the weights are adjusted by a learning algorithm that minimizes the differences between measured responses and the output calculated by the neural network (error function). In this analysis, the learning algorithm was set to resilient back-propagation with weight back tracking to minimize sums of squared error function.
In this work, a single hidden layer was used. To avoid over- or under-fitting, leave-one-out cross validation (LOOCV) technique (Ueda & Nakano, Citation1995) was used to determine the number of units in the hidden layer. In this technique, the dataset was split n times to sets of n − 1 observations for calibration and one observation for validation. For each calibration set, the ANN model was refitted then the updated model was used to predict the observation in the validation set and Pearson's correlation coefficient (r) of observed and predicted response was calculated. The number of hidden units maximizing the sum of r values of all responses was chosen.
Multi-objective simultaneous optimization
Given more than one response variable to optimize simultaneously, the variables were incorporated into a single function that is based on standardized Euclidean distance (Takayama & Nagai, Citation1991):
(4)
where FD denotes the optimum value of each response when optimized individually, FO is the predicted value of each response, and SD is the standard deviation of the observed values of each response. The combination of causal factors values that minimizes S under the restriction of the experimental design space was taken as the optimal solution.
Clustered bootstrap resampling
Clustered bootstrapping (CBS) was deployed to estimate the uncertainty associated with the simultaneous optimal solution provided by the ANN model using the original data. The original dataset was randomly sampled with replacement (Efron & Tibshirani, Citation1994) to create 250 replicate datasets each with the same number of experimental units as the original dataset. Subsequently, the ANN model was fitted to the bootstrap datasets. Accordingly, 250 bootstrap optimal solutions were obtained. Cluster analysis via the k-midoid algorithm (Hennig, Citation2014) was used to identify an optimal neighborhood around the original optimal solution. The 2.5th and 97.5th percentiles of the optimal neighborhood were calculated.
Morphological evaluation of KP-SLN dispersion
The optimized KP-SLN formulation was chosen for morphological examination of the SLN. Before determination, the sample was diluted 10 times using distilled water. A drop of the KP-SLN dispersion was applied on a carbon-coated grid. The dispersion was left for 2 min, to allow its absorption on the carbon film, and the excess liquid was drawn off with filter paper. The aqueous solution of phosphotungstic acid was used as a negative stain. Samples were examined by TEM (Jeol, Tokyo, Japan) operating at an accelerating voltage of 80 kV (Manconi et al., Citation2003).
Preparation of KP-SLN-based topical gel (KP-SLN gel)
The optimized KP-SLN formulation was incorporated into a topical gel using Carbopol 974 NF (KP-SLN gel). Weighed quantity of Carbopol 974 NF was dispersed in water (2%w/w). The dispersion was stirred for 2–3 h. KP-SLN (equivalent to 2.5% w/w of KP) was incorporated into the gel base. It was stirred for 1 h, and pH was adjusted to 6.0 ± 0.06, using (1N) sodium hydroxide solution to obtain KP-SLN gel with adequate consistency suitable for topical application (Kumbhar et al., Citation2013; Patel et al., Citation2013).
Rheological properties determination
The viscosities of KP-SLN gel and commercial gel (profenid® gel) were measured by a Brookfield Viscometer (Brookfield DV-III Ultra R/S + RHEOMETER, MA, USA) using spindle CC 52. About 0.5 gm of the tested formulae was applied to the plate and left until the temperature of the cone reached 25 ± 1 °C. The measurement was started at 20 rpm; the speed was gradually increased till reached 200 rpm, the speed was then reduced gradually until reaching the starting rpm. The shear stress versus shear rate measurements were analyzed non-parametrically by calculating the area of hysteresis loops. The linear trapezoidal rule was used to calculate the area under the down and upper curves that were subtracted to get the hysteresis area.
Viscosity (η) versus shear rate (S) data were analyzed using Ostwade’s power equation (Battista, Citation1985):
(5)
where K is a constant, and n is a parameter measuring thixotropic degree. The value of n was calculated as the slope of the linear relationship between log η and log S.
Rheology parameters were compared between the optimized KP-SLN gel and the commercial gel by means of a two-sided Student’s t-test assuming unequal variance with p < 0.05 as the minimal level of significance.
In vitro release study of KP from KP-SLN gel
In vitro release of KP from KP-SLN gel and commercial gel (profenid® gel) was evaluated using vertical diffusion Franz cells with an effective diffusion area of 5 cm2 (Okamoto et al., Citation1988). An amount of KP-SLN gel (2.5% w/w KP) and commercial gel (drug content 2.5% w/w KP) equivalent to 5 mg KP was placed in the donor compartment. The receptor compartment was maintained at 37 ± 1 °C and stirred by a magnetic bar at 100 rpm. The donor compartment was separated from the receptor compartment by cellulose dialyzing membrane with molecular weight cut off of 12 000 Da, which was soaked in the receptor medium overnight. The receptor chamber contained 100 ml PBS (pH 7.4). Samples of 1 ml were withdrawn at definite time intervals (1, 2, 3, 5, 7.5, 10, 12 and 24 h), then the release medium was compensated with equal volumes of fresh medium to ensure sink condition. Samples were filtered through 0.45 μm pore filter and analyzed for drug content by a UV visible spectrophotometer at 259 nm after appropriate dilutions. Kinetics of KP release from the KP-SLN gel and commercial gel was analyzed according to zero-order, first-order, and Higuchi diffusion models.
Ex-vivo permeability of KP released from the KP-SLN gel
Ex vivo permeation of KP across excised rat abdominal skin from a 1 gm of 2.5% w/w KP-SLN gel and profenid® gel was studied using Franz diffusion cell as described above. Cumulative amount of KP permeated through excised rat skin per unit surface area versus time data were analyzed using the following Fick’s diffusion model (Jenning et al., Citation2000):
(6)
(7)
(8)
where Qt is the cumulative amount of KP in the receptor phase at time t, A is the area of application, C0 is the initial concentration in the donor phase, K is the partition coefficient of KP between the membrane and the donor phase, D is the diffusion constant, and L is the thickness of the membrane. The diffusion parameter D′ and partition parameter K′ were estimated using Levenberg-Marquardt non-linear regression (Elzhov & Mullen, Citation2015). The permeability constant (Kp), steady-state flux (Jss), and lag time (Tlag) were calculated as:
(9)
(10)
(11)
Previously calculated parameters such as K′, D′, Kp, Jss, and Tlag were compared between the optimized KP-SLN gel and the commercial gel by means of two-sided Student’s t-test assuming unequal variance with p < 0.05 as the minimal level of significance.
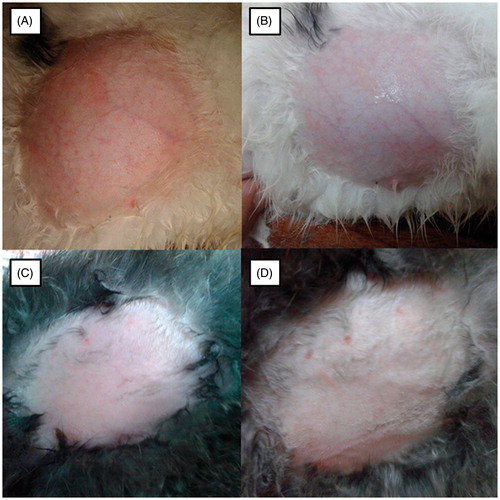
Primary skin irritation study
The skin irritation potential of the KP-SLN gel was evaluated by acute skin irritation test as per OECD Guidelines. This study was approved by the ethical committee of Faculty of Pharmacy, Beni-Suef University. Healthy male rabbits weighing 2–2.5 kg were used for the study (n = 3). Animals were divided into four groups. The groups were categorized into positive control (A) (1% formaldehyde solution), negative control (B) (without any treatment), KP-SLN gel (C), and blank SLN gel (D). An area of rabbits back (0.4 cm2) was shaved carefully, treated with 0.5 g of the test substances individually, and covered with an adhesive tape. The rabbits were then returned to their cages and were examined at 24, 48 and 72 h after the application of formulation. The skin was evaluated and scored for erythema and edema which served as indicators of sample irritation potential (Wavikar & Vavia, Citation2013).
In vivo activity and pharmacodynamics modeling
The study design used for evaluating the anti-inflammatory equivalence of the KP-SLN gel and the commercial formulation (profenid® gel) was based on the 1995 FDA guidelines for assessing bioequivalence of topical dermatological corticosteroids. The protocol was approved by the ethical committee of Faculty of Pharmacy, Beni-Suef University. Carrageenan-induced rat paw edema model (Özgüney et al., Citation2006) was used to evaluate the anti-inflammatory activity. Eighteen female Wistar rats (weight 180–200 g) were assigned to 6 groups of three. Combinations of treatments (test and reference) and dose durations (0.5, 2, and 6 hours) were randomly assigned to the animal groups.
Edema was induced by injecting 1%w/v saline solution of carrageenan in the sub-plantar tissue of the right hind paw of each rat. The paw thickness was measured using a caliber before and 5 hours after the injection to ensure that the edema was induced (Morris, Citation2003). After application of the treatment to the right hind paw it was occluded with 3 M surgical tape and gauge to prevent licking of the gel. The paw thickness was measured before application of the treatment (Baseline), and at 0.5, 1, 2, 6, 16, 20, and 24 h after the baseline measurement. Measurement times in each group varied according to the assigned treatment duration so that the first measurement is obtained at the time of treatment removal, and the last measurement is obtained after 24 h from the baseline measurement. For instance, in the group assigned to the 6 h dose duration, measurement times were at 6, 16, 20, and 24 h from the baseline. Three rats received carrageenan but were not treated with either preparation served as a positive control group.
In each animal group, the percentage change in rat paw thickness from baseline was taken as the response and was calculated as:
(12)
where h0 is thickness at baseline, and ht is thickness measured at time t. The responses were adjusted for treatment-independent recovery in the control group:
(13)
The time course of edema thickness change following application of the KP-SLN gel and commercial gel formulations for different dose durations, were described by the following longitudinal dose response (LDR) model:
(14)
and
(15)
where T50 is the time at which 50% of the maximum change is reached, Smax is the maximum change, and SD50 is the dose producing half-maximal change. The parameters Smax, SD50, and T50 measure the efficacy, potency, and delayed response of the formulation, respectively. The model parameters were estimated using the Levenberg–Marquardt non-linear regression (Elzhov & Mullen, Citation2015).
To estimate the distribution of the model parameters and to test the hypothesis of KP-SLN gel superiority, a one-sided permutation test was performed (Tsai et al., Citation1999). The residuals defined as the deviation between calculated and model-predicted responses, were permuted and added to the predicted values, thus creating a new dataset. This process was repeated 1000 times creating 1000 permuted datasets. For each permutation, the model was fitted to generate 1000 Smax, SD50, and T50 parameter estimates for each treatment. The one-sided p-value for the null hypothesis test that the KP-SLN gel is not superior to the commercial gel, was calculated as the proportion of times the difference between the corresponding parameters of both formulations fell below or above zero. Additionally, the generated parameter estimates were used to establish the 95% confidence intervals on the parameters by defining the 2.5th and 97.5th percentiles.
Results and discussion
ANN modeling
It is well known that topical formulations determine bioavailability and clinical efficacy of NSAIDs through impacting their release and skin penetration (Tsai & Chuang, Citation1999). Therefore, understanding the complex relationship between formulation process parameters and physicochemical/biological responses is imperative for designing effective formulations. Once such relationship has been delineated, identifying the optimal combination of formulation variables becomes feasible.
Response surface methods based on multiple regression analysis and quadratic modeling have been the gold standard for seeking optimized formulations. However, these methods assume pre-specified relationship between covariates and response variables, for instance as linear or second-order polynomial. Additionally, these methods usually produce inaccurate optimal solutions due to its limited application to very low level of covariates (Takayama & Takahara, Citation1999). To avoid these drawbacks, we have used ANN for optimization of KP-SLN and combined it with clustered resampling technique to estimate the uncertainty associated with the ANN optimal solution.
Particle size (PS), entrapment efficiency (EE), and cumulative percentage permeated in 24 h (Q24) values used for training our ANN model are listed in . PS values ranged from 50.4 to 122.5 nm, EE from 48.2 to 90%, and Q24 from 26 to 78%, respectively. The wide variations in these responses among the experiments suggest that they were substantially influenced by changes in the levels of causal factors. Three units in the hidden layer were associated with minimal prediction error based on the LOOCV statistical analysis. The underlying structure of the final ANN model used to describe the relationship between the causal factors (lipid-to-drug ratio, %Tween 80, and %Lecithin) and the response variables (PS, EE, Q24) with the synaptic weight estimates is shown in . The model described the observed data adequately as indicated by the close agreement between measured and model predicted responses ().
Figure 1. Structure of the ANN model for the relationship between causal factors (X1–X3) and response variables (Y1–Y3) of KP-SLN. X1, X2, and X3 denote lipid-to-drug ratio, %Tween 80, and %Lecithin, respectively. Y1, Y2, and Y3 denote PS, EE, and Q24, respectively. H1, H2, and H3 denote hidden layer units. Units 1 and 2 represent the intercepts. The weights are shown on the synapses between units.
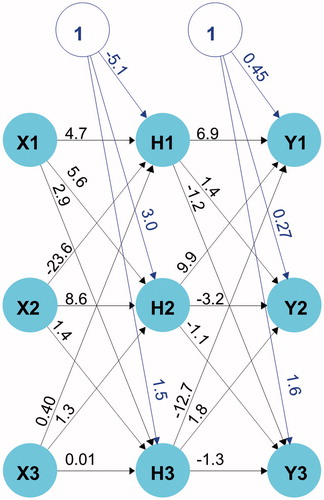
Figure 2. Plot of actual versus ANN model predicted KP-SLN PS (A), EE (B), and Q24 (C). Pearson’s correlation coefficient (r2) is shown.
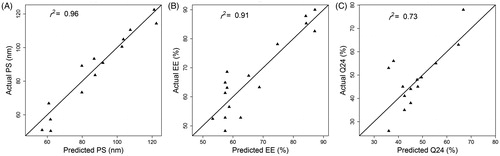
Table 2. Particle size, entrapment efficiency, and amount permeated in 24 h values of KP-SLN formulations. Results are the mean ± SD (n = 3).
Response surface exploration
Response surface plots in show the approximated actual relationships between causal factors and response variables. Each plot exhibits the effect of two causal factors after fixing the third one at the low level value.
Figure 3. Response surface plots for the effect of causal factors (Lipid-to-drug ratio, %Tween 80, and %Lecithin) on KP-SLN PS (nm) (A1–A3), EE (%) (B1–B3), and Q24 (%) (C1–C3).
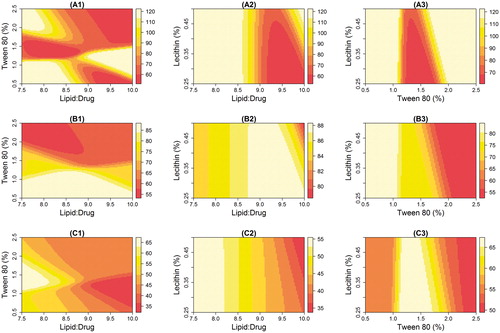
As lecithin concentration was held constant, PS was affected by the interaction between lipid and surfactant levels (). PS less than 60 nm (the dark zone) can be spotted in two regions; the first when the lipid-to-drug ratio is 7.5–8.5 and %Tween 80 is 1.2–1.8%; the second region when the lipid-to-drug ratio is greater than 9 and %Tween is bigger than 1.5. At low lipid levels, moderate concentration of the surfactant is needed to produce a condensed particle. As the level of the lipid increases, the small PS is maintained only if the level of the surfactant is increased correspondingly. This observation was reported elsewhere (Kelidari et al., Citation2015) and was attributed to the ability to effectively reduce the interfacial tension between aqueous and lipid phases, which subsequently would lead to the formation of smaller droplets. Higher surfactant concentration effectively stabilizes the particles by forming a steric barrier on the particle surface, and thereby protect smaller particles and prevent their coalescence into bigger ones (Rahman & Zidan, Citation2010).
show that PS was almost independent of lecithin concentration when surfactant or lipid levels were held constant. Small PS (the dark region) was obtained when lipid-to-drug ratio was between 9 and 10, and Tween% was between 1.2 and 1.8, as long as lecithin level was kept less than 0.35%. It seems logic to conclude that lipid-to-drug ratio and surfactant concentrations are more important than the lecithin concentration in determining the size of the nanoparticles. This conclusion is in agreement with findings of previous studies that reported limited effect of lecithin on PS (Rahman & Zidan, Citation2010).
Entrapment ratios greater than 80% (the white zone) was obtained when lipid-to-drug ratio was more than 9 ()), lecithin less than 0.35% (), and Tween 80 below 1% (). Increasing lipid level but decreasing both the surfactant and phospholipid concentrations seems to increase the EE. This finding is in line with previous reports (Priyanka & Hasan, Citation2012; Kelidari & Saeedi, Citation2015) and can be justified by the fact that higher lipid concentration will provide more space to increase lipid content and reduce the tendency of drug to escape to the external phase.
Best Q24 values (the white zone) were obtained when lipid-to-drug ratio was set to be less than 8.5 ()), and Tween 80 was set to be between 1.2 and 1.8% ()). The influence of causal factors on the permeability ()) seems to inversely correlate with their effect on the PS ()). It has been suggested that nanoparticle size is the most important factor for determining its ability to facilitate drug partitioning across the stratum corneum (Sivaramakrishnan et al., Citation2004).
The effect of lecithin concentration on EE () seems to be modest. This observation was reported elsewhere (Liu et al., Citation2010). Addition of phospholipid can influence drug entrapment in two ways: (1) enhances drug solubility and entrapment through formation of the reverse micelles inside the SLN; and (2) increases the tendency of forming smaller particles which, according to some reports (Cortesi et al., Citation2002), is the main reason for the significant dropdown of EE. Therefore, the limited effect of lecithin on EE may result from dynamic equilibrium between the two effects. Due to its little influence on PS ()), it was not surprising to see a limited influence for lecithin on permeability too ().
Optimization of KP-SLN
The composition of the KP-SLN optimized based on our ANN model is shown in . The corresponding optimal response variables were: PS <60 nm, EE >75% and Q24 > 65% (), suggesting that the SLN formulation presented in is an optimal one indeed.
Table 3. Composition of the ANN model predicted optimal KP-SLN formulation based on the original and 250 bootstrap datasets.
Table 4. Comparison of measured and ANN model predicted responses (PS, EE, and Q24) of the optimal formulation.
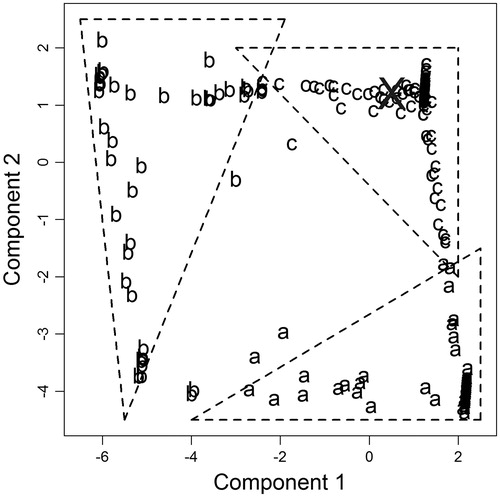
The bootstrap statistics mentioned earlier and shown in were based on a restricted bootstrap technique. In this technique, 250 different optimal solutions were obtained based on 250 datasets resampled from the original data. To avoid the influence of flawed or unrealistic data samples on calculated statistics (e.g. when a single observation is repeated 90% of the times), the bootstrap optimal solutions were clustered using the k-midoid algorithm and the results are shown in . The cluster analysis identified three groups marked as (a), (b), and (c). The optimal solution based on the original dataset clearly belonged to the group (c), indicating that this cluster represents a neighborhood for the optimal solution. Accordingly, statistical limits of the (c) cluster were computed in .
Figure 4. Discriminant plot of bootstrap standardized optimal solutions. The axes are the principal components explaining the maximum variability in formulation factors of bootstrap optimal solutions. Each letter symbol corresponds to a cluster identified using the k-midoid algorithm. The X indicates the position of the original dataset optimal solution.
Model robustness reflects the ability of the model to replicate a certain output irrespective of prior assumptions, while model accuracy indicates its ability to produce a true output. Together, robustness and accuracy determine the reliability of a given mathematical model. The close agreement between the optimal solution based on the original dataset and that is based on clustered bootstrapping (i.e., restricted replication) () suggests that the model is robust. While robustness of our developed ANN model was asserted by bootstrap, we still needed to check the model accuracy. To do so, studies of PS, EE, and Q24 were also undertaken with the optimal formulation suggested by the ANN model (). The responses of the optimal formulation predicted by the ANN model coincided well with the experimentally determined values (), confirming the accuracy of our developed ANN model.
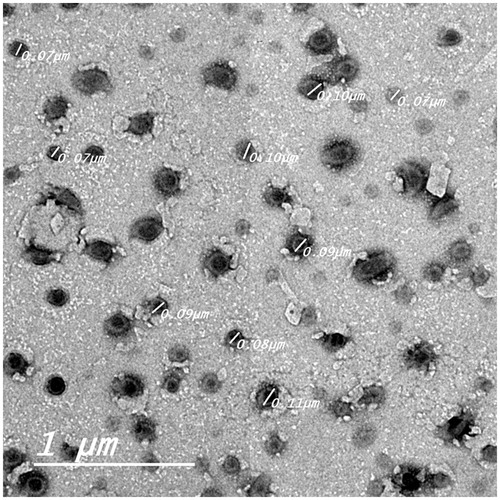
Morphological evaluation of KP-SLN dispersion
The morphology of the SLN-loaded with KP was investigated by TEM. shows that the nanoparticles are almost spherical with smooth morphology, appear as black dots, well dispersed and separated on the surface. This description is in agreement with the finding of a previous study (Mehnert & Mäder, Citation2001) which reported that combining chemically heterogeneous lipid with heterogeneous surfactants favors the formation of ideally spherical lipid nanoparticles. There are three different models supporting drug distribution theory within solid lipid nanoparticles: (1) core-shell model with drug enriched shell; (2) core–shell model with drug-enriched core; and (3) solid–solution model (Muller et al., Citation2000). indicates the presence of a very thin layer surrounding the particles, suggesting drug-enriched core distribution model. Such distribution within the nanoparticles is expected to impact the in vitro drug release profile.
Figure 5. Transmission electron micrograph of the KP-SLN dispersion. The black dots represent KP-SLN, the gray dots and background represents the dispersion medium stained by phosphotungstic acid.
Rheology of the KP-SLN gel
Rheology of a semisolid drug carrier is a very important physical parameter for its percutaneous application (Lippacher et al., Citation2002). In the present study, the rheological properties of the prepared gels were evaluated using a rotational viscometer of cone and plate type. Commercial and KP-SLN gels showed pseudoplastic flow with variable thixotropic behavior ().
Figure 6. The flow curves of the commercial gel and KP-SLN gel. The error bars represent the 95% confidence intervals of 3 experiments.
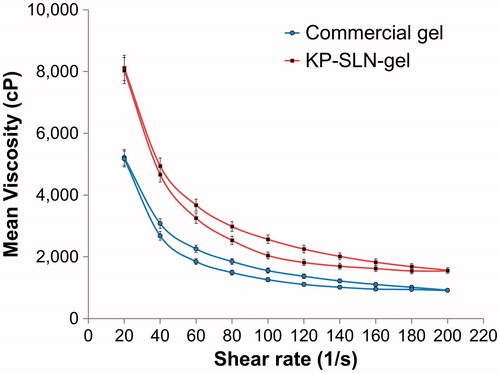
Thixotropy is required for topical application. Thixotropic materials will lose structure and viscosity during shear allowing easy spreading over the skin. The material will slowly rebuild its structure and regain viscosity when shear is removed allowing prolonged residence on the skin. Ostwade’s power parameter and area of hysteresis loop () measure the degree of thixotropy. Although the former parameter was basically the same in both formulations, the area was significantly larger in the KP-SLN gel. The better thixotropy of our developed SLN formulation is probably due to interference of the lipid with hydrogen-bond reformation during gel structure recovery phase. This behavior is believed to slow down the rebuilding of gel three-dimensional network (Liu et al., Citation2008).
Table 5. Rheological parameters of KP-SLN gel and commercial gel. Results are the mean ± SD (n = 3).
In vitro release of KP from KP-SLN gel
The release profiles of KP from solid lipid nanoparticles gel formulation as well as commercial gel are illustrated in . The release rate of KP from SLN was lower than the corresponding commercial one (), suggesting the ability of the SLNs to retard the release of KP. KP release from SLN displayed an initial burst phase for 2 h with 15 ± 0.9% KP being released, followed by a sustained phase reaching 70 ± 2.08% of KP after 24 h.
Figure 7. In vitro release profile of KP from SLN gel and commercial gel across the dialysis membrane. The error bars represent the 95% confidence intervals of 3 experiments.
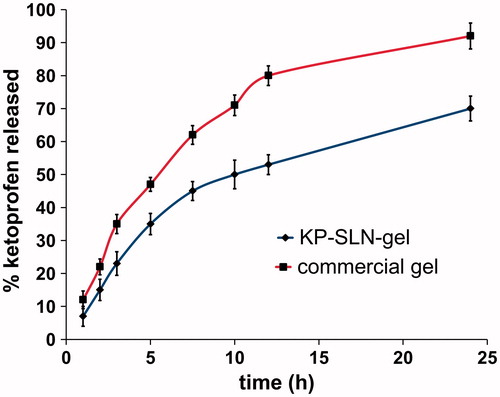
Table 6. Kinetic analysis of the in vitro release data of KP-SLN gel and commercial gel.
Linear regression analysis of the release data revealed that KP was released from SLN by a diffusion-controlled mechanism which is based on the Fick’s law of diffusion, while KP was released from the commercial one by first-order kinetics which describes that release rate is dependent on drug concentration ().
Ex-vivo permeability of KP released from the KP-SLN gel
The profiles of KP permeability through the excised rat skin shown in suggest that SLNs are efficient permeation enhancers, where KP permeation rate is higher when incorporated in the SLN gel formulation compared with the commercial gel. This finding was confirmed by analyzing these profiles using a diffusion-based model (EquationEquation 6(6) ). The permeability coefficient and flux were significantly enhanced when SLNs were used (). This enhancement can be explained by increased diffusivity rather than by altered partitioning across the skin. The diffusion parameter D′ was 2-folds larger for the KP-SLN gel compared to the commercial gel, while the partition parameter K′ of both formulations were very close (). This dermal permeation enhancement achieved by the prepared SLNs can be explained by their lipophilic nature that may enhance the permeation of the drug, their small particle size that creates a large contact surface area and their ability to form a monolayer film that consequently produces intimate drug contact with the skin. Since this monolayer film is hydrophobic, it has an occlusive action that retards the loss of moisture as a result of evaporation, which can facilitate drug penetration (Wissing & Müller, Citation2003). Additionally, loss of water content from the SLNs induces crystal modification of SLNs matrix, and this can induce drug expulsion and penetration (Teeranachaideekul et al., Citation2008).
Figure 8. Ex vivo permeation profile of KP-SLN gel and commercial gel through rat skin. The error bars represent the 95% confidence intervals of 3 experiments.
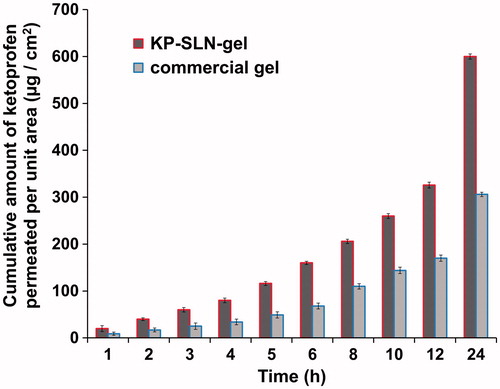
Table 7. Skin permeation parameters of KP-SLN gel and commercial gel. Results are the mean ± SD (n = 3).
Primary skin irritation study
Application of the KP-SLN gel to rabbit skin was not associated with irritation, erythema or edema (). It is generally accepted that SLNs have a skin protective effect. Such an effect is exerted through the formation of occlusive film layer of large surface area, thus preventing hydrodynamic water evaporation and promoting skin hydration (Wissing & Müller, Citation2002; Wissing & Müller, Citation2003; Souto & Müller, Citation2008). It seems that SLNs are not only efficient, but also safe and protective permeation enhancers. The later qualities are lacked by traditional permeation enhancers that are in use.
Figure 9. Photographs of rabbit skin after application of 1% formaldehyde solution (A), no treatment (B), KP-SLN gel (C), and blank SLN gel (D).
In vivo activity and pharmacodynamic modeling
Most studies reporting on novel topical formulations for NSAIDs base their in vivo anti-inflammatory activity evaluation on measuring surrogate endpoints at a single time point following application of the test and reference formulations. Yet, in vivo pharmacodynamic studies that involve repeated time measurements and dose duration-response modeling (i.e., the FDA approach for corticosteroid bioequivalence assessment) secures numerous advantages; (1) it determines the optimal dose duration for comparison; (2) it allows classification of formulations into various potency and efficacy classes (single time measurement characterizes efficacy alone); (3) it permits mechanistic understanding of comparative performances of the various formulations; and (4) making statistical inferences about efficacy using single measurements is prone to higher type I and type II errors. Therefore, we explored the merits of the FDA approach in this study.
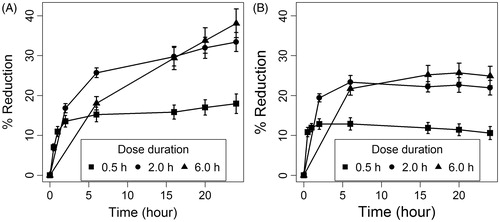
The time course of percentage change from baseline in carrageenan-induced rat paws edema following 0.5, 2, and 6 h durations is shown in for the KP-SLN gel and the commercial formulation. As time increases, the response increases rapidly and then starts to level off gradually until an asymptotic response is reached. Therefore, it was not surprising to find that the response-time data was best described by a Hill function parametrized in terms of a maximum effect (Emax) and time associated with half-maximal effect (T50). The rate of reduction in edema thickness (the rapidly rising part of the curve) seemed to be the same at all dose durations, indicating dose-independent T50 parameter. On the contrary, the difference between the maximum effect of the 0.5 h and the 2 h doses was larger than that between the 2 h and the 6 h doses. This observation suggests that the Emax parameter shows a dose-dependent behavior that also follows a Hill function. Using the Hill model in our study is in agreement with previous recommendations of using the Emax model to describe the relationship between the vasoconstriction response to topical corticosteroid and dose duration (Tsai et al., Citation2004).
Figure 10. Time course of percentage change from baseline in carrageenan-induced edema thickness following three dose durations. Panels (A) and (B) show the response to KP-SLN gel, and commercial gel, respectively. The error bars represent the 95% confidence intervals of 3 experiments.
The good agreement between measured and model-predicted responses in both the KP-SLN gel and commercial formulations () suggests that the model is efficient. Estimates of the model parameters along with the relative standard error of the estimate (%SE), and the non-parametric 95% confidence intervals for both formulations are depicted in . Except for one parameter (the T50 of the commercial formulation), the rest of the model parameters were estimated with good precision as indicated by a %SE less than 30% and narrow confidence intervals. Parameters Smax and T50 were significantly larger in the KP-SLN gel, while SD50 was basically the same. While exhibiting similar potencies (equal SD50 values), our optimized SLN formulation is more efficacious than the commercial formulation (larger Smax value) and produces more delayed response (larger T50 value). This result is understandable in the light of the fact that KP loaded in the SLN was released at a slower rate (), but penetrated the skin at higher rate () compared to KP loaded in the commercial gel. The finding of our study is in accordance with previous studies that reported enhanced anti-inflammatory activity of NSAIDs when loaded in SLNs (Jain et al., Citation2013; Khurana & Bedi, Citation2013).
Figure 11. Goodness-of-fit plot showing the relationship between measured and longitudinal dose duration response model predicted changes in edema thickness from baseline in KP-SLN gel (A) and commercial gel (B) formulations. Pearson’s correlation coefficient (r2) is shown.
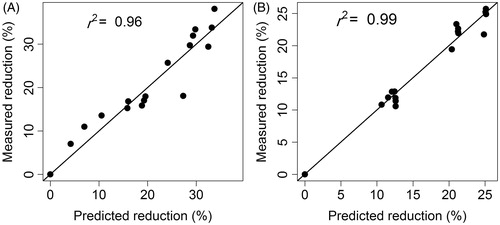
Table 8. Longitudinal dose duration response model parameter values for KP-SLN-gel and commercial formulations.
Assay sensitivity is greatest at doses that produce responses in the rapidly rising region of the dose-response curve based on the Emax model (Singh et al., Citation1999). Therefore, using dose duration around the SD50 of the test and reference formulations (∼30 minutes) maximizes the chances of detecting differences between them. If the ultimate objective is to compare the efficacy of the two formulations, measurement time around the T90 (time at which 90% of the maximum effect is reached) is optimal for comparison. In the case presented in this study, thicknesses of rat paw edema are better determined at 50 minutes and 18 h, the T90 of the reference and test formulations, respectively.
Conclusion
SLNs are safe and effective permeation enhancers for topical delivery. SLNs improve the efficacy of topically applied KP and retard the response to it, without altering its potency. ANN coupled with clustered bootstrap is a useful method for finding optimal solutions and estimating uncertainty associated with these solutions. Using this technique, we successfully optimized a SLN formulation for topical delivery of KP. In vivo activity assessment using LDR models allow mechanistic understanding of comparative performances of different topical formulations, and help design efficient and sensitive dermatological bioequivalence methods.
Declaration of interest
The authors declare no conflict of interest. This work was supported by an internal departmental grant.
References
- Abramson SB, Yazici Y. (2006). Biologics in development for rheumatoid arthritis: relevance to osteoarthritis. Adv Drug Deliv Rev 58:212–25.
- Arai H, Suzuki T. (2007). Bootstrap re-sampling technique to evaluate the optimal formulation of theophylline tablets predicted by non-linear response surface method incorporating multivariate spline interpolation. Chem Pharmaceut Bull 55:586–93.
- Attia DA. (2009). In vitro and in vivo evaluation of transdermal absorption of naproxen sodium. Aust J Basic Appl Sci 3:2154–65.
- Battista O. (1985). Cellulose, microcrystalline. Encyclopedia of polymer science and engineering. New York, USA: John Wiley and Sons, vol 3: 86–90.
- Cavalli R, Marengo E, Rodriguez L, et al. (1996). Effects of some experimental factors on the production process of solid lipid nanoparticles. Eur J Pharm Biopharm 42:110–15.
- Cochran WG, Gertrude MC, ed. (1992). Cox, experimental designs. New York: Wiley.
- Cortesi R, Esposito E, Luca G, et al. (2002). Production of lipospheres as carriers for bioactive compounds. Biomaterials 23:2283–94.
- Duangjit S, Opanasopit P. (2014). Bootstrap resampling technique to evaluate the reliability of the optimal liposome formulation: skin permeability and stability response variables. Biol Pharmaceut Bull 37:1543–9.
- Efron B, Tibshirani RJ. (1994). An introduction to the bootstrap. Florida, USA: CRC Press.
- Elzhov TV, Mullen KM. (2015). Minpack. ln: R interface to the Levenberg–Marquardt nonlinear least-squares algorithm found in MINPACK, plus support for bounds. R Package Version 1:1–9.
- Guinedi AS, Mortada ND, Mansour S, et al. (2005). Preparation and evaluation of reverse-phase evaporation and multilamellar niosomes as ophthalmic carriers of acetazolamide. Int J Pharm 306:71–82.
- Günther F, Fritsch S. (2010). Neuralnet: training of neural networks. The R Journal 2:30–8.
- Hennig C. (2014). FPC: flexible procedures for clustering. R Package Version 2:1–9.
- Hussain AS, Yu X, Johnson RD, et al. (1991). Application of neural computing in pharmaceutical product development. Pharm Res 8:1248–52.
- Jain D, Bajaj A, Maskare P, et al. (2013). Design of solid lipid nanoparticles of the NSAID dexflurbiprofen for topical delivery. J Pain 4:S86.
- Jenning V, Gysler A, Gohla SH, et al. (2000). Vitamin A loaded solid lipid nanoparticles for topical use: occlusive properties and drug targeting to the upper skin. Eur J Pharm Biopharm 49:211–18.
- Kelidari H, Saeedi M, Akbari J, et al. (2015). Formulation optimization and in vitro skin penetration of spironolactone loaded solid lipid nanoparticles. Colloids Surf B Biointerfaces 128:473–9.
- Kheradmandnia S, Vasheghani-Farahani E, Nosrati M, et al. (2010). Preparation and characterization of ketoprofen-loaded solid lipid nanoparticles made from beeswax and carnauba wax. Nanomed Nanotechnol Biol Med 6:753–9.
- Khurana S, Bedi PMS, Jain NK, et al. (2013). Preparation and evaluation of solid lipid nanoparticles based nanogel for dermal delivery of meloxicam. Chem Phys Lipids 175:65–72.
- Kumbhar D, Wavikar P, Vavia P, et al. (2013). Niosomal gel of lornoxicam for topical delivery: in vitro assessment and pharmacodynamic activity. American Association of Pharmaceutical Scientists. PharmSciTech 14:1072–82.
- Lippacher A, Müller R, Mader K. (2002). Semisolid SLN dispersions for topical application: influence of formulation and production parameters on viscoelastic properties. Eur J Pharm Biopharm 53:155–60.
- Liu D, Ge Y, Tang Y, et al. (2010). Solid lipid nanoparticles for transdermal delivery of diclofenac sodium: preparation, characterization and in vitro studies. J Microencap 27:726–34.
- Liu W, Hu M, Liu W, et al. (2008). Investigation of the carbopol gel of solid lipid nanoparticles for the transdermal iontophoretic delivery of triamcinolone acetonide acetate. Int J Pharm 364:135–41.
- Manconi M, Valenti D, Sinico C, et al. (2003). Niosomes as carriers for tretinoin. II. Influence of vesicular incorporation on tretinoin photostability. Int J Pharm 260:261–72.
- Mehnert W, Mäder K. (2001). Solid lipid nanoparticles: production, characterization and applications. Adv Drug Deliv Rev 47:165–96.
- Montenegro L, Sinico C, Castangia I, et al. (2012). Idebenone-loaded solid lipid nanoparticles for drug delivery to the skin: in vitro evaluation. Int J Pharm 434:169–74.
- Morris CJ. (2003). Carrageenan-induced paw edema in the rat and mouse. Inflammation Protocols. New York, USA: Springer, 115–21.
- Muller RH, Mader K, Gohla S, et al. (2000). Solid lipid nanoparticles (SLN) for controlled drug delivery-a review of the state of the art. Eur J Pharm Biopharm 50:161–77.
- Okamoto H, Hashida M, Sezaki H, et al. (1988). Structure‐activity relationship of 1‐alkyl‐ or 1‐alkenylazacycloalkanone derivatives as percutaneous penetration enhancers. J Pharm Sci 77:418–24.
- Onuki Y, Ohyama K, Kaseda C, et al. (2008). Evaluation of the reliability of nonlinear optimal solutions in pharmaceuticals using a bootstrap resampling technique in combination with Kohonen's self-organizing maps. J Pharm Sci 97:331–9.
- Özgüney IS, Karasulu HY, Kantarci G, et al. (2006). Transdermal delivery of diclofenac sodium through rat skin from various formulations. PharmSciTech 7:E39–45.
- Patel HK, Barot BS, Parejiya PB, et al. (2013). Topical delivery of clobetasol propionate loaded microemulsion based gel for effective treatment of vitiligo: ex vivo permeation and skin irritation studies. Colloids SurfB: Biointer 102:86–94.
- Priyanka K, Hasan SAA. (2012). Preparation and evaluation of montelukast sodium loaded solid lipid nanoparticles. J Young Pharm 4:129–37.
- Rahman Z, Zidan AS, Khan MA. (2010). Non-destructive methods of characterization of risperidone solid lipid nanoparticles. Eur J Pharm Biopharm 76:127–37.
- Singh G, Ramey DR, Fries M, et al. (1994). Comparative toxicity of non-steroidal anti-inflammatory agents. Pharmacol. Ther 62:175–91.
- Singh GJP, Adams WP, Lesko LJ, et al. (1999). Development of in vivo bioequivalence methodology for dermatologic corticosteroids based on pharmacodynamic modeling. Clin Pharm Therap 66:346–57.
- Sivaramakrishnan R, Nakamura C, Mehnert W, et al. (2004). Glucocorticoid entrapment into lipid carriers—characterisation by parelectric spectroscopy and influence on dermal uptake. J Control Rel 97:493–502.
- Souto E, Müller R. (2008). Cosmetic features and applications of lipid nanoparticles (SLN®, NLC®). Int J Cosm Sci 30:157–65.
- Sun Y, Peng Y, Chen Y, et al. (2003). Application of artificial neural networks in the design of controlled release drug delivery systems. Adv Drug Del Rev 55:1201–15.
- Takahara J, Takayama K, Isowa K, et al. (1997). Multi-objective simultaneous optimization based on artificial neural network in a ketoprofen hydrogel formula containing O-ethylmenthol as a percutaneous absorption enhancer. Int J Pharm 158:203–10.
- Takayama K, Nagai T. (1991). Simultaneous optimization for several characteristics concerning percutaneous absorption and skin damage of ketoprofen hydrogels containing d-limonene. Int J Pharm 74:115–26.
- Takayama K, Takahara J, Fujikawa M, et al. (1999). Formula optimization based on artificial neural networks in transdermal drug delivery. J Control Rel 62:161–70.
- Teeranachaideekul V, Boonme P, Souto EB, et al. (2008). Influence of oil content on physicochemical properties and skin distribution of Nile red-loaded NLC. J Control Release 128:134–41.
- Tsai JC, Chuang SA, Hsu M-Y, et al. (1999). Distribution of salicylic acid in human stratum corneum following topical application in vivo: a comparison of six different formulations. Int J Pharm 188:145–53.
- Tsai JC, Cheng CL, Choi C-H, et al. (2004). Evaluation of in vivo bioequivalence methodology for topical clobetasol 17‐propionate based on pharmacodynamic modeling using Chinese skin. J Pharm Sci 93:207–17.
- Ueda N, Nakano R. (1995). Estimating expected error rates of neural network classifiers in small sample size situations: a comparison of cross-validation and bootstrap. IEEE International Conference on Neural Networks, 1995.
- Utreja S, Jain N. (2001). Solid lipid nanoparticles. Advances in controlled and novel drug delivery. New Delhi, India: CBS Publishers.
- Wavikar P, Vavia P. (2013). Nanolipidgel for enhanced skin deposition and improved antifungal activity. American association of pharmaceutical scientists. AAPS PharmSciTech 14:222–33.
- Wissing S, Müller R. (2002). The influence of the crystallinity of lipid nanoparticles on their occlusive properties. Int J Pharm 242:377–9.
- Wissing SA, Müller RH. (2003). Cosmetic applications for solid lipid nanoparticles (SLN). Int J Pharm. 254:65–8.
- Wissing SA, Müller RH. (2003). The influence of solid lipid nanoparticles on skin hydration and viscoelasticity-in vivo study. Eur J Pharm Biopharm 56:67–72.