
Abstract
Utilization of quercetin (QT) in clinics is limited by its instability and poor solubility. To overcome these disadvantages, we prepared QT as QT-loaded PLGA-TPGS nanoparticles (QPTN) and examined its properties and therapeutic efficacy for liver cancer. QT-loaded PLGA nanoparticles (QPN) and QT/coumarin-6-loaded PLGA-TPGS nanoparticles (QCPTN) with coumarin-6 as a fluorescent marker were also prepared to investigate the cellular uptake by HepG2 and HCa-F cells using a confocal laser scanning microscope (CLSM), and their effects on apoptosis of HepG2 cells were assessed with flow cytometry. The results measured using transmission electron microscopy, scanning electron microscopy and size analyses indicated that QPTN were stably dispersed sphere with diameter in the range of 100-200 nm. It indicated that the QT loading and encapsulation efficiency in QPTN reached 21.63% and 93.74%, respectively, and the accumulative drug release of QPTN was 85.8%, the QCPTN uptake in HCa-F and HepG2 cells were 50.87% and 61.09% using HPLC analysis, respectively. The results determined using an Annexin-PI flow cytometry indicated that QPTN could induce HepG2 cell apoptosis in a dose dependent manner. The results of histological examination and HPLC analysis confirmed that QPTN was targeted to liver cells. In vivo analysis using solid tumor-bearing mouse model indicated that QPTN could suppress tumor growth by 59.07%. Moreover, all the studied properties of QPTN were more desirable than those of QT-loaded PLGA nanoparticles (QPN). In conclusion, QPTN could be used as a potential intravenous dosage form for the treatment of liver cancer owing to the enhanced pharmacological effects of QT with increased liver targeting.
Introduction
Liver is the human body’s largest substantive organs and undertakes some important function of body. Malignant tumor occurrence in liver will lead to life-threatening consequences. As the third death causing cancer in the world, liver cancer is commonly treated with surgery (Altekruse et al., Citation2009). Although numerous varieties of surgical instruments and solutions have emerged in recent years, it does not significantly improve the present treatment situation of liver cancer and most patients still could not afford to pay higher surgical fees (Padhya et al., Citation2013; Morise et al., Citation2014a,Citationb; Chatterjee & Mitra, Citation2015). Therefore, it is necessary to seek drugs with low cost, distinct curative effect and high specificity for treatment of patients with liver cancer to achieve better clinical outcomes.
Traditional Chinese medicines (TCMs) have been widely used in clinical therapy. Quercetin (QT), one of TCMs, has been used for thousand years as anti-inflammatory and antibacterial medicine because of its extensive resource in China (Russo et al., Citation2014). Recent studies have shown that QT could significantly inhibit proliferation of liver, skin, breast, gastric, ovarian, prostate, colon, as well as other tumor cells in millimolar concentration (Hansen et al., Citation1997; Kang & Liang, Citation1997; Huang et al., Citation1999; Knowles et al., Citation2000), decrease tumor multidrug resistance (MDR) (Chen et al., Citation2010), and prevent DNA chain breaking due to the effects of free radicals accumulation in lipid membranes on purines and pyrimidines (Dajas, Citation2012). In addition, QT could significantly enhance apoptosis index of HepG2 cells and reduce the level of surviving (belong to inhibitors of apoptosis protein family), and B-cell lymphoma-2 (Bcl-2) (Tan et al., Citation2009). Moreover, QT can increase the expression of p53 in cancer cells to induce cancer cells apoptosis (Maurya & Vinayak, Citation2015).
Although QT has many pharmacological effects and good antitumor activity, it is rarely used in clinics because it contains many free phenolic hydroxyl groups, which may be easily oxidized in the air. In addition, it is poorly water-soluble and lipid-soluble due to its lipophilic benzene ring and hydrophilic phenolic hydroxyl (Abraham & Acree, Citation2014). To overcome these shortages, in this study, QT was prepared as nanoparticles (NPs), which could increase the stability of drugs by dispersing them into carrier material and reducing their contact with outer environment (Spencer et al., Citation2015). Meanwhile, QT-loaded NPs can target to liver by controlling the particle size, surface charge and carrier materials specific identification to liver (Truong et al., Citation2015), and gradually degraded to release drugs after phagocytosed by liver cancer cells (Makadia & Siegel, Citation2011).
The commercial polylactic-co-glycolic acid (PLGA) is a widely used carrier material and has been approved as drug delivery system by Food and Drug Administration (FDA) (Jain, Citation2000). PLGA is biocompatible, non-immunogenic polymer and biodegraded to nontoxic product for nature (Zimmer & Kreuter, Citation1995; Jain, Citation2000; Makadia & Siegel, Citation2011). D-α-Tocopheryl polyethylene glycol 1000 succinate (TPGS) is an excellent emulsifier for preparation of NPs and can enhance in vivo drugs uptake because it can improve permeability and reduce P-glycoprotein (P-gp)-mediated multiple drug resistance (MDR) of tumor cells (Collnot et al., Citation2007; Guo et al., Citation2013). We have previously synthesized poly (lactic-co-glycolic acid)-d-α-tocopheryl polyethylene glycol 1000 succinate (PLGA-TPGS) whose 1H-NMR spectrum (seen in Figure S1) can be found from these papers (Ma et al., Citation2010; Chen et al., Citation2011) (as also shown in the Supplementary files) with lower molecular weight and higher hydrophilicity and proven (1) it could rapidly and completely release drugs, (2) has an excellent performance on encapsulation efficiency (EE), drug loading (DL) (Ma et al., Citation2010), and (3) could concentrate drugs to liver, decrease toxicity to other organs and increase QT efficacy. Thus, we prepared QT-loaded PLGA-TPGS NPs (QPTN), evaluated their size distribution, surface charge, EE, DL, in vitro drug release, cellular uptake, cell cytotoxicity, apoptotic effect, liver targeting property, in vivo pharmacokinetics, pharmacodynamics and therapeutic effect (Gao et al., Citation2014).
Materials and methods
Materials
Quercetin (QT) with 99% purity was purchased from melonepharma (Dalian, China). PLGA-TPGS (MW 21-22 kD) was prepared and contributed by Dr. Lin Mei at the Academy of Life Sciences, Tsinghua University (Beijing, China) (Ma et al., Citation2010; Chen et al., Citation2011). 4,6-Diamidino-2-phenylindole dihydrochloride (DAPI) was provided by Fluka (Buche, Switzerland). Sodium dodecyl sulfate (SDS), TPGS, PLGA (50:50, MW 40–75 kD), dimethyl sulfoxide (DMSO), coumarin-6 (C6) of purity 99% and 3,8-Diamino-5-[3- (diethylmethylammonio) propyl]-6-phenylphenanthri-dinium diiodide (PI) were purchased from Sigma-Aldrich (St. Louis, MO). Methanol and phosphoric acid were purchased from Tedia (HPLC grade; Fairfleld, OH). HepG2 cells were provided by the Chinese Academy of Medical Sciences Cell Center. Ascitic hepatocarcinoma cell strain with high metastasis potential in lymphatic system (HCa-F cells) was contributed by the Morphological Lab of Dalian Medical University (Dalian, China). WST-1 (4-[3-(4-iodophenyl)-2-(4-nitrophenyl)-2H-5-tetrazolio]-1,3-benzene sulfonate) cell proliferation and cytotoxicity assay kits were purchased from Roche Applied Science, Inc. (Basel, Switzerland). For all other chemical reagents used, the highest quality were obtained.
Preparation of QT-loaded NPs
QT-loaded PLGA-TPGS NPs (QPTN) were prepared by using the ultrasonic emulsification-solvent evaporation technology reported previously by our group (Bao et al., Citation2015). Briefly, 8 ml of ethyl acetate dissolved in a given amount of QT and 100 mg PLGA-TPGS copolymer was added into 120 ml of 0.03% (w/v) TPGS aqueous solution drop by drop in an ice bath at 100 W ultrasonic treatments for 6 min to form an O/W emulsions. Then, the obtained emulsions were stirred for 24 h to volatilize ethyl acetate and centrifuged three times at 20 000 r/min using a high-speed refrigerated centrifuge (Sorvall Evolution RC, Kendro Laboratory Products, Asheville, NC) for 15 min to make sure that there were no free drug and carriers remained. The sediments were collected and dispersed in 5 ml of deionized water to form NPs suspensions. Finally, the NPs were obtained after freeze-dried for 24 h and stored in 4 °C until used for further analyses. Empty PLGA-TPGS NPs (EPTN) without any drugs were prepared using the same protocol. In addition, QT-loaded PLGA NPs (QPN) were also prepared as previously described in the same, but using the commercial material PLGA instead of PLGA-TPGS. QT/C6-loaded PLGA-TPGS NPs (QCPTN) were also prepared using the same method described above, and C6 was added quantitatively as a fluorescent marker in ethyl acetate which also containing QT and PLGA-TPGS. All kinds of NPs were prepared 6 samples in parallel using the same methods described above, and all NPs were characterized respectively.
Characterization of QT-loaded NPs
Size, ζ-potential and morphology
The size and ζ-potential of QPTN, QPN and QCPTN were analyzed using a Nano ZS90 light scattering and laser Doppler anemometry (Zetasize Nano ZS90, Malvern Instruments Ltd., Malvern, UK). Approximately 2 mg lyophilized NPs were scattered completely in 3 ml of water solutions after ultrasonic dispersion. The surface morphology of all NPs was observed using a transmission electron microscope (TEM, testing conditions: accelerating voltage of 120.0 kV; JEM-2000EX, Japan Electron Optics Laboratory Co. Ltd., Tokyo, Japan) and scanning electron microscope (SEM, testing conditions: accelerating voltage of 10 kV; SS 550, Shimadzu, Tokyo, Japan). The suspended samples were precipitated on copper grids for TEM and immersed by 2.5% phosphotungstic acid for 3 min. To prepare samples for SEM, the NPs surface was coated with a thin layer of gold before measurements were performed. The measurements were performed in sextuplicate.
Drug loading, encapsulation efficiency and in vitro drug release
QT in the drug-loaded NPs was measured using a HPLC (1200 Series, Agilent Technologies, Santa Clara, CA). The full methods are described in the Supplementary files. DL was defined as ratio between the amounts of QT loaded in NPs and the amounts of NPs, and EE was defined as ratio between the amounts of QT loaded in NPs and total QT added quantitatively in the prime. The measurements were performed in sextuplicate. Dialysis method selected to examine the in vitro release of free QT and QT-loaded NPs (Chen et al., Citation2014) is also described in the Supplementary files.
Cellular uptake of QCPTN
HepG2 is one of the most widely used hepatocellular carcinoma cell line. In our previous study (Bao et al., Citation2015), the NPs with the fluorescent marker of C6 in cellular uptake by HepG2 cells were analyzed quantitatively and qualitatively. In this study, C6 was also used as the fluorescent maker, similar to the previous research at concentration of 200 μg/ml (meanwhile the concentration of QT in QCPTN was 202.53 μg/ml). HepG2 cells were cultured in high glucose Dulbecco's modified Eagle’s medium (H-DMEM, Thermo Fisher Scientific, Waltham, MA) supplemented with 10% fetal bovine serum (FBS, Thermo Fisher Scientific) and 1% antibiotics. HCa-F cells were cultured in Roswell Park Memorial Institute-1640 (RPMI-1640, Thermo Fisher Scientific) and incubated as described above. The culture was maintained in an incubator containing 5% CO2 at 37 °C. HepG2 cells were vaccinated in a 24-well plate of 5 × 10⁴ cells/well. Then the cells were incubated with QCPTN suspensions (QCPTN was sonicated in an ice bath at 100 W for 2 min to disperse evenly in the medium) for 2 h in an incubator. After incubation, the suspension was removed and 500 μl cold PBS was used for three times to eliminate residual NPs in the wells. Then 100 μl 75% ethanol (kept at −20 °C) was used to fix the cells for 10 min and rinsed for three times with cold PBS. The cells were stained with 150 μl DAPI for 15 min and washed by cold PBS for three times. QCPTN internalized by HepG2 cells was observed by a confocal laser scanning microscope (CLSM) (Leica TCS SP5, Leica Microsystems Co. Ltd., Solms, Germany). HCa-F cells used for the cellular uptake experiment were disposed using the same protocol except for being cultured in sterile centrifuge tubes.
After observed the fluorescence, the cells in each well of plates or tubes were all collected into different tubes, and then dispersed in appropriate purified water for the quantitative analyses. The full methods used for these procedures can be viewed in the Supplementary files. Cellular uptake efficiency was calculated by the ratio between added amount and measured amount of drug in cells.
Cell apoptosis
Cell apoptosis was measured using a flow cytometry and Annexin V-FITC Apoptosis Detection Kit (Thermo Fisher Scientific, Waltham, MA). HepG2 cells were planted in 6-well plates at a density of 2 × 10⁵ cells/ml. QPTN suspensions and QT solutions (QTS) were joined at 6, 24 and 48 μg/ml equivalent QT concentrations after 24 h respectively, and 48 μg/ml 5-fluorouracil solutions (FS) was used as positive control, and all drugs were disposed as mentioned in the cytotoxicity test. Then the cells were collected respectively after being incubated with drugs for 24 h, and washed with PBS for 3 times. The cells above were suspended in cool binding buffer, and then 5 μl AnnexinV-FITC and 1 μl PI were added to 100 μl samples from each of the cell suspensions. The cells were detected using a fluorescence-activated cell sorter (FACS) (Accuri C6, Genetimes Technology Inc., Shanghai, China) by dual parameter analysis at the excitation wavelength of 488 nm after incubated for 30 min at 4 °C in dark place.
The in vitro cytotoxicity study of the NPs and QTS to the HepG2 cells was assessed using WST-1 assays and IC50 values, defined as the drug concentration at which 50% of cancer cell growth was inhibited, are described in the Supplementary files and was used to verify the nanoparticle effects in vitro.
In vivo drug concentration and frozen slices of QCPTN for evaluating liver targeting property
Animal model establishment and pretreatment of biological samples
Kunming male mice in the age of six weeks (20–22 g) were obtained from the Dalian Medical University Laboratory Animal Center and fasted overnight in this investigation. All of the animal experiments in this study were executed by the Institutional Animal Care and Use Committee (IACUC) (Dalian Medical University, Dalian, China). The methods used to establish animal model and dispose biological samples are described in the Supplementary files.
Drug administration
Three mice were selected randomly without any administration as blank control group and euthanatized immediately after other groups were administered different drugs. The tissues (liver, heart, spleen, lungs, kidneys and tumor) of these mice were removed immediately and kept in −80 °C for 20 min to evaluate liver targeting property using frozen tissue sections. The rest of mice were injected via tail vein after being divided randomly into two groups. In the first group of QCPTN, ninety-eight mice were administered the QCPTN suspensions at a dosage of 10 mg/kg equivalent to the QT concentration. QCPTN suspensions were dispersed into 25% v/v PEG400 in normal saline solutions and sonicated at 100 W for 1 min in an ice bath to keep better dispersing state. In the second group of QTS, eighty mice were administered QT solutions (25% v/v PEG400 in normal saline as solvent) at a dosage of 10 mg/kg. Ten mice of each group were selected randomly and got the plasma and tissue homogenates (liver, heart, spleen, lungs, kidneys and tumor) as mentioned above at the timepoints of 0.08 (i.e. 5 min), 0.5, 1, 2, 4, 8, 12 and 24 h. Three mice from QCPTN group were sacrificed at the timepoints of 0.5, 1, 2, 4, 8 and 12 h for fluorescence image study. After euthanasia, the tissues (liver, heart, spleen, lungs, kidneys and tumor) of mice were isolated and kept in −80 °C for 20 min. The frozen tissues were put immediately on a frozen microtome (HM500, Microm International GmbH, Walldorf, Germany) to get the approximately 7 μm thick frozen slices. Ten pieces of each tissue were observed by a fluorescence inversion microscope (Olympus IX81; Olympus Corporation, Tokyo, Japan). The methods used to evaluate the liver targeting property are described in the Supplementary files.
The pharmacokinetics study of QPTN and QPN suspensions and QTS that was performed in Sprague Dawley rats is described in the Supplementary files and was used to verify the nanoparticle processes in vivo.
Therapeutic effect in vivo study
Forty eight Kunming male mice in the age of six weeks (20–22 g) were selected and established the tumor-bearing mice model by implanting HCa-F cells according to the method of liver targeting property as mentioned above. The mice were set randomly for six groups (8 mice in each group) and each group was treated for 10 consecutive days (once a day) by the tail intravenous injection. All of the dispersion medium was 25% (v/v) PEG400 in normal saline solutions, and the group as follows: the blank control group (the blank medium above injected at dose of 0.01 ml/g), EPTN suspensions group (EPTN was dispersed in the medium at the same dosage of PLGA-TPGS in QPTN group), FS group (5-fluorouracil was dissolved in the medium as the positive control group and injected at the dose of 10 mg/kg), QTS group (an arranged amount of QT were dissolved in the medium and the dose of QT was 10 mg/kg), QPN suspensions group and QPTN suspensions group (QPN and QPTN were dispersed in the medium at the same dosage of 10 mg/kg, respectively). The NPs suspensions above were sonicated at 100 W for 1 min in an ice bath, respectively. Different detection indexes were referenced to measure the in vivo therapeutic effect. The volumes of tumors before and after drug administration were calculated by V = a2 × b/2 (a and b were on behalf of the shortest-diameters and longest-diameters, respectively) (Gao et al., Citation2014). All the tumors were isolated and weighed after 10 days injection. The tumor growth inhibition rate (IR, %) was calculated as follows: (the average weight in the blank control group–the average weight in the administration group)/the average weight in the blank control group × 100. The tumors in QTS, QPN and QPTN group were selected randomly at the amount of six in each group. With four times of tumor weight, the normal saline was joined to form homogenate of each tumor. According to the method of dealing with biological samples in vivo drug concentration for evaluating liver targeting properties in the mice, the content of QT was calculated according to a standard curve equation. Two solid tumor specimens in six groups were then prepared randomly to be formalin-fixed, paraffin-embedded for hematoxylin and eosin (H&E) staining and observed by microscope to evaluate the antitumor activity.
Statistical analysis
All of the data were expressed as mean ± SD. The statistical significance of differences was carried out using a one-way analysis of variance and Student’s t-test (SPSS13.0 statistical software, Chicago, IL) (International Business Machines Corporation, Armonk, NY), and the required level for statistical significance was set at p < 0.05.
Results
Characterization of drug-loaded NPs
Surface morphology
The TEM images of the QPTN, QPN and QCPTN are shown in . As polydispersity indexes (PDI) listed in , the particles had better stability in dispersion. TEM images revealed that particles were spherical and regular. Furthermore, the sizes obtained using TEM were in the range of 100-300 nm except QPN, which further manifested the results listed in . The SEM images of the QPTN, QCPTN and QPN are shown in . SEM images exhibited that the NPs were spherical in shape with smooth surface and the size of NPs also varied in the range 100-300 nm, which was similar to the results of TEM images.
Figure 1. Characterization images of drug-loaded nanoparticles. A(a), A(b) and A(c) are TEM images of QT-loaded PLGA-TPGS nanoparticles (QPTN), QT-loaded PLGA nanoparticles (QPN) and QT/coumarin-6-loaded PLGA-TPGS nanoparticles (QCPTN), respectively (200 000×); B(a), B(b) and B(c) are SEM images of QPTN, QPN and QCPTN, respectively (30 000×).
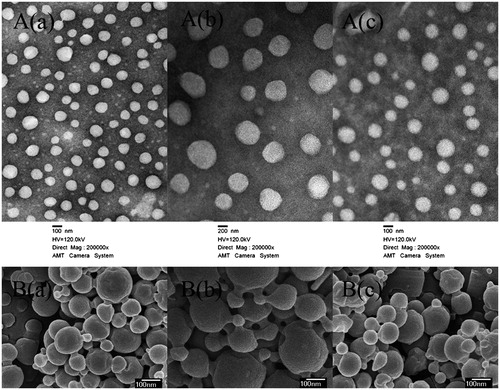
Table 1. Characterization of NPs (n = 6, mean ± SD).
Size, size distribution, and surface charge
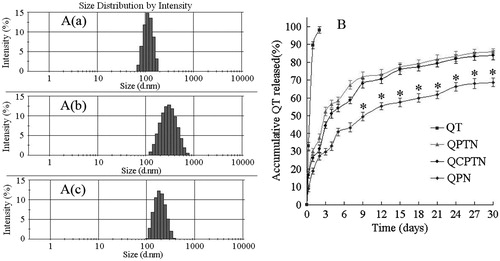
The size, size distribution and ζ-potential of the QPTN, QPN and QCPTN prepared in this study are listed in . The average particle sizes of QPTN and QCPTN were 155.4 nm and 193.6 nm respectively with their PDI of less than 0.2 for the synthetic material PLGA-TPGS, and that of QPTN was smaller than QCPTN which QT and C6 were loaded simultaneously. But the average particle size of QPN with the material PLGA was increased to 363.8 nm with PDI at 0.195 as listed in . QPTN, QPN and QCPTN had the ζ-potential of −23.3 mV, −14.7 mV and −23.1 mV which are also listed in .
Drug loading and encapsulation efficiency and in vitro drug release
The DL and EE of QPTN, QPN and QCPTN prepared in this study are also listed in . The DL of QT in QTPN, QPN and QCPTN were 21.63%, 15.14%, respectively, and the DL of QT and C6 in QCPTN were only 10.50% and 10.36%, respectively. Because the amount of QT in QCPTN was only halved compared to that for the QPTN during the preparation procedure, the DL of QT in QCPTN was also half of that in QPTN. In addition, the results revealed that EE was similarly high (around 90%) for all NPs except QPN with only 64.61% of EE.
As shown in , the in vitro drug release profiles for the QPTN, QPN and QCPTN showed biphasic release pattern with an initial burst followed by a sustained release in comparison to raw QT (with an expeditious release of 98.1% in the first 2 d).The initial burst of 52.5%, 29.6% and 44.6% in the first 3 d can be observed for QPTN, QPN and QCPTN, respectively, which was followed by an approximately first-order release afterward. After 30 days, the accumulative drug release for QPTN and QCPTN were found to be 85.8% and 83.9%, which was significantly faster than that for QPN at 68.8% (approaching an approximately 17% increase in drug release, p < 0.05).
Figure 2. A(a), A(b) and A(c) are the size distribution by intensity images of QPTN, QPN and QCPTN, respectively; B is the in vitro drug release profiles of QT, QPTN, QCPTN and QPN, respectively. All release data represent the mean ± SD of sextuplicate experiments. *p < 0.05 versus corresponding QPTN and QCPTN.
Cellular uptake of NPs
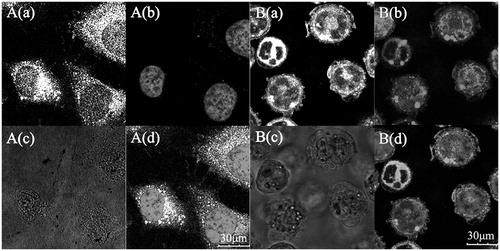
CLSM images () showed that different fluorescence intensity were all similar and clear boundaries among the cells in , especially the green fluorescence of C6 in QCPTN exhibited both strong and clear. Compared with bright field images, it indicated clearly that QCPTN had been internalized into the cells efficiently and rapidly. The nuclei were stained in blue () fluorescence by DAPI, distributed in the green cytoplasm.
Figure 3. Confocal laser scanning microscopy (CLSM) images of HepG2 and HCa-F cells after incubation with 200 μg/mL QCPTN for 2 h at 37 °C. QCPTN was green while nuclei of the cells were blue stained using DAPI. A(a) and B(a) are green fluorescence of QCPTN uptaken by HepG2 cells and HCa-F cells, respectively; A(b) and B(b) are blue fluorescence of HepG2 cells and HCa-F cells nuclei dyed by DAPI; A(c) and B(c) are bright field images of HepG2 cells and HCa-F cells, respectively; A (d) is a combined image of A(a) and A(b), and B(d) is a combined image of B(a) and B(b), respectively.
Cell apoptosis
Flow cytometry with double-dye Annexin-PI was used to monitor HepG2 cells growth inhibited by apoptosis. The percentages of apoptotic HepG2 cells after treatment with QPTN, QTS and FS respectively for 24 h are listed in . Cell apoptosis and necrosis in negative control group were very low, and after treated with different concentrations of QTS and QPTN, the percentage of apoptosis cells increased gradually in a dose-dependent manner. There was a significant difference between QPTN group and FS group at 48 μg/ml (p < 0.01). At the same time, it was observed that the volume of HepG2 cells in FS group looked shrinkage, and the chromosome under nuclear membrane showed the state of accumulation.
Table 2. Effect on apoptosis of HepG2 cells induced by QPTN, QTS and FS after 24 h (n = 6, mean ± SD).
In vivo drug concentration and frozen slices of QCPTN for evaluating liver targeting property
In vivo concentration of QT and detection indexes for evaluating liver targeting property of QCPTN in mice
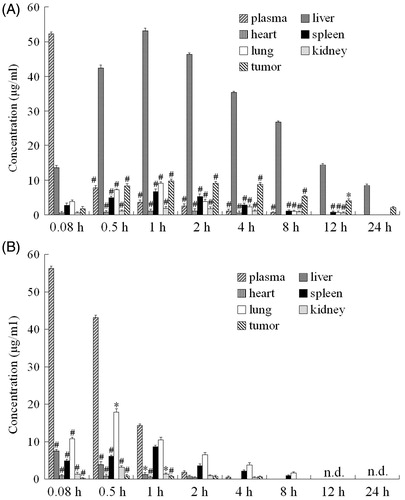
RP-HPLC method was used to analyze the concentration of QT in plasma and different tissues while QCPTN suspensions and QTS were injected into the mice via tail vein. It is the first time to discuss the drugs in the tumors of mice, and QT reached the tumor after 0.5 h. It showed that QT loaded in NPs owned the higher concentration and longer retention time than the other tissues except liver shown in . It also showed the concentration of QT in the plasma and different tissues after intravenous administration to mice tails at different time. As the column images indicated both QCPTN and QTS group had the same trend after injected for 0.08 h, QT got the maximum concentration in plasma and decreased as time gone, but QT concentration in the liver was definitely different. The concentration of QT in QCPTN group met the maximum at 1 h during the 24 h release time and obviously much higher than QTS group, and QT in QTS group decreased quickly after 4 h release time in the liver.
Figure 4. QT concentration-time column shape images of plasma and different organs. (A) QCPTN group, *p < 0.05, #p < 0.01 versus corresponding liver; (B) QTS group, *p < 0.05, #p < 0.01 versus corresponding plasma. All data represent the mean ± SD of experiments in decuplicate.
Four indexes (TI, SI, Re and Te) were used to evaluate liver targeting property of QCPTN and the values are listed in and . TI and SI were all greater than 1 except for SI plasma at 0.08 h which meant the QT-loaded NPs were much easier concentrated in targeting tissue (liver) than QT solutions in , and the concentration of QCPTN was higher in the liver than plasma. As listed in , the Re for the liver was greater than the Re for other samples and next was tumor. The values of Te are also listed in . The AUC for QCPTN in the liver was at least four folds higher than that for QCPTN in other tissues after injection, while the AUC for QTS were all around 1 except for in the heart. The comprehensive assessment above was indicated evidently the excellent liver targeting property of QCPTN.
Table 3. TIliver and SI values of QCPTN in mice at different timepoints after tail-intravenous administration.
Table 4. AUC, Re and Te values of QT in the plasma and different tissues of mice after tail-intravenous administration (n = 10, mean ± SD).
Fluorescence image study of frozen slices for evaluating liver targeting property of QCPTN in mice
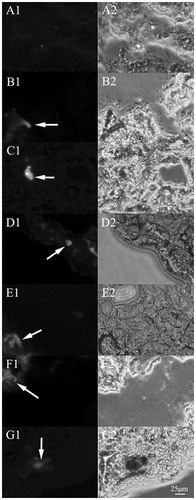
The frozen slices of mice tissues (liver, heart, spleen, lungs, kidneys and tumor) were observed using a fluorescence inversion microscopy as shown in and and S4–S7. The images (200×) included the blank control group and the QCPTN group at the timepoints of 0.5, 1, 2, 4, 8 and 12 h. C6 in QCPTN showed green fluorescence, and the fluorescence shown in the images was mostly localized in the liver, followed by the tumor, lungs, the last being spleen, heart and kidneys. It was shown that QCPTN had better liver targeting effect after intravenous injection, and the remaining quantity in tumor was relatively stable which was good for drug to play effect. It was difficult for QCPTN to stay in the heart, kidneys and other tissues that could also reduce the toxicity to them. The trend of fluorescence intensity was the strongest at 1 h and then diminished at the succeeding 11 h which was coincident to the results for the liver targeting property of QCPTN in mice with drug concentration, and they further indicated the liver targeting property of QCPTN are excellent in mice.
Figure 5. Fluorescence microscopy images (200×) of the liver frozen slices for the blank group and experiment groups of the mice injected with QCPTN at 0.5, 1, 2, 4, 8 and 12 hours. A images are liver frozen slices of blank group, B-G images are liver frozen slices of the experiment groups which were picked at 0.5, 1, 2, 4, 8 and 12 hours, respectively. The left images are green fluorescence of QCPTN with C6 (pointed to by the arrows); the right images are observed from white light channel.
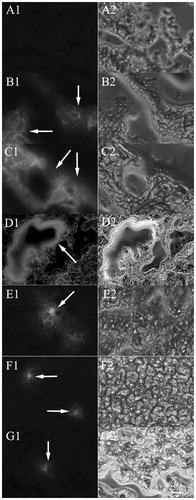
Figure 6. Fluorescence microscopy images (200×) of the tumor frozen slices for the blank group and experiment groups of the mice injected with QCPTN at 0.5, 1, 2, 4, 8 and 12 hours. A images are tumor frozen slices of blank group, B-G images are tumor frozen slices of the experiment groups which were picked at 0.5, 1, 2, 4, 8 and 12 hours, respectively. The left images are green fluorescence of QCPTN with C6 (pointed to by the arrows); the right images are observed from white light channel.
Pharmacokinetics study on rats
The results were evaluated according to the minimum principle of the Akaike information criterion (AIC) and the combination with the coefficients of correlation equation. The results showed that QPTN, QPN suspensions and QTS in rat plasma in vivo pharmacokinetics process were consistent with the two-compartment model and the weight coefficient was l/C. The elimination rate of QPTN and QPN was slower in rats, the mean retention time (MRT) compared with QTS was 2.11- and 1.59-fold higher, t1/2(β) was 2.13- and 1.58-fold longer than QTS. The pharmacokinetics parameters are listed in .
Table 5. Pharmacokinetic parameters on rats treated with QPTN, QPN and QTS (n = 6, mean ± SD).
Therapeutic effect in vivo
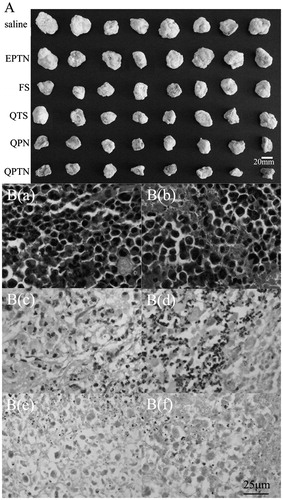
The in vivo therapeutic effects were investigated by the treatment on the solid tumor-bearing mouse model. All the solid tumors from each group were isolated from the sacrificed mice after administration for 10 days, as shown in . The tumors in the QPTN group were the smallest, and it showed obviously the efficient inhibition contrasted with those in the blank control group.
Figure 7. Images of the in vivo therapeutic effect. (A) Morphology of all tumors isolated from the sacrificed mice in each group after 10 days of administration; (B) The six images are representative H&E staining of tumors. B(a), B(b), B(c), B(d), B(e) and B(f) is the image of treated with normal saline control, empty PLGA-TPGS nanoparticles (EPTN), QT solutions (QTS), 5-Fluorouracil solutions (FS), QT-loaded PLGA nanoparticles (QPN) and QT-loaded PLGA-TPGS nanoparticles (QPTN), respectively. The tissue slices were H&E stained and observed by microscope (400×).
The effect of QPN and QPTN group was greater than the FS group which indicated the NPs could help improve the effect of drugs compared with the EPTN and QTS group at the same time. The evaluation data of tumors are listed in . Compared with the tumor volumes in the blank control group and EPTN group, the incremental tumor volumes in the QPTN group, QPN group and FS group were significantly smaller (p < 0.05), whereas the incremental tumor volume in the QTS group showed no significant difference (p > 0.05), which was consistent with the morphology results shown in . The tumor inhibition rate (IR) in the QPTN group (59.07%) was 12.93% higher than the QPN group (46.14%), 23.94% higher than the FS group (35.14%), 35.13% apparently higher than the QTS group (23.94%) respectively, and IR in the EPTN group was only 2.51%.The amounts of QT in each tumor of QTS, QPN and QPTN group are also listed in . There was significant difference between the NPs and solutions group (p < 0.05 or p < 0.01), meanwhile the QPN and QPTN group had a significantly higher amount of QT than QTS group in the tumor-bearing mouse model.
Table 6. Increment tumor volumes and tumor inhibition rates of various groups on mice (mean ± SD).
was the typical H&E staining images of solid tumor sections in the various groups, which showed the conditions relating to cell growth and apoptosis. The cell conditions in the blank control group () and EPTN group () were similar as the vigorous and disorderly growth scattered across the tumors sections. As shown in , the tumor cells in the FS group were decreased and the morphology of some cells was not clear. shows tissue obtained from the QTS group, in which the violet nuclei was reduced and the nucleus clutter edge in the QTS group was a little clearer than that in the FS group. shows tissue obtained from the QPN group in which had larger area of pink cell necrosis than the FS group, but the cell statuses were similar to the FS group. shows tissue obtained from the QPTN group, which had more cells with nuclei lost than others and fuzzy edge shape cells distributed in the whole tumor sections, indicating that QPTN demonstrated efficient inhibitory effect against the growth of tumor cells.
Disscussion
Compared with PLGA, the material PLGA-TPGS has good film-forming property because it had very high drug enwrapping ability as shown by measuring DL and EE of QPTN and QCPTN. Particle stability in dispersion is determined by surface charge, which was significantly impacted by ζ-potential. High absolute ζ-potential value could lead to strong repellent interactions among NPs in dispersion, resulting in high stability (Singh & Pai, Citation2014). Higher absolute ζ-potential value of QPTN than QPN indicated that QPTN was more stable in dispersion than QPN.
QT has poor solubility in water, and is difficult to maintain at sink condition in the in vitro release experiment. In this research, the sink condition was maintained by the addition of SDS and frequent replacement with fresh release medium. Furthermore, to obtain a better drug release efficiency, different materials were tested. As shown in , compared with PLGA NPs, PLGA-TPGS NPs had faster drug release probably due to its higher hydrophilicity. This is an advantage for increasing drug release to meet the therapeutic needs.
We have previously proven (Bao et al., Citation2015) drug in NPs formulation was more efficiently up taken by cancer cells than free drug. C6 is widely used as a fluorescence marker for its low dye loading (<0.05%, w/w), high fluorescence intensity, good biocompatibility and low leaking rate (Panyam et al., Citation2003). In this study, the NPs containing C6 and QT had been internalized by cells where QT was released from QCPTN to exert its therapeutic effect and C6 was used to show the location of the NPs. It was also proven that QT and C6 were uptaken into the cells together in NPs. After three times extraction of disrupted cells with acetone, the drugs in cells were completely dissolved due to the good solubility in acetone. The uptake rate of QCPTN in each cell was consistent with the result of CLSM images. These results laid the foundation for in vitro investigation on cytotoxicity of QPTN to HepG2 cells and in vivo therapeutic effect on the solid tumor-bearing mice model with HCa-F cells.
In this study, WST-1 was used to investigate the cytotoxicity of QT because WST-1 is more sensitive and stable in the test of cytotoxicity than MTT. WST-1 could be metabolized in mitochondria in living cells to water soluble formazan and measured by absorption at 450 nm (Ngamwongsatit et al., Citation2008). Drugs with stronger cytotoxicity to cells will form less formazan, showing absorbance. Cytotoxicity is an effective test to examine the effects of antineoplastic drugs. Our results showed that EPTN had little cytotoxicity to HepG2 and HCa-F cells while QT-loaded NPs were cytotoxic to HepG2 (Figure S3) and HCa-F cells comparable to the positive control FS, which laid a foundation for further in vivo test and suggested that QPTN may also be effective to other types of hepatoma cells. Previous study has shown that TPGS in synthetic materials could play inhibition effect to P-glycoprotein in MDR (Guo et al., Citation2013), which is one of the advantages of synthetic materials PLGA-TPGS (Ma et al., Citation2010). Compared with QPN, QPTN had higher cytotoxicity probably because it had smaller size and larger ζ-potential and was more likely to be uptaken and assimilated simultaneously and released at faster rate.
Apoptosis is an active cell death process regulated by gene. Abnormal apoptosis has close relationship with tumor development. It has been proven that QTS could induce apoptosis of many kinds of tumor cells (Kim et al., Citation2005; Mukherjee & Khuda-Bukhsh, Citation2015), however, its effective dosage was less studied. Apoptosis experiment using Annexin-PI flow cytometry indicated that QT could inhibit the growth and induce the apoptosis of HepG2 cells and for the first time proved that QPTN was a more potent apoptotic factor than QTS to HepG2 cells within 24 hours because HepG2 cells could directly uptake QPTN and then release and concentrate QT inside the cells. The mechanism of QPTN promoting apoptosis of HepG2 cells need to be further explored.
To our best knowledge, this is the first report evaluating the targeting effect of QT on liver tumor in tumor-bearing mice model with HCa-F cells and analyzing QT concentration in tumor. The results in and indicated tumor cells could uptake the drug-loaded NPs and maintain drug concentration at a stable level. This study also proved that QCPTN was excellent for targeting liver and QT loaded in QCPTN exhibited 12-fold and 4-fold longer retention time in liver and in plasma, respectively than QTS (). It indicated that the NPs could not only get the good quality to prolong the retention time in vivo but also improve the drug concentration in liver. Therefore, theoretically it should have better therapeutic effect on tumors inoculated in liver.
The targeting property of QPTN evaluated by both fluorescence imaging of frozen slices and drug concentration analysis at the same timepoints indicated that NPs were gathered mostly in liver at 1 h after injection, and QT was then slowly released upon enzymatic degradation of the materials. Fluorescence imaging showed clearly distinguished texture structure of tissues impacted by QCPTN from those in the blank control group, especially at 1, 2 and 4 h after injection.
The study also revealed the distribution of QCPTN and QTS in tumor. Both fluorescence imaging of frozen slices and drug concentration analysis indicated that QCPTN level was significantly higher in liver than in solid tumor, for blood flow in tumor of the ectopic transplantation tumor model being less than in liver. Meanwhile, the pathological changes of tissues around tumor leaded to fast grow and high permeability of blood vessels, allowing NPs with small size easily infiltrating into, but hardly out of the tumor tissues through endothelial pores. Because of the high enhanced permeability and retention effect (EPR) to tumor (Kreuter et al., Citation2002; Yadav et al., Citation2010), NPs can selectively permeate to tumor tissues from blood circulation and gather together, thus promoting the selective distribution of NPs in tumor tissues. The distribution of QCPTN in tumor was greater than in other tissues, allowing QPTN play great inhibiting effects on tumor-bearing mice with HCa-F cells in the in vivo pharmacodynamics study.
The fitted pharmacokinetics parameters indicated the pharmacokinetics processes of QPTN and QPN suspensions were greatly different from that of QTS. The former two had relatively longer t1/2(β), MRT and significant slower drug release, in consistence with the results of in vitro drug release. As for the lower remain of NPs in the blood circulation, AUC of QPTN and QPN was 0.59- and 0.64-fold less than that of QTS after 24 h, consistent with AUC trend in the in vivo drug concentration experiment evaluating liver targeting property in mice (AUC was 29.2 and 48.8 μg/ml in the plasma of mice in QCPTN and QTS groups, respectively, the former was significantly smaller than the latter). The reason was that after injection, the NPs were mainly phagocytosed by the reticuloendothelial system (RES), and quickly eliminated by the macrophages in RES from the blood and eventually reached the lysosomes of Kupffur cells in liver, especially for the particle with size in the range of 100-200 nm (Fox et al., 2005). Because there were too many Kupffur cells in liver, the drug-loaded NPs were phagocytosed by Kupffur cells and accumulated at there. Therefore, its gradually released drugs were concentrated in liver, resulting in decreased drug concentration and AUC of NPs in blood circulation compared with those of QTS. Moreover, utilization of TPGS, which could specifically reduce P-gp-mediated MDR of tumor cells (Guo et al., Citation2013), in QPTN as carrier significantly increased negative charge of the particles, thus making particles with smaller size more easily to be phagocytosed by the macrophages in liver. Therefore QPTN is more likely to target to liver and has lower AUC in the blood circulation than QPN. However, QPTN was faster and more completely released in vitro than QTS, meaning that QPTN had the longer retention time in the blood circulation, greater t1/2(β) and MRT, and less t1/2(α) than QPN.
The in vitro cytotoxicity assays and in vivo targeting property study had proven that QPTN had higher cytotoxicity and concentration in tumor, consistent to the results of in vivo liver targeting and pharmacokinetical studies. Further in vivo studies on solid tumors () revealed and proved that QPTN had more potent tumor suppression effect than EPTN, QTS and QPN at same QT dosage: showing the minimum volume growth and average weight of tumors as well as the highest tumor inhibitory rate of 59.07%, which was 27.47-, 2.47- and 1.28-fold of that for EPTN, QTS and QPN, respectively. Moreover, QT content per gram tumor in mice treated with QPTN was significantly higher (42.29- and 2.68-fold, respectively) than that of mice in QTS and QPN groups because 1) QT in QPTN, which had certain better targeting and slow drug-releasing characteristics, could be targeted to solid tumors and absorbed by tumor cells in mice, and 2) QPTN might reduce MDR mediated by P-glycoprotein in tumor cells and prolong drug retention time in tumor. Although QPTN-treated, tumor-bearing mice lived with smaller tumor, their body weight increased by certain extent in the period of experiment. By contrast, the body weight of mice without treatment also increased because their tumor became bigger. However, this could be wrong because solid tumor had cavity inside, observation by naked eyes may be not real, and certain error in measuring the longest-diameter and shortest-diameter due to large hollow, irregular volume and different angles.
Conclusion
QT-loaded NPs QPTN in the synthesized material PLGA-TPGS and QPN in the commercial PLGA had been successfully prepared by ultrasonic emulsification-solvent evaporation technique. QPTN had size around 150 nm and were surface negatively charged. Although both QPTN and QPN exhibited typically biphasic release manner, QPTN could achieve significantly faster drug release than QPN. The in vitro study showed the fluorescent labeled QPTN (QCPTN) could be uptaken and internalized by both HepG2 and HCa-F cells. In addition, cytotoxicity test in HepG2 cells using WST-1 reagent showed that QPTN had higher cytotoxicity than QPN. Cell apoptosis experiments showed that QTS and QPTN could induce cell apoptosis in a dose dependent manner (p < 0.05 or p < 0.01). QCPTN NPs were more targeted to liver in vivo and had better antitumor efficacy than QPN. Moreover, QPTN had slower in vivo elimination rate in SD rats than QPN and higher MRT and t1/2(β). Meanwhile, their in vivo pharmacokinetics process was confirmed to be the two-compartment model. QPTN had higher suppressive effects on tumor growth in mice than QTS in the in vivo therapeutic effect experiment. In conclusion, based on the good performance of the synthesized material PLGA-TPGS, QPTN has the potential to be used for the treatment of liver cancer.
Declaration of interest
The authors ensure that this article content has no conflict of interest. The authors alone are responsible for the content and writing of this article.
Supplementary material available online
Supplementary_files.pdf
Download PDF (707.5 KB)Acknowledgments
The authors are grateful for material support from Dr Lin Mei, who works at the Academy of Life Sciences, Tsinghua University (Beijing, China).
Related Research Data
References
- Abraham MH, Acree WE. Jr (2014). On the solubility of quercetin. J Mol Liq 197:157–9
- Altekruse SF, McGlynn KA, Reichman ME. (2009). Hepatocellular carcinoma incidence, mortality, and survival trends in the United States from 1975 to 2005. J Clin Oncol 27:1485–91
- Bao X, Gao M, Xu H, et al. (2015). A novel oleanolic acid-loaded PLGA-TPGS nanoparticle for liver cancer treatment. Drug Dev Ind Pharm 41:1193–203
- Chatterjee R, Mitra A. (2015). An overview of effective therapies and recent advances in biomarkers for chronic liver diseases and associated liver cancer. Int Immunopharmacol 24:335–45
- Chen Z, Liu D, Wang J, et al. (2014). Development of nanoparticles-in-microparticles system for improved local retention after intra-articular injection. Drug Deliv 21:342–50
- Chen HB, Zheng Y, Tian G, et al. (2011). Oral delivery of DMAB-modified docetaxel-loaded PLGA-TPGS nanoparticles for cancer chemotherapy. Nanoscale Res Lett 6:4
- Chen C, Zhou J, Ji C. (2010). Quercetin: a potential drug to reverse multidrug resistance. Life Sci 87:333–8
- Collnot EM, Baldes C, Wempe MF, et al. (2007). Mechanism of inhibition of P-glycoprotein mediated efflux by vitamin E TPGS: influence on ATPase activity and membrane fluidity. Mol Pharm 4:465–74
- Dajas F. (2012). Life or death: neuroprotective and anticancer effects of quercetin. J Ethnopharmacol 143:383–96
- Fox ME, Szoka FC, Frechet JMJ. (2009). Soluble polymer carriers for the treatment of cancer: the importance of molecular architecture. Acc Chem Res 42:1141–51
- Gao M, Xu H, Zhang CH, et al. (2014). Preparation and characterization of curcumin thermosensitive hydrogels for intratumoral injection treatment. Drug Dev Ind Pharm 40:1557–64
- Guo Y, Luo J, Tan S, et al. (2013). The applications of vitamin E TPGS in drug delivery. Eur J Pharm Sci 49:175–86
- Hansen RK, Oesterreich S, Lemieux P, et al. (1997). Quercetin inhibits heat shock protein induction but not heat shock factor DNA-binding in human breast carcinoma cells. Biochem Biophys Res Commun 239:851–6
- Huang YT, Hwang JJ, Lee PP, et al. (1999). Effects of luteolin and quercetin, inhibitors of tyrosine kinase, on cell growth and metastasis-associated properties in A431 cells overexpressing epidermal growth factor receptor. Br J Pharmacol 128:999–1010
- Jain RA. (2000). The manufacturing techniques of various drug loaded biodegradable poly (lactide-co-glycolide) (PLGA) devices. Biomaterials 21:2475–90
- Kang TB, Liang NC. (1997). Studies on the inhibitory effects of quercetin on the growth of HL-60 leukemia cells. Biochem Pharmacol 54:1013–18
- Kim WK, Bang MH, Kim ES, et al. (2005). Quercetin decreases the expression of ErbB2 and ErbB3 proteins in HT-29 human colon cancer cells. J Nutr Biochem 16:155–62
- Knowles LM, Zigrossi DA, Tauber RA, et al. (2000). Flavonoids suppress androgen-independent human prostate tumor proliferation. Nutr Cancer 38:116–22
- Kreuter J, Shamenkov D, Petrov V, et al. (2002). Apolipoprotein-mediated transport of nanoparticle-bound drugs across the blood-brain barrier. J Drug Target 10:317–25
- Ma Y, Zheng Y, Liu K, et al. (2010). Nanoparticles of poly(lactide-co-glycolide)-d-a-tocopheryl polyethylene glycol 1000 succinate random copolymer for cancer treatment. Nanoscale Res Lett 5:1161–9
- Makadia HK, Siegel SJ. (2011). Poly lactic-co-glycolic acid (PLGA) as biodegradable controlled drug delivery carrier. Polymers (Basel) 3:1377–97
- Maurya AK, Vinayak M. (2015). Quercetin regresses Dalton's lymphoma growth via suppression of PI3K/AKT signaling leading to upregulation of p53 and decrease in energy metabolism. Nutr Cancer 67:354–63
- Morise Z, Kawabe N, Tomishige H, et al. (2014a). Recent advances in the surgical treatment of hepatocellular carcinoma. World J Gastroenterol 20:14381–92
- Morise Z, Kawabe N, Tomishige H, et al. (2014b). Recent advances in liver resection for hepatocellular carcinoma. Front Surg 1:1–8
- Mukherjee A, Khuda-Bukhsh AR. (2015). Quercetin down-regulates IL-6/STAT-3 signals to induce mitochondrial-mediated apoptosis in a nonsmall-cell lung-cancer cell line, A549. J Pharmacopuncture 18:19–26
- Ngamwongsatit P, Banada PP, Panbangred W, Bhunia AK. (2008). WST-1-based cell cytotoxicity assay as a substitute for MTT-based assay for rapid detection of toxigenic bacillus species using CHO cell line. J Microbiol Methods 73:211–15
- Padhya KT, Marrero JA, Singal AG. (2013). Recent advances in the treatment of hepatocellular carcinoma. Curr Opin Gastroenterol 29:285–92
- Panyam J, Sahoo SK, Prabha S, et al. (2003). Fluorescence and electron microscopy probes for cellular and tissue uptake of poly(D,L-lactide-co-glycolide) nanoparticles. Int J Pharm 262:1–11
- Russo GL, Russo M, Spagnuolo C, et al. (2014). Quercetin: a pleiotropic kinase inhibitor against cancer. Cancer Treat Res 159:185–205
- Singh G, Pai RS. (2014). Pharmacokinetics and in vivo biodistribution of optimized PLGA nanoparticulate drug delivery system for controlled release of emtricitabine. Drug Deliv 21:627–35
- Spencer DS, Puranik AS, Peppas NA. (2015). Intelligent nanoparticles for advanced drug delivery in cancer treatment. Curr Opin Chem Eng 7:84–92
- Tan J, Wang B, Zhu L. (2009). Regulation of survivin and Bcl-2 in HepG2 cell apoptosis induced by quercetin. Chem Biodivers 6:1101–10
- Truong NP, Whittaker MR, Mak CW, Davis TP. (2015). The importance of nanoparticle shape in cancer drug delivery. Expert Opin Drug Deliv 12:129–42
- Yadav AK, Agarwal A, Rai G, et al. (2010). Development and characterization of hyaluronic acid decorated PLGA nanoparticles for delivery of 5-fluorouracil. Drug Deliv 17:561–72
- Zimmer A, Kreuter J. (1995). Microspheres and nanoparticles used in ocular delivery systems. Adv Drug Deliv Rev 16:61–73