
Abstract
SBA-15 is used to enhance the bioavailability of poorly soluble ketoprofen (KP) through stabilization of its amorphous state. Additionally, the current work provides a complete in vitro and in vivo study on preformulated KP-SBA-15 sample and formulated KP-SBA-15 in hard gelatin capsule. Loading of KP was done by a novel method called immersion-rotavapor method. KP was quantified by extraction and thermal gravimetric analysis (TGA). Characterization of the loaded SBA-15 sample was done by high resolution transmission electron microscopy (HRTEM), small angle X-ray diffraction (SAXRD), nitrogen adsorption/desorption isotherms, differential scanning calorimetry (DSC), Fourier transform infrared (FT-IR) spectroscopy and dissolution profiles. The loaded sample was formulated in hard gelatin capsule. The anti-inflammatory and analgesic studies were carried out on 24 adult male albino rats. TGA and extraction results showed 54.4 wt% of drug incorporated. Characterization of KP-SBA-15 sample confirmed the successful encapsulation of KP into the carrier pores in a molecular amorphous state. Additionally, loading of KP did not affect the mesoporous internal structure. During the first 5 min, the dissolution study showed very high release rates; nearly 50% of KP was released. These results were reflected on the in vivo study resulting in 82% inhibition in edema after 1 h and maximum analgesia after 30 min from the administration of the formulated sample. SBA-15 mesoporous silica nanoparticle proved to be a very promising drug delivery carrier that can be used as a facile way to enhance the bioavailability of poorly soluble drugs.
Introduction
The majority of new innovative drug candidates suffer from poor pharmacokinetics that reduces their bioavailability, especially in oral drug delivery that is still the most common and preferable administration route. The problems with poor bioavailability are usually related to the poor solubility of the drug, and therefore one of the main challenges in pharmaceutical industry is to find ways to enhance the solubility of the drugs without affecting its stability and pharmaceutical activity (Williams et al., Citation2013). The number of poorly soluble compounds among drugs under development increased rapidly, straight after high-throughput screening (HTS) was introduced in the drug discovery. HTS greatly strengthened the generation of leads, but the drawback of this new method was that it also caused a shift toward leads with higher molecular weights and lipophilic properties that are typically related to low aqueous solubility (Carnero, Citation2006). Therefore, enhancing the oral bioavailability of poorly soluble drugs creates one of the most challenging tasks that the scientists are currently facing (Salazar et al., Citation2014).
The applications of mesoporous silica nanoparticles (MSNs) in the pharmaceutical field are increasing day by day and receiving precise attention owing to their highly ordered structures, large pore sizes and high surface area. Thanks to its stable mesoporous structure and well-defined surface properties, mesoporous materials seem ideal for the encapsulation of pharmaceutical drugs, proteins and other biogenic molecules. Currently, employing MSNs for hosting and further delivering of a variety of molecules of pharmaceutical interest has appeared (Safari & Zarnegar, Citation2014).
MSNs show great promise for the future, as every dissolution-enhancing formulation approach used nowadays is known to depend on the active compound’s physicochemical profile. The potential of MSNs to yield physically stable, dissolution enhancing formulations, irrespective of a drug’s physicochemical profile, therefore seems very promising. In addition, considering the relatively low cost of their synthesis and the simplicity of the drug loading process, it is clear that mesoporous silica drug-carrier constitutes a potentially great expansion of the formulation scientist’s toolbox to overcome dissolution-limited bioavailability (Van Speybroeck et al., Citation2009).
Vallet-Regi et al. (Citation2001) reported the use of mesoporous silica MCM-41 for the host of ibuprofen. This was the first attempt to enhance the dissolution by encapsulation of hydrophobic drug (ibuprofen) in MSN (MCM-41). Since that time, these inorganic materials are being explored as carriers for oral drug delivery. In particular, MSNs are widely used as a delivery reagent because silica possesses favorable chemical properties, thermal stability and biocompatibility. Their unique properties render them suitable carriers for active pharmaceutical ingredients (Van Speybroeck et al., Citation2009): pore diameters that can be tuned between 2 and 30 nm, high specific surface areas (up to 1500 m2/g) creating a high potential for adsorption, large pore volumes (up to 1.5 cm3/g), and a silanol containing surface that can be functionalized to modify drug release. It is interesting to know that MSNs can be used in both enhancing the drug release and in controlling the release rate, depending on its type and morphology (Kwon et al., Citation2013).
Several studies have shown that different biologically active agents can be loaded and, subsequently, released from MSNs (Fu et al., Citation2012; Lopes et al., Citation2013). The dissolution of poorly soluble drugs from the MSNs particles is usually faster than that of bulk APIs. The fast dissolution from the particles is related to the confined space inside the pores that prevents long range ordering, thus preventing the crystallization of the loaded substances (Mellaerts et al., Citation2007). The stabilized amorphous form of the molecules improves the drug dissolution rate. In this context, it must be mentioned that the crystallization inside the pores is not totally impossible. Even though the drug typically is in its amorphous form, it may appear as small, nanosized crystals as well. The solubility of the nanocrystals is much higher than that of the bulk material. Therefore, this form is also advantageous considering drug absorption, and the stability of the product is better than in the case of amorphous drug. The loaded substances have been suggested to interact with the surfaces of the carrier via hydrogen bonding (Vallet-Regi, Citation2010). This increases the surface area of the APIs as compared to their crystalline counterparts, leading to further improvement in the drug dissolution rate (Bahl & Bogner, Citation2006).
SBA-15 is a widely researched type of MSNs for drug delivery (Fu et al., Citation2012; Wang et al., Citation2012). SBA-15, with 2D-hexagonal p6mm structure, was firstly synthesized in a highly acidic media using amphiphilic triblock copolymer of poly(ethylene oxide)–poly(propylene oxide)–poly(ethylene oxide) (EO20PO70EO20, P123) as template in 1998 (Zhao et al., Citation1998; He et al., Citation2009). SBA-15 stands for “Santa Barbra Amorphous”. SBA-15 possesses cylindrical ordered hexagonal mesopores (Zhao et al., Citation2013).
Most of the previous works concerning loading of APIs in MSNs focused mainly on the in vitro effect. The current work does not only focus on the in vitro effect of loading a model drug (KP) into SBA-15 but also provide a complete in vivo study assessing the pharmacokinetic effect regarding the anti-inflammatory effect and central analgesic properties of the loaded drug compared to a commercial product.
Ketoprofen (KP) is an NSAID with analgesic and antipyretic properties (Zhu et al., Citation2011). KP was chosen as a model drug as it is a BCS Class II drug substance (Shohin et al., Citation2012). Consequently, for drugs exhibiting poor aqueous solubility and high intestinal permeability, it would be anticipated that dissolution would be the rate-limiting step to drug absorption. Therefore, it is possible to study the effect of incorporating poorly aqueous soluble drugs in SBA-15 on their dissolution properties and hence their bioavailability.
Materials and methods
Materials
KP was obtained as a gift sample from Egyptian International Pharmaceutical Industries Company (Cairo, Egypt), Tetraethyl orthosilicate (TEOS) was obtained from Sigma Aldrich (St. Lewis), and Pluronic P123 (BASF GmbH, Ludwigshafen, Germany). Other reagents and solvents were of HPLC grade.
Methods
SBA-15 synthesis
SBA-15 synthesis was performed according to a standard method (Zhao et al., Citation1998). About 6 g of pluronic P123 was dispersed in 45 g of H2O, then 180 g of HCl (2 M) and 12.8 g of tetraethyl orthosilicate (TEOS) was added to the mixture. This mixture was then stirred for 24 h at 40 °C and then heated at 100 °C for another 24 h under a static condition. The mesoporous materials were recovered by filtration, washed with water, air-dried at room temperature and calcined at 550 °C for 6 h to remove the template forming SBA-15.
Drug loading procedure
Loading was performed by a novel method called immersion-rotavapor method. KP was dissolved in ethanol (200 mg/ml) and then adequate amount of the SBA-15 was added, while protected from light to yield drug:SBA-15 in the ratio 4:1. The mixture was stirred for 6 h and then the solvent was evaporated for 15 min using a rotavapor. Subsequently, the mixture was left to dry under vacuum for 24 h at room temperature. The resultant sample was denoted as SBA-15-KP.
Characterization
KP was quantified by extraction and thermal gravimetric analysis (TGA). Accurately weighed 10 mg of SBA-15-KP sample was extracted in 20 ml ethanol for 6 h with continuous stirring on magnetic stirrer. Then, the sample was centrifuged at 5000 rpm for 30 min. The supernatant was collected and the amount of drug was spectrophotometrically determined at 259.0 nm. Each analysis was carried out in triplicate.
TGA test was done by SDT Simultaneous TGA/DSC Q600 USA. The test was carried out as follows: 1 mg of SBA-15-KP sample was accurately weighed, placed in an aluminum-sealed cell, and the sample was then scanned by raising the temperature at a rate of 10 °C/min over a 0–600 °C range. TG used nitrogen as purge gas (20 ml/min). TG was calibrated by the melting point of indium (156.6 ± 0.2 °C) and zinc (419.5 ± 0.3 °C).
High resolution transmission electron microscope (HRTEM)
HRTEM imaging of the SBA-15 unloaded and loaded was recorded using Tecnai G20 Super twin double tilt (Hillsboro, OR) operating at 200 kV.
Small angle X-ray powder diffraction (SAXRD)
SAXRD patterns were recorded on Scintage XDS 2000 diffractometer (Cupertino, CA). The scan rate was 0.02 deg/min, step size of 0.01°, and a 2θ range of 0.60–10.00°.
Nitrogen adsorption–desorption analysis
The nitrogen adsorption–desorption isotherms and the structural parameters were recorded using Nitrogen Adsorption/Desorption analyzer (Nova 3200, West Palm Beach, FL). The nitrogen adsorption/desorption isotherms were measured at −196.15 °C. Prior to analysis, the samples were degassed under vacuum at 80 °C for 24 h. The specific surface areas of the samples were calculated using the Brunauer–Emmett–Teller (BET) method (Fagerlund, Citation1973). The total pore volume was assessed using the t-plot method illustrated by Lippens and de Boer (de Boer et al., Citation1966). The pore size distribution was calculated from the adsorption branch of isotherm using the Barrett–Joyner–Halenda (BJH) method (Barrett et al., Citation1951).
Differential scanning calorimetry (DSC)
DSC thermograms were recorded by SDT Simultaneous TGA/DSC Q600 (Delaware). The samples scanned by rising the temperature at a rate of 10 °C/min over a range between 0 and 200 °C.
Wide angle X-ray powder diffraction (WAXRD)
WAXRD patterns were recorded on Scintage XDS 2000 diffractometer. The scan rate was 0.03 deg/min, step size of 0.05° and a 2θ range of 5.00–35.00°.
Fourier transform infrared spectroscopy (FT-IR)
FT-IR studies were done by spectrometer Jasco FT/IR 460 plus (Oklahoma City, OK) using the KBr disc method. The disks were made by grinding 2–3 mg of each sample with 25–50 mg of potassium bromide, and compressed by a hydraulic press model at 10 tons pressure for 30 s. The scanning range was 400–4000 cm−1 and the resolution was 4 cm−1.
In vitro dissolution study
The dissolution profiles were carried out using USP standard dissolution apparatus I Dr. Schleuniger Pharmaton (Switzerland). Accurately weighed 50 mg of KP and equivalent amounts of 50 mg KP from SBA-15-KP sample was used. The dissolution studies were performed in 900 ml of 0.1 N HCl. The temperature of the dissolution medium was maintained at 37 °C ± 0.5 and the rotation speed was kept at 50 rpm. Aliquot samples of 5 ml were withdrawn at predetermined intervals with the replacement by equivalent volumes of fresh dissolution medium. Samples were filtered using 0.45 μm Millipore filters and assayed spectrophotometrically at 261 nm.
Formulation in hard gelatin capsule
The loaded sample was formulated in hard gelatin capsule. The composition of the capsule blend is shown in . The prepared formula will be denoted as F#1.
Table 1. Composition of the hard gelatin capsule blend.
In vivo studies
The in vivo study was approved by the Ethical Committee of Faculty of Pharmacy, Cairo University
The anti-inflammatory and analgesic studies were carried out on 24 adult male albino rats weighing 150–180 gm and 24 albino male mice weighing 20–25 gm, respectively. Animals were randomly allocated into four groups per each experiment, each of six animals. They were kept fasted for 16 h prior to the experiment, but allowed free access to water.
Tested groups
The tested groups are shown in . They were divided into four groups, the first served as the control group, the second group represented the carrier, while the third and fourth groups represented the standard reference (commercial Ketofan®) and the prepared formula (F#1), respectively.
Table 2. Composition of different tested groups.
Anti-inflammatory study
The anti-inflammatory effect after oral administration of the tested substances was measured by Carrageenan-induced paw edema in rats. This effect was determined according to the method described by Winter et al (Winter et al., Citation1962).
The exact weight of each rat was accurately recorded before the start of the experiment. The content of the prepared capsule formula as well as Ketofan® capsule were given as suspensions to the respective animal groups at a dose of 6 mg/kg. As for the control group, each animal was administered 1 ml distilled water. Finally, regarding group II that received the carrier was administered 0.1% SBA-15 in a volume of 5 ml/kg (equivalent to the amount of SBA-15 in the tested formula). A mark was made at the ankle joint (tibio–tarsal joint) of each rat. Paw edema was induced by subplantar injection of 0.1 ml of 1% sterile carrageenan in saline into the right hind paw and 0.1 ml of saline was injected into the left hind paw. The rats received the control or the tested substances 30 min before carrageenan injection.
The hind paw volume up to the ankle joint was measured immediately before carrageenan injection and at selected times (1/2, 1, 2, 3, 4 and 5 h) by water displacement method using plethysmometer Ugo Basile 7140 (Comerio, Italy). Results were expressed as the paw volume in milliliters. The percentage change in edema volume and the percentage inhibition was calculated.
% change in oedema volume = (Va - Vb/Vb)*100, where Va and Vb are the edema volume after and before carrageenan injection, respectively.
% inhibition in oedema volume = 100 - (Vt/ Vc* 100), where Vt and Vc are the mean percentage change in edema volume of carrageenan injected in paw of tested and control group, respectively.
Central analgesic activity study
The central analgesic activity was evaluated using hot plate method as described by Turner (Citation1965). The hot plate method is a sensitive method for screening central analgesic effect of compounds (Wani et al., Citation2012). Grouping and dosing was done as per the anti-inflammatory experiment. For three consecutive days preceding the experiment, mice were adapted on the hot plate by placing them on a plate (Ugo Basile 7280, Comerio, Italy) maintained at room temperature for 15 min each day. Each mouse was then placed gently onto the hot plate maintained at 50 ± 1 °C. Latency in reaction time to exhibit nociceptive responses, such as licking paws or jumping off the hot plate, was determined at 0, 30, 60, 90 and 120 min after administration of the test substances or the control.
Statistical analysis of data
Statistical analysis was carried out using repeated measures one-way ANOVA followed by the Tukey test for multiple comparisons at p < 0.05. Statistics were performed on the percentage change in edema volume and latency time at each selected time interval. The statistical study was done by GraphPad Prism version 5 software (La Jolla, CA).
Result
Characterization
TGA measures the mass loss that is proportional to the total drug content in the samples. On the other hand, the extraction depends on extracting the loaded sample in ethanol and then the amount of loaded KP is spectrophotometrically determined. The TGA curves for free KP, SBA-15 and SBA-15-KP are shown in . KP showed no weight loss in the range between 10 to 100 °C. Whereas, a sharp decline in the TGA curve started at 223 °C with endset at 290 °C pointing to the decomposition of KP over the range from 220 to 295, causing 99.68% weight loss. Meanwhile, unloaded SBA-15 showed a weight loss of 3.57% of its total weight in the region below 100 °C. This lost weight is due to the evaporation of physically adsorbed water (Marzouqa et al., Citation2012). SBA-15 had a total weight loss over the entire temperature range equal to 3.59%. On the other hand, SBA-15-KP had two distinct regions of weight losses; in the region below 100 °C, and in the region from 240 to 600 °C. shows the results from both the TGA and the extraction method; the average wt% for the loaded sample was calculated from both the results giving total amount of 54.4 wt% of drug incorporated.
Figure 1. TGA charts of ketoprofen, SBA-15 and SBA-15-KP.
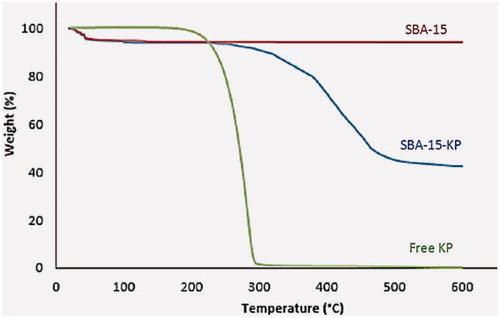
Table 3. Quantification of the amount of KP loaded into SBA-15 by TGA and extraction.
HRTEM results for free and loaded SBA-15 are shown in . Clearly, both the samples had a characteristic uniform hexagonal array structure. presents the SAXRD pattern of KP, SBA-15 and SBA-15 KP. KP diffraction pattern showed no diffraction peaks at 2θ range of 0.60–10.00°. Free SBA-15 exhibited three well-resolved diffraction peaks at 2θ = 0.84, 1.55 and 1.74°, indexed as the (1 0 0), (1 1 0) and (2 0 0) reflections, typical for SBA-15 materials (Zhao et al., Citation1998; Li et al., Citation2004; Wu et al., Citation2004). The corresponding d spacing was 95, 55 and 47.7 Å, respectively giving lattice constant of ao = 109 Å as shown in . Regarding SBA-15-KP diffraction patterns; showing well-defined peaks in the 2θ range of 0.8–3°. However, the intensity of diffraction peaks became weaker and shifting to higher degrees. Meanwhile, the d spacing related to the (1 0 0) diffraction peak was calculated and it gave a corresponding lattice constant of 109 Å.
Figure 2. HRTEM images of SBA-15 (left image) and SBA-15-KP (right image).
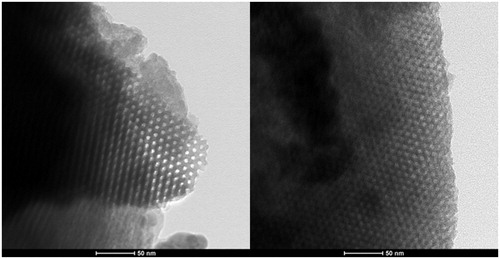
Figure 3. SAXRD patterns of Ketoprofen, SBA-15 and SBA-15-KP.
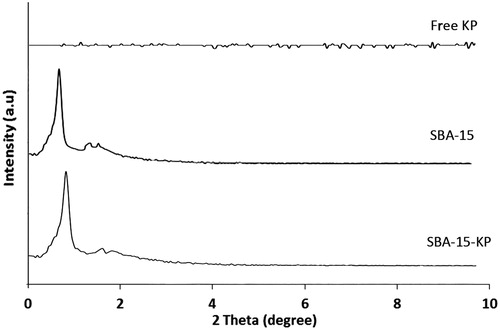
Table 4. Structural and textural parameters of free and loaded SBA-15.
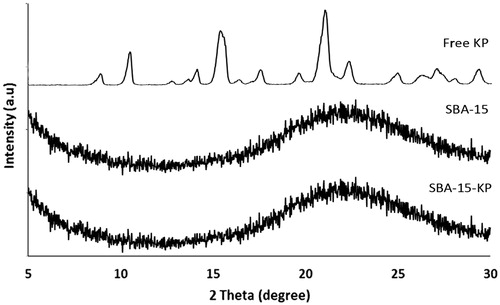
The X-ray diffraction for KP, SBA-15 and SBA-15-KP is shown in . The X-ray diffractogram of KP revealed its crystalline nature. KP diffractogram showed its characteristic peaks at 2θ diffraction angle located at 14.385, 18.332 and 22.824 °. SBA-15 diffraction pattern, showed its characteristic amorphous peak corresponding to the amorphous silica (Musić et al., Citation2011). X-ray diffractograms of SBA-15-KP exhibited no peaks corresponding to the drug.
Figure 4. X-ray diffractogram of Ketoprofen, SBA-15 and SBA-15-KP.
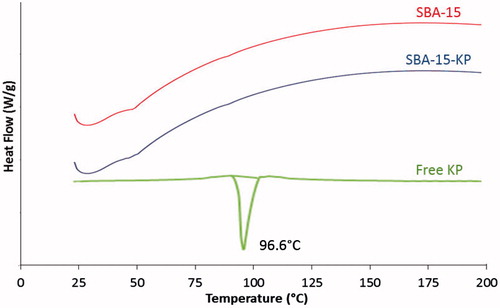
DSC curves illustrated in shows that free KP had an endothermic peak at 96.6 °C, while unloaded SBA-15 showed no sharp endothermic peaks, which proves its amorphous nature. In the meantime, it showed a broad peak corresponding to physically adsorbed water as observed in the TGA curve. On the other hand, SBA-15-KP thermogram revealed complete disappearance of the characteristic endothermic peak of KP.
Figure 5. DSC thermograms of Ketoprofen, SBA-15 and SBA-15-KP.
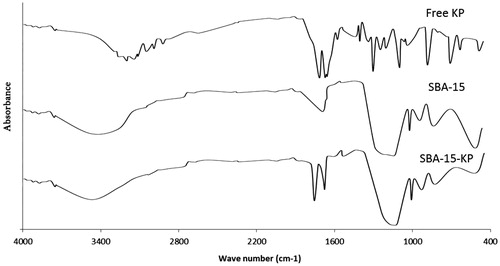
FT-IR of KP, SBA-15 and SBA-15-KP is shown in . KP spectrum showed a broad band at 3200–2500 cm−1 due to O–H stretching and at 2970, 2930 cm−1 due to C–H stretching of the methyl group. Moreover, there was a stretching band at 1695 cm−1 due to C=O stretching vibration of the carboxylic group. Finally, there were different peaks in the fingerprint region below 1500 cm−1 that confirmed the racemic form of the drug (Liversidge, Citation1981). As for the unloaded SBA-15 spectrum, there were broad bands of absorption at around 3450 cm−1 corresponding to molecular water hydrogen bonded to each other and to Si–OH groups, they can be assigned to stretching vibrations of O–H and Si–OH bonds. The bands at around 1620 cm−1 related to bending vibrations of O–H bonds in OH groups, overlapped with C–O–C stretching vibrations. The bands at around 1080 cm−1 is due to asymmetrical stretching vibrations of Si–O–Si, overlapped with Si–O–C, C–O–C and Si–C bond vibrations. The bands in 980–950 cm−1 referred to stretching vibrations of free silanol (Si–OH) groups on the surface of the amorphous solid samples also, C–O stretching vibration bonds were placed in this range. Symmetrical stretching vibrations of Si–O–Si bonds belonging to ring structures were observed around 795–790 cm−1. The bands in 480–460 cm−1 could be assigned to associate Si–O–Si bond bending vibrations (Azimov et al., Citation2012). Regarding the FT-IR spectra of SBA-15-KP sample, it was clear that the characteristic peaks of SBA-15 were maintained. In addition, no characteristic peaks corresponding to KP were observed meanwhile, a new peak appeared nearly at 1730 cm−1.
Figure 6. FT-IR Spectra of Ketoprofen, SBA-15 and SBA-15-KP.
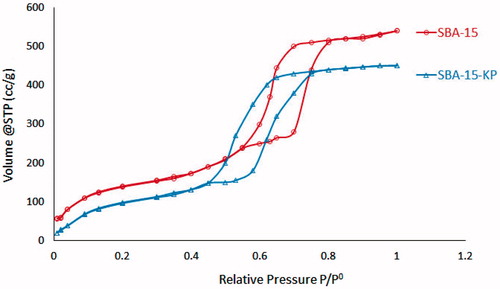
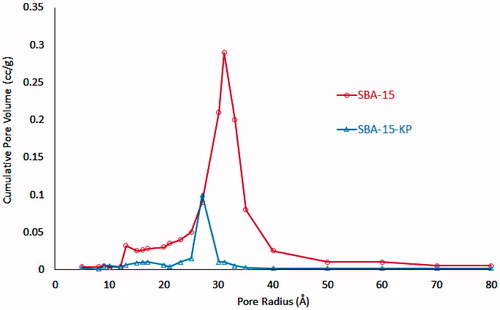
Nitrogen ads/des results for free and loaded SBA-15 are shown in and . SBA-15 isotherm showed the typical IV isotherms, characteristic for mesoporous molecular sieves (Zhao et al., Citation2013) with H1 hysteresis loop. Subsequently, the capillary condensation step occurred in the range between 0.6 and 0.8 relative pressures. Similarly, SBA-15-KP sample exhibited type IV isotherm with H1 hysteresis loop. Meanwhile, the capillary condensation pressures decreased. Hence, the adsorption/desorption isotherm branches shifted toward lower pressure. Moreover, the results obtained from calculating specific surface area (m2/g) pore diameters and total pore volumes (cc/g) for the free and loaded SBA-15 showed that the value of these parameters were reduced in the loaded sample.
Figure 7. Adsorption/desorption isotherms of SBA-15 and SBA-15-KP.
In vitro dissolution study
The dissolution profiles of plain KP and SBA-15-KP are shown in . 0.1 N HCl media was selected as the dissolution media as it is well-known that comparative dissolution studies at low pH especially 1.2, are more discriminating with respect to solubility-enhancing formulation approaches than at higher pH values (Shohin et al., Citation2012). It was clear that the dissolution of the KP that is in amorphous state inside the SBA-15 pores was very rapid compared to the plain crystalline KP. During the first 5 min, the release rate of KP from SBA-15 was very fast and nearly 50% of KP was dissolved, while for plain KP it took 120 min to reach 45%. The maximum percentage of KP dissolved from free KP was about 45% after 120 min, while maximum percentage of KP released and dissolved from the loaded SBA-15 was 98% after 105 min. It was important to estimate the extent of difference or similarity between the release profiles under investigation. If both the test and reference (plain KP) show more than 85% dissolution within 15 min, the profiles are considered similar if not, as in our case, dissolution profiles comparison must be done (Sharma & Jain, Citation2012). Thus, the difference factor f1 and the similarity factor f2 of the loaded KP were calculated compared to the free KP. The f1 and f2 values were 307.25 and 9.37, respectively. To study the release mechanism of KP from SBA-15 four models were used, which are first order, the Higuchi, the Korsmeyer–Peppas and the Weibull. The statistical criteria used for evaluating the goodness of fit of each model were the coefficient of determination (R2) and the Akaike Information Criterion (AIC). As shown in , the best fitting model was the Weibull model.
Figure 8. Dissolution profile of Ketoprofen and SBA-15-KP.
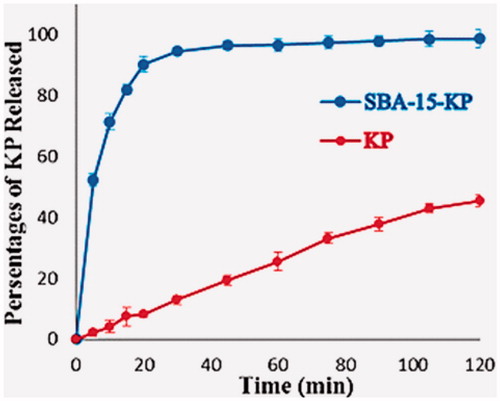
Table 5. Release mechanism of KP from SBA-15.
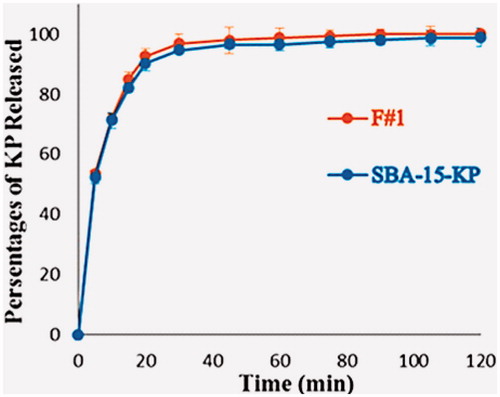
As our goal was to study the effect of incorporating KP into SBA-15, the loaded sample was formulated in hard gelatin capsules. depict the dissolution of F#1 compared to the dissolution of the SBA-15-KP. It was clear that the dissolution rate of KP from F#1 showed little improvement when compared to the loaded sample. Clearly, by calculating f1 and f2 values 2.03 and 84.52, respectively it was evident that the percentages of KP released from SBA-15-KP and the F#1 were pharmaceutically equivalent.
Figure 10. Pore size distribution of SBA-15 and SBA-15-KP.
In vivo studies
shows the anti-inflammatory results, it is clear that the carrier SBA-15 did not have anti-inflammatory effect; the percentage inhibition did not exceed 7% when compared to the control. On the other hand, the prepared formula F#1 after half an hour showed percentage change of 7% in edema and 85% in inhibition. As for the tested reference (Ketofan®) after half an hour, it showed percentage change of 27% and 44% in edema volume and percentage of inhibition, respectively. Nearly the same results were achieved after 1 h, where the formula had a percentage inhibition of 82% in edema, while the standard reference showed 52%. The maximum anti-inflammatory effect of Ketofan® was attained after 2 h, whereas F#1 had maximum anti-inflammatory effect after half an hour. At the end of the experiment, both the formula and the reference showed percentage inhibition of 59% and 48%, respectively. The statistical results showed that the carrier had no significant differences when compared to the control. On the other hand, on comparing the percentage change in edema volume between F#1 and Ketofan® after 30 and 60 min from carrageenan injection, a very high significant difference was found. Finally, after 2 h till the end of the experiment the statistical results showed no significant differences between the comparable treatments.
Table 6. Ant-inflammatory activity results.
The central analgesic activity was evaluated using hot plate method; the results are shown in . Regarding the carrier, it did not show any analgesic activity throughout the whole experiment. F#1 caused maximum analgesia (increase threshold potential of pain) only after 30 min from its administration, while the highest analgesic effect caused by Ketofan® appeared after 120 min.
Table 7. Central analgesic activity results.
These results reflected on the statistical analysis outcomes; the carrier showed no significant differences when compared to the control. On the other hand, on comparing F#1 with Ketofan® after 30, 60 and 90 min from the administration, there was a very high significant difference in their mean reaction time. Finally, at 120 min (the end of the experiment) the statistical results showed no significant differences between the formula and Ketofan®.
Discussion
In the current study, we used a novel method in loading KP into SBA-15 namely immersion rotavapor method. This method is a combination between two well-known methods for loading drugs into MSNs, which are immersion and rotavapor method. By combining these two methods, we beneficiated from the advantages and controlled the drawbacks of the two methods. The immersion method gives uniform loading inside the MSNs pores meanwhile it needs a very high concentration of the drug as well as stirring for about 24 h. It is known that drug diffusion as well as loading occurs during stirring of the particles in the concentrated drug solution hence, the stirring has to be maintained for 24 h (Limnell et al., Citation2011). On the other hand, in rotavapor method, the diffusion and loading occur mainly during evaporation of the solvent, resulting in a high concentration gradient of the drug. However, the main drawback is the uneven distribution of drug inside the pores (Limnell et al., Citation2011). Therefore, by combining the two methods, we managed to cut the loading time to about 2 h with a very high loading percentage and uniform distribution of KP inside SBA-15 pores. The successful loading and the uniform loading inside the SBA-15 pores with no evidence of surface adsorbed drug particles and no disruption to the SBA-15 structure was clearly reflected on the characterization results.
In the TGA results, free KP had sharp decline at 223 °C with endset at 290 °C causing 99.68% weight loss. On the other hand, the decomposition behavior of the loaded KP sample revealed that the decomposition was nearly by the same rate over the temperature ranging from 240 to 560 °C. This referred to the uniform distribution of KP inside SBA-15 pores. Consequently, the decomposition of KP over extended temperature range would assert the successful loading of KP into SBA-15. Furthermore, the evaporation temperature for the loaded KP was increased and extended compared to the free substance. This phenomenon could be explained by capillary forces in the pores, as has been stated by Peng Zhang et al (Zhang et al., Citation2014).
Another important observation was that TGA and extraction results were in a very good agreement, which strongly imply that during the decomposition of a drug no interactions occurred between decomposed drug substances and the carrier. It is known that if the interactions occurred at TGA measurements could give underestimated drug loading values (Salonen et al., Citation2005). Therefore, as the TGA and extraction results were very close, the average wt% for the loaded sample was calculated from both the results.
HRTEM results asserted the successful loading of KP inside the SBA-15 without affecting its internal structure where the free and loaded SBA-15 had ordered two-dimensional channel mesostructure as well as mesoporous highly ordered honeycomb array structure (Nhu et al., Citation2010). This was further confirmed by the SAXRD results, it was clear that the hexagonal pore arrangement was not affected by drug loading showing well-defined peaks in the 2θ range of 0.8 to 3°. In addition, by calculating the d spacing related to the (1 0 0) diffraction peak and its corresponding lattice constant, it was clear that no cell parameter changes occurred after KP incorporation into the SBA-15 (Zhao et al., Citation2013). Consequently, the SAXRD confirmed the successful loading by showing reduction in the peak intensities of the loaded sample with shifting to higher degrees. This pointed to the decrease in pore channels diameter associated with drug incorporation (Jusoh et al., Citation2013).
The nitrogen ads/des results showing that both the free and loaded SBA-15 exhibited typical IV isotherms with H1 hysteresis loop added more conformation for the successful loading of KP with no evidence of MSNs disruption. Moreover, SBA-15 isotherm that showed step position at high relative pressures pointing to the presence of large pore sizes (above 5 nm) (Cao & Kruk, Citation2014). In addition, the sharpness of the adsorption branches (located at a relative pressure from 0.6 to 0.8) indicates a narrow mesopore sizes distribution characteristic for a good quality SBA-15 (Wang et al., Citation2013). This was also confirmed by the pore size distribution curve and pore diameters distribution range shown in and depicted in . As for the loaded sample, a clear decrease in the capillary condensation pressures was observed. This reduction was due to loading of KP inside SBA-15 pores (Fu et al., Citation2012), which was associated with the reduction in the pore diameter. However, KP encapsulated inside the pores do not fully occupy the available space, such that there was still available space for nitrogen gas to adsorb inside the pores.
Figure 9. Dssolution profile of SBA-15-KP and F#1.
The FT-IR results indicated that loading of KP did not affect the mesoporous chemical structure. However, a new peak appeared that arises from hydrogen bonding of Si–OH (silanol group) with the COOH (carboxyl group) of KP (Song et al., Citation2005). Consequently, this peak confirmed the successful loading of KP into SBA-15 pores (Song et al., Citation2005).
The X-ray diffraction and DSC results, which showed complete disappearance of any peaks related to KP, pointed to two important aspects. First, the successful encapsulation of KP into the carrier pores in a molecular amorphous state. Second, no surface-adsorbed drug particles occurred.
The presence of KP in amorphous state, the large surface area and the appropriate pore diameters provided by SBA-15 have reflected clearly on the dissolution profile of the loaded KP sample, where nearly 90% of the drug dissolved after 20 min. For further analysis of the dissolution results, the difference factor f1 and the similarity factor f2 was estimated. The high degree of difference between the free and loaded KP asserted the prominent effect of loading KP into SBA-15 on its dissolution rate. In order to study the release mechanism, the goodness of fit of each model was determined by the coefficient of determination (R2) and the Akaike Information Criterion (AIC). For more precise studying of the dissolution results, the Weibull model parameters were calculated. The Weibull model parameters include the scale factor α that relates to the time scale of the process, parameter β which describes the shape of the profile either exponential (β = 1; case 1), sigmoid (β > 1; case 2) or parabolic with a higher initial slope compared to the exponential (β < 1; case 3) (Adams et al., Citation2002) and Td that is defined by α = (Td) β. Td represents the time interval needed to dissolve 63.2% of the drug (Costa & Sousa Lobo, Citation2001). Regarding the parameter β, it was found that the loaded sample releasing profiles was of the parabolic type; case 3 i.e (β < 1) while the plain drug exhibited sigmoid-shaped curve; case 2 i.e (β > 1). As for the time scale α and Td parameters, the general decrease in their values in case of SBA-15-KP would point to the very fast dissolution rates of the loaded KP. On the other hand, the results obtained from the dissolution profile of the F#1 when compared to the loaded sample did not show a significant improvement in the dissolution rates. This was very evident when similarity and difference factors were calculated. This would indicate that the presence of different excipients did not affect the release rate of KP. Meanwhile, the rate of drug release was solely affected by its amorphous state inside the SBA-15 pores as well as the pore diameter of the SBA-15.
The very fast release rates of KP from SBA-15 had reflected on its onset of action as clearly observed in the in vivo study. The F#1 should have maximum anti-inflammatory and analgesic effect after 30 min from the beginning of the experiments. This result was in a very good agreement with the dissolution results, where almost 96% of the formula was released after 30 min from the beginning of the dissolution experiment.
Conclusion
SBA-15 was studied as a drug delivery carrier for KP in order to improve its bioavailability. The results elucidated the influence of loading KP into SBA-15 on improving its bioavailability based on both the in vitro and in vivo studies. Our current work established a new way to improve the bioavailability of poorly water-soluble drugs, opening a new avenue for the utilization of SBA-15 in drug delivery system.
Declaration of interest
The authors declare that there is no conflict of interest for this work. The authors alone are responsible for the content and writing of this article.
Acknowledgements
The authors would like to thank Prof. Dr. El-Zeiny M. Ebeid of Tanta University and MUST University, for helping in mesoporous silicate synthesis.
References
- Adams E, Coomans D, Smeyers-Verbeke J, Massart DL. (2002). Non-linear mixed effects models for the evaluation of dissolution profiles. Int J Pharm 240:37–53
- Azimov F, Markova I, Stefanova V, Sharipov K. (2012). Synthesis and characterization of SBA-15 and Ti-SBA-15 nanoporous materials for Dme catalysts. J Univ Chem Tech Metallurgy 47:333–40
- Bahl D, Bogner RH. (2006). Amorphization of indomethacin by co-grinding with neusilin US2: amorphization kinetics, physical stability and mechanism. Pharmaceut Res 23:2317–25
- Barrett E, Joyner L, Halenda P. (1951). The determination of pore volume and area distributions in porous substances. I. computations from nitrogen isotherms. J Am Chem Soc 73:373–80
- Cao L, Kruk M. (2014). Short synthesis of ordered silicas with very large mesopores. R Soc Chem Adv 4:331–9
- Carnero A. (2006). High throughput screening in drug discovery. Clin Transl Oncol 8:482–90
- Costa P, Sousa Lobo JM. (2001). Modeling and comparison of dissolution profiles. Eur J Pharm Sci 13:123–33
- de Boer JH, Lippens BC, Linsen BG, et al. (1966). Thet-curve of multimolecular N2-adsorption. J Colloid Interface Sci 21:405–14
- Fagerlund G. (1973). Determination of specific surface by the BET method. Mat Constr 6:239–45
- Fu T, Lu J, Guo L, et al. (2012). Improving bioavailability of silybin by inclusion into SBA-15 mesoporous silica materials. J Nanosci Nanotechnol 12:3997–4006
- He Q, Shi J, Zhao J, et al. (2009). Bottom-up tailoring of nonionic surfactant-templated mesoporous silica nanomaterials by a novel composite liquid crystal templating mechanism. J Mater Chem 19:6498–503
- Jusoh NWC, Jalil AA, Triwahyono S, et al. (2013). Sequential desilication–isomorphous substitution route to prepare mesostructured silica nanoparticles loaded with ZnO and their photocatalytic activity. Appl Catalysis A 468:276–87
- Kwon S, Singh RK, Perez RA, et al. (2013). Silica-based mesoporous nanoparticles for controlled drug delivery. J Tissue Eng 4:1–18
- Li Y, Zhang W, Zhang L, et al. (2004). Direct synthesis of Al − SBA-15 mesoporous materials via hydrolysis-controlled approach. J Phys Chem B 108:9739–44
- Limnell T, Santos HA, Makila E, et al. (2011). Drug delivery formulations of ordered and nonordered mesoporous silica: comparison of three drug loading methods. J Pharmaceut Sci 100:3294–306
- Liversidge G. (1981) Ketoprofen in: analytical profiles of drug substances. In: Florey K. ed. London, UK: Academic Press, 443–71
- Lopes SM, Alexandre K, Souza M. d, et al. (2013). Synthesis and characterization of ordered mesoporous silica (SBA-15 and SBA-16) for adsorption of biomolecules. Micropor Mesopor Mater 180:284–92
- Marzouqa D, Zughul M, Taha M, Hodali H. (2012). Effect of particle morphology and pore size on the release kinetics of ephedrine from mesoporous MCM-41 materials. J Por Mater. 19:825–33
- Mellaerts R, Aerts CA, Humbeeck JV, et al. (2007). Enhanced release of itraconazole from ordered mesoporous SBA-15 silica materials. Chem Commun (13):1375–7
- Musić S, Filipović-Vinceković N, Sekovanić L. (2011). Precipitation of amorphous SiO2 particles and their properties. Braz J Chem Eng 28:89–94
- Nhu TT, Thi N, Trong PD. (2010). Study on the characteristics and catalytic properties of Pt/SBA-15 in the selective oxidation of D-Glucose. J Sci Nat Sci Technol 26:183–90
- Safari J, Zarnegar Z. (2014). Advanced drug delivery systems: nanotechnology of health design a review. J Saudi Chem Soc 18:85–99
- Salazar J, Müller R, Möschwitzer J. (2014). Combinative particle size reduction technologies for the production of drug nanocrystals. J Pharmaceut 2014:14
- Salonen J, Laitinen L, Kaukonen AM, et al. (2005). Mesoporous silicon microparticles for oral drug delivery: loading and release of five model drugs. J Control Release 108:362–74
- Sharma MP, Jain S. (2012). Dissolution specifications, dissolution profiling and dissolution profiles comparison methods. Int J Drug Res Technol 2:297–305
- Shohin IE, Kulinich JI, Ramenskaya GV, et al. (2012). Biowaiver monographs for immediate-release solid oral dosage forms: ketoprofen. J Pharmaceut Sci 101:3593–603
- Song SW, Hidajat K, Kawi S. (2005). Functionalized SBA-15 materials as carriers for controlled drug delivery: influence of surface properties on matrix-drug interactions. Langmuir 21:9568–75
- Turner R. (1965) Screening methods in pharmacology. New York: Academic press
- Vallet-Regi M. (2010). Nanostructured mesoporous silica matrices in nanomedicine. J Intern Med 267:22–43
- Vallet-Regi M, Rámila A, del Real RP, Pérez-Pariente J. (2001). A new property of MCM-41: drug delivery system. Chem Mater 13:308–11
- Van Speybroeck M, Barillaro V, Thi TD, et al. (2009). Ordered mesoporous silica material SBA-15: a broad-spectrum formulation platform for poorly soluble drugs. J Pharmaceut Sci 98:2648–58
- Wang Y, Zhao Q, Hu Y, et al. (2013). Ordered nanoporous silica as carriers for improved delivery of water insoluble drugs: a comparative study between three dimensional and two dimensional macroporous silica. Int J Nanomed 8:4015–31
- Wang Z, Chen B, Quan G, et al. (2012). Increasing the oral bioavailability of poorly water-soluble carbamazepine using immediate-release pellets supported on SBA-15 mesoporous silica. Int J Nanomed 7:5807–18
- Wani TA, Kumar D, Prasad R, et al. (2012). Analgesic activity of the ethanolic extract of Shorea robusta resin in experimental animals. Indian J Pharmacol 44:493–9
- Williams HD, Trevaskis NL, Charman, SA, et al. (2013). Strategies to address low drug solubility in discovery and development. Pharmacol Rev 65:315–499
- Winter A, Risley A, Nuss W. (1962). Carrageenin-induced edema in hind paw of the rat as an assay for antiiflammatory drugs. Proc Soc Exp Biol Med 111:544–7
- Wu S, Han Y, Zou YC, et al. (2004). Synthesis of heteroatom substituted SBA-15 by the pH-adjusting method. Chem Mater 16:486–92
- Zhang P, Forsgren J, Strømme M. (2014). Stabilisation of amorphous ibuprofen in Upsalite, a mesoporous magnesium carbonate, as an approach to increasing the aqueous solubility of poorly soluble drugs. Int J Pharmaceut 472:185–91
- Zhao D, Feng J, Huo Q, et al. (1998). Triblock copolymer syntheses of mesoporous silica with periodic 50 to 300 angstrom pores. Science 279:548–52
- Zhao D, Wan Y, Zhou W. (2013) Ordered mesoporous materials. New York: John Wiley & Sons
- Zhu JL, He J, He H, et al. (2011). Study on the interaction between ketoprofen and bovine serum albumin by molecular simulation and spectroscopic methods. Spectroscopy 26:337–48