
Abstract
Nanoparticles (NPs) can be absorbed via M cells of Peyer’s patches after oral delivery leading to passive lymphatic targeting followed by systemic drug delivery. Hence, the study was aimed to formulate PLGA NPs of lopinavir. The NPs were prepared by nanoprecipitation, optimized by 33 factorial design and characterized by TEM, DSC, FTIR studies and safety was assessed by MTT assay. In vivo pharmacokinetic studies were performed in rats. The NPs were discrete spherical structures having particle size of 142.1 ± 2.13 nm and entrapment of 93.03 ± 1.27%. There was absence of drug-polymer interaction. Confocal images revealed the penetration and absorption of coumarin-loaded NPs in Caco-2 cells and intestine after oral delivery. There was 3.04 folds permeability and 13.9 folds bioavailability enhancement from NPs. The NPs can be promising delivery system for antiretroviral drug by delivering the drug to lymph (major HIV reservoir site) via direct absorption through intestine before reaching systemic circulation.
Introduction
HIV/AIDS is a global pandemic that become the leading infectious killer of adults worldwide and has caused tremendous social and economic damage worldwide, with developing countries heavily affected. The combination therapy; highly active antiretroviral therapy (HAART) can suppress the HIV replication below the limit of detection in peripheral blood. But it has issues like toxicity, insufficient efficacy, prolonged treatment and drug resistance. Moreover, most of antiretroviral drugs have poor solubility, permeability and stability; therefore their reduced bioavailability and short residence time at viral reservoir sites lead to resistance on discontinuation of therapy and inefficient eradication of virus. Therefore, HIV is able to reseed the systemic circulation and continue to propagate the infection (Mamo et al., Citation2010; Aji Alex et al., Citation2011). Furthermore, it is difficult to maintain adequate drug levels in the lymphoid tissue which is a major site for storage and replication of virus (Vyas et al., Citation2006). Main anatomical reservoir sites of HIV include the lymphoid organs (particularly, the spleen, lymph nodes, and gut-associated lymphoid tissues (GALT)) and the central nervous system (CNS) where HIV persists and replicates even after (HAART) (Macal et al., Citation2008).
Nanoparticles (NPs) are colloidal drug carriers of nanosize; which can be targeted to GALT to deliver high loads of drug to lymphatic tissue before reaching the systemic circulation (Chaudhary et al., Citation2014; Joshi et al., Citation2014; Jaidev et al., Citation2015). NPs are taken up intact by M cells of Peyer’s patches in the intestine-associated lymphoid tissue (Florence & Jani, Citation1993; Pukanud et al., Citation2009; Kaur et al., Citation2015). M cells can deliver the particles taken up to the lymphatics, in a size-dependent manner, from where they are released into the bloodstream (Bharadwaj, Citation2006; Garinot et al., Citation2007; Liu et al., Citation2015). Furthermore, NPs have the ability to circumvent the P-glycoprotein efflux pump which is present on the membranes of HIV reservoir cells as well as intestinal epithelial cells (Zhang et al., Citation2013). This in turn, increases the absorption as well as target the antiretroviral drug to HIV reservoir sites (Soni & Yadav, Citation2015).
Various nanotechnology-based systems are studied extensively by scientists to address the specific issues associated with antiretroviral therapy (Govender et al., Citation2008). Polymeric NPs-containing antiretroviral drugs can overcome the drawback of physiological stability as well as drug loading.
Lopinavir is a leading component in combined chemotherapy; (HAART) (Patel et al., Citation2016). It is a potent protease inhibitor but has poor oral bioavailability due to poor solubility as well as extensive first-pass metabolism, primarily mediated by cytochrome P450 and limited intestinal uptake due to P-glycoprotein efflux. Moreover, lopinavir is always coadministered with ritonavir which inhibits the cytochrome P450 enzyme which is responsible for extensive first-pass metabolism (Prot et al., Citation2006).
Hence, the present study was aimed to design PLGA-based NPs of lopinavir, which would be capable of absorption through intestinal epithelium reaching to GALT and HIV virus reservoir site in the lymph and from mesenteric lymph node to thoracic duct, thereby avoiding the first-pass effect. By designing PLGA NPs three objectives would be achieved; first, the drug would reach to lymphatic viral reservoir sites before reaching systemic circulation, therefore resistance and cytotoxicity would be overcome; secondly, NPs would be capable of bypassing P-glycoprotein efflux, thereby enhancing the drug absorption. Lastly, bioavailability would be enhanced by avoiding the hepatic first pass which is responsible for low bioavailability due to cytochrome P450. Therefore, there would be no need for coadministration of ritonavir with lopinavir.
Materials and methods
Materials
Lopinavir was obtained as a gift sample from Aurobindo Pharmaceuticals, Hyderabad, India. Poly (lactide-co-glycolide) PLGA (50:50) (inherent viscosity 0.2 dl/g) was gift sample from Purac Biomaterials, The Netherlands. Pluronic F 68 was obtained as gift sample from BASF, Germany. Brij 35 was purchased from Sigma Aldrich, Germany. Caco-2 cells were obtained from National Centre for cell line studies (NCCS), Pune, India. DMEM medium, penicillin–streptomycin solution, Trypsin-EDTA solution, fetal bovine serum (FBS) and Hank’s balanced salt solution (HBSS) were purchased from Himedia, Mumbai, India. All other chemicals used were of analytical grade. The 24-well Transwell inserts were purchased from Nunc, Roskilde, Denmark. The 6-, 24- and 96-well plates were purchased from Costar Corning, NY, USA. MTT assay dye was purchased from Himedia, Mumbai, India.
Formulation of lopinavir-loaded PLGA NPs
NPs were prepared using solvent diffusion (nanoprecipitation) method (Fessi et al., Citation1989). The NPs were prepared by dissolving PLGA (25 mg) and drug (15 mg) in 2.5 ml of acetone. The organic phase was added at the rate of 0.5 ml/min into 5 ml of aqueous phase containing 0.25% w/v Pluronic F68 with continuous stirring on magnetic stirrer at room temperature (Shah et al., Citation2014). Stirring was continued until the complete evaporation of organic solvent. The NPs suspension was centrifuged at 25 000 g for 30 min at 4 °C (3K30, Sigma Centrifuge, Osterode, Germany), supernatant was alienated and NPs were collected. Nanoparticle suspension was lyophilized using sucrose as cryoprotectant (1:1).
Characterization
Transmission electron microscope (TEM) studies
A sample of NPs (0.5 mg/ml) was suspended in water and bath sonicated for 30 s. Two microliters of this suspension was placed over a formvar-coated copper TEM grid and negatively stained with 2 μl uranyl acetate (1%) for 10 min, allowed to dry and the images were visualized at 80 kV under TEM (Philip Tecnai 20, USA).
Differential scanning calorimetric (DSC) and fourier transform infra red (FTIR) studies
DSC (model 2910 Shimadzu, Kyoto, Japan) and FTIR (Bruker optics, Liepzig, Germany) studies on pure lopinavir, PLGA, physical mixtures of lopinavir:PLGA (1:1) and lopinavir-loaded NPs were performed in order to characterize the physical state of drug in the NPs and to detect the possibilities of interactions.
In vitro cell line studies
Cell culture
Caco-2 cells (NCCS, Pune, India) of passages between 33 and 40 were used as in vitro gastrointestinal barrier for absorption. Caco-2 cells were cultured in 25 cm2 tissue culture flasks. Dulbecco’s MEM medium with 1.5 mM L-glutamine, supplemented with 20% FBS, 1 mM sodium pyruvate, 1.5 g/L of sodium bicarbonate and 1% penicillin–streptomycin solution was used as culture medium. Cells were seeded on 24-well plates with transparent bottom (Costar Corning, NY, USA) for quantitative uptake experiments and on 6-well plates with cover slips for confocal microscopy. Cells were cultured as a monolayer at 37 °C in a humidified atmosphere containing 5% CO2 and medium was replenished every alternate day (Zhou et al., Citation2005). 6-Coumarin was used as a model fluorescent marker. As lopinavir and coumarin are lipophilic, it was assumed that it will be entrapped within NPs similar to lopinavir. 6-Coumarin-loaded PLGA NPs were prepared by nanoprecipitation method mentioned earlier for the formulation of lopinavir-loaded NPs by replacing half of the drug with 6-coumarin (Katerinopoulos, Citation2004; Dong & Feng, Citation2005; Rivolta et al., Citation2011).
NPs uptake by Caco-2 cells
Qualitative uptake of NPs in Caco-2 cells by confocal microscopy
Caco-2 cells were seeded on round cover slips in 6-well plates (Costar Corning, NY, USA) for 24 h. On reaching 80% confluence, the culture medium was replaced with HBSS. After 30 min of incubation at 37 °C, cell monolayers were washed three times with HBSS for 5 min at 37 °C. The cells were incubated with 100 μl of 100 μg/ml 6-coumarin solution and 6-coumarin-loaded PLGA NPs. To investigate the time-dependent uptake, cells were incubated with NPs and plain dye solution for 1 , 2 and 4 h. Then, cell monolayers were fixed with 70% ethanol solution for 20 min and rinsed with 1 × HBSS. After rinsing, the nuclei were counterstained with DAPI for 3 min and rinsed again with 1 × HBSS, mounted in glycerol and localization of dye-loaded NPs in cells was observed using Carl Zeiss confocal laser microscope (LSM 710, Obercohen, Germany) at (6-coumarin: λex 430 λem 485 nm Green fluorescence) and DAPI: λex 350 λem 470 (Blue fluorescence)). The images were analyzed by Zen imaging software (Cartiera et al., Citation2009).
Quantitative cellular uptake by flow cytometry
The 6-well plate was seeded with 1 × 10⁵ Caco-2 cells and allowed to attach and grow. After 24 h, the cells were incubated with 1 ml of medium containing 100 μg/ml 6-coumarin and 6-coumarin-loaded PLGA NPs for 1 , 2 and 4 h. Cells treated with only medium were used as respective controls. At the end of the incubation period, the cell monolayer was washed three times with cold 1 × PBS to eliminate excess of dye or NPs, which were not taken up by the cells and then trypsinized. Cells were collected by centrifugation at 400 g (Sigma Centrifuge, Osterode, Germany) and analyzed in FACS (FACS Canto-II, BD Biosciences, San Jose, CA) using software provided with the instrument (BD FACS Diva 6.1.3 software, BD Biosciences, San Jose, CA) for total amount of NPs uptake by 10 000 cells.
Transport/permeability across human intestinal epithelial cells (Caco-2 cells)
Caco-2 cells at passage 39–45 cultured in Transwell® inserts (12565009, Nunc, Rosalinde, Denmark) (0.4 μ pore diameter, 1.13cm2 area) were used for transport experiments after 21 days post seeding. Prior to the experiment, the inserts were washed twice and equilibrated for 30 min with pre-warmed transport medium, HBSS, containing 25 mM of HEPES, pH 7.4. As Lopinavir is lipophilic, DMSO (1%) in transport buffer was used as co solvent. The integrity of the monolayers was checked by monitoring the permeability of the paracellular leakage marker, lucifer yellow, across the monolayers. The cell monolayers were considered tight enough for the transport experiments when the apparent permeability coefficient (Papp) for lucifer yellow was less than 0.5 × 10⁻⁶ cm/s. All transport studies were conducted at 37 °C. The transport buffer containing 150 μl test compounds was added on the apical (0.5 ml) side while the basolateral side of the inserts contained 1.5 ml volume of transport buffer. The concentrations of the test compounds in the transport medium were immediately analyzed by a HPLC method as described earlier (Ina Hubatsch, Citation2007). The apical-to-basolateral permeability coefficient (Papp in centimeters per second) was calculated according to following equation:
where dQ/dt – the amount of NPs/drug in basolateral compartment as a function of time (mg/min), A – the monolayer area (cm2), C0 – the initial concentration of NPs/drug in apical compartment (mg/mL) (Senanayake et al., Citation2013). Here, the initial drug concentration was 0.2 mg/ml, area was 1.13 cm2.
Cytotoxicity studies (MTT assay)
The in vitro cytotoxicity of lopinavir-loaded NPs and plain lopinavir suspension was evaluated for Caco-2 cells using the MTT assay. The cells were cultured in 96-well plates at a seeding density of 1.0 × 10⁴ cells/well for 48 h. Lopinavir was diluted with DMEM culture medium to different concentrations. Experiments were initiated by replacing the culture medium in each well with 150 μl of sample solutions (0.1, 1, 10, 100 and 200 μg/ml) at 37 °C in the CO2 incubator. After 4, 24 and 48 h of incubation, the medium was removed and 150 μl of MTT reagent (1 mg/ml) in the serum-free medium was added to each well. The plates were then incubated at 37 °C for another 4 h. At the end of the incubation period, the medium was removed and the intracellular formazan was solubilized with 150 μl DMSO and quantified by reading the absorbance at 590 nm on a micro-plate multi-detection instrument, SpectraMax M2 with Soft Max® Pro (Molecular Devices Corporation Sunnyvale, CA). The medium-treated cells were used as controls. Percentage of cell viability was calculated based on the absorbance measured relative to the absorbance of cells exposed to the negative control (Mosmann, Citation1983).
In vivo studies
Animals
Male Wistar rats weighing 250 ± 20 g were used for oral bioavailability studies and for intestinal lymphatic transport studies. Animals were housed in propylene cages (38 cm × 23 cm × 10 cm) under laboratory conditions of controlled environment of temperature 30 ± 2 °C and 60 ± 5% RH. Three rats per cage were fed ad libitum with animal feed allowing free access to drinking water. Animals were fasted overnight. All surgical and experimental procedures were reviewed and approved by the Animal Ethics Committee of Department of Pharmacy, M S University of Baroda, Vadodara, Gujarat, India. All animal experiments were approved by the Committee for the Purpose of Control and Supervision of Experiments on Animals (CPCSEA), Ministry of Social Justice and Empowerment, Government of India, New Delhi, India.
In vivo NPs uptake into rat intestinal tissue after oral delivery by confocal laser scanning microscopy
In vivo nanoparticle uptake studies in rat intestine after oral administration were performed to study the penetration and absorption of lopinavir-loaded NPs. For this purpose, 6-coumarin was used as hydrophobic model dye.
The dye-loaded NPs were administered orally to the rats with the aid of a syringe and infant feeding tube. After 2 h, the animals were sacrificed by euthanasia. Intestine was isolated and washed with HBSS. The isolated intestine tissue was fixed with 10% formalin for 4 h at 4 °C and then transferred to 30% sucrose in PBS solution for cryopreservation. Then, tissue was transferred to OCT compound for 1 h at 4 °C. Slices transverse to the intestinal surface, 10 μm in thickness, were cut from the ileum, included in the OCT Compound (Leica Microsystem srl, Milan, Italy), using a cryostat (Leica CM1510, Leica Microsystem srl, Milan, Italy) at −20 °C. Each slice was placed on a microscope slide, and mounted in glycerol, covered by cover glass and visualized in confocal microscope (Carl Zeiss, LSM 710, Obercohen, Germany) at (6-coumarin: λex 430 λem 485 nm Green fluorescence). The images were analyzed by Zen imaging software (Cartiera et al., Citation2009). Negative control image of transverse intestine section was taken without administration of fluorescent NPs.
In vivo pharmacokinetic studies
Three groups of male Wistar rats with each group containing six animals were subjected to single oral dose bioavailability study. The first group was given distilled water, the second group was given a suspension of lopinavir in 5% methylcellulose, and the third group received lopinavir loaded NPs. In second and third tested groups, lopinavir was administered at a dose of 10 mg/kg (Aji Alex et al., Citation2011). The formulations were administered orally with the aid of a syringe and infant feeding tube. Blood samples were drawn by retro-orbital venous plexus puncture with the aid of capillary tubes at 0.5, 2, 4, 8, 24, 48, 72, 96 h post oral dose. The samples were collected in heparinized Eppendorf tubes and centrifuged at 3400 rpm for 15 min, and plasma was collected and stored at −20 °C until analysis. To this, 200 μl of acetonitrile was added and vortexed for 5 min followed by centrifugation at 5000 rpm for 15 min. The organic phase was separated and evaporated under reduced pressure in a vacuum oven. The residue was dissolved in mobile phase solution (0.15 ml), vortexed for 1 min followed by centrifugation at 13 000 rpm for 5 min. Then, 20 μl of supernatant solution was injected in to the HPLC column. Lopinavir detection was performed at 210 nm, using X-Terra C18 analytical column.
Results and discussion
Optimization and characterization of NPs
Twenty seven batches of lopinavir-loaded PLGA NPs were prepared by 33 factorial design. Drug concentration, polymer concentration and surfactant concentration were the major independent factors selected on the basis of preliminary optimization. The coded and actual values of the formulation parameters are mentioned in . The particle size (PS) and entrapment efficiency (EE) obtained at various levels of three independent variables (X1, X2 and X3) were subjected to multiple regressions to yield second order polynomial equations (EquationEquation 1(1) and Equation2
(2) , full model). The main effects of X1, X2 and X3 represent the average result of changing one variable at a time from its low to high value. The interactions (X1X2, X1X3, X2X3 and X1X2X3) show how the PS and EE changes when two or more variables were simultaneously changed. The PS and EE of total 27 batches showed a wide variation from 126.6 ± 4.16 to 237.1 ± 1.37 nm and 21.03 ± 2.28 to 95.7 ± 2.43%, respectively ()
(1)
(2)
Table 1. Factorial design parameters and experimental conditions.
Table 2. Full factorial design layout of lopinavir loaded NPs showing the effect of independent variables X1 (Drug concentration), X2 (Polymer concentration) and X3 (surfactant concentration) on responses PS (Particle size) and EE (entrapment efficiency).
The significance of each coefficient of EquationEquations (1)(1) and Equation(2)
(2) were determined by Student’s t-test and p value. The larger the magnitude of the “t” value and the smaller the p value, the more significant is the corresponding coefficient ( and ) (Adinarayana & Ellaiah, Citation2002). Higher values of coefficients of X1, X2 and X3 for both PS and EE confirmed them as main contributing factors. Second-order main effect of X1 was significant for both PS and EE and interaction effect of X1 X2 was significant for EE. Small values of the coefficients of the terms X22, X32, X1X2, X2X3, X1X3 and X1X2X3 in EquationEquation (1)
(4) for PS and X22, X32, X2X3, X1X3 and X1X2X3 in EquationEquation (2)
(4) for EE respectively implied that all these terms were least contributing factors and not significant (p > 0.05) in the preparation of the lopinavir-loaded PLGA NPs (EquationEquations (3)
(3) and Equation(4)
(4) ).
Table 3. Model coefficients estimated by multiple regression analysis of PS for lopinavir-loaded NPs.
Table 4. Model coefficients estimated by multiple regression analysis of EE for lopinavir-loaded NPs.
Hence, least contributing factors were neglected from the full model and reduced polynomial Equationequations (Equations 3(3) and Equation4
(4) ), for PS and EE were generated
(3)
(4)
For particle size, coefficients of all the variables have positive sign meaning that all the variables had synergistic effect on particle size. Particle size increased with increase in polymer concentration due to higher viscosity of solution and more entrapment of drug inside the particles leading to bigger sized particles. Increase in particle size with surfactant concentration could be attributed to coating of surfactant on surface of PLGA. When the values of three independent variables were compared, highest values of coefficients were found for X1 for both the responses. Hence, drug concentration was considered as major contributing variable for EE and drug concentration and polymer concentration both were major contributing variables for PS of lopinavir-loaded NPs.
For EE, positive sign of coefficients of X1 and X2 shows that entrapment increased with increase in drug concentration and polymer concentration due to more availability of drug to get entrapped and more polymer quantity to entrap the drug. Negative sign of X3 showed a decrease in entrapment with increase in surfactant concentration, as higher surfactant concentration will solubilize drug in outer aqueous phase.
The results of ANOVA of the second-order polynomial equation of PS and EE are given in and , respectively. Since the calculated F value was less than the tabulated F value for EE and for PS (Bolton, Citation2004). It was concluded that the neglected terms did not significantly contribute in the prediction of EE and PS. Hence, F-Statistic of the results of ANOVA of full and reduced model justified the omission of nonsignificant terms of EquationEquations (1)(1) and Equation(2)
(2) . The goodness of fit of the model was checked by determination coefficient R2. The values of determination coefficients explain that variations above 86% were explained by the model. A higher value of the correlation coefficient (R) signifies excellent correlation between the independent variables.
Table 5. Analysis of variance (ANOVA) of full and reduced models for PS of lopinavir-loaded NPs.
Table 6. Analysis of variance (ANOVA) of full and reduced models for EE of lopinavir-loaded NPs.
Contour and response surface plots
For PS, at fixed level (−1) of X1, at all levels of X2 and X3, particle size of less than 160 nm could be achieved. At fixed level of X2, plot between X1 and X3 explains that X1 had major influence on particle size, but particle size of 140 nm could be achieved at less than 0.5 level of X1, at all levels of X3. At −1 level of X3, lower particle size could be achieved at lower levels of both the factors, as both the factors cause major influence on particle size ().
Figure 1. Contour plot showing the effect of (A) c X1 versus X2 (at −1 level of X3), (B) X2 versus X3 (at −1 level of X1), (C) X1 versus X3 (at −1 level of X2) on PS (D) X1 versus X2 (at −1 level of X3), (E) X2 versus X3 (at −1 level of X1), (F) X1 versus X3 (at −1 level of X2) on EE of lopinavir-loaded NPs.
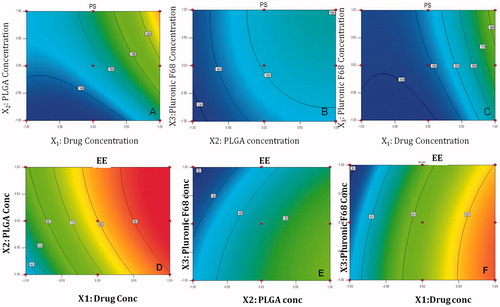
For EE, at fixed level (−1) of X1, contour graph between X2 and X3 explains that PLGA concentration has major influence on entrapment, but Pluronic F 68 concentration negate the effect of PLGA concentration, even at highest level of PLGA and lowest level of surfactant, EE of 50% could be achieved. At fixed level of X2, contour plot between X1 and X3 shows that Drug concentration overpowers the effect of surfactant concentration, Higher entrapments (greater than 80%) could be achieved at 0.5 to 1 level of X1, at all levels of X3. At fixed level of X3, Contour plot between X1 and X2 shows the synergistic effect of X1 and X2 leading to increase in entrapment at all levels. Highest entrapment above 90% could be achieved at 1.0 level of X1 and lowest −1 level of X2 ().
Response surface plot at –1 level of X1 showed that interaction effect of both the factors X2 and X3 caused least influence on particle size. There is a linear relationship between the factors. At −1 level of X2, particle size showed a nonlinear relationship, X1 had major influence whereas X3 had minor influence on particle size. At –1 level of X3, factor X1 and X2 had nonlinear relationship on particle size. Major increase in particle size occurs as both the factors have synergistic effect on particle size ().
Figure 2. Response plot showing the effect of (A) X1 versus X2 (at −1 level of X3), (B) X2 versus X3 (at −1 level of X1), (C) X1 versus X3 (at −1 level of X2) on PS (D) X1 versus X2 (at −1 level of X3), (E) X2 versus X3 (at −1 level of X1), (F) X1 versus X3 (at −1 level of X2) on EE of lopinavir-loaded NPs.
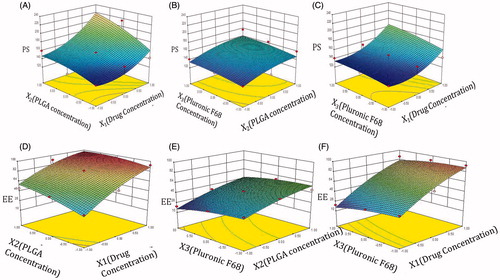
Response surface plot between X1 and X2, at fixed level of X3 showed synergistic effect of both factors on EE, while plot between X1 and X3 showed pulling effect of X1, overpowering the effect of X3, leading to higher entrapment. However, plot between X2 and X3 showed antagonistic effects of each other at fixed level of X1 ().
In all, Contour and response plots could explain the relationship of all the factors, in all possible combinations on both the responses and help us in identifying the factor combinations for achieving minimum PS and maximum EE.
Thus, higher entrapment could be achieved even at less PLGA concentration by increasing the concentration of lopinavir, at optimum concentration of surfactant.
Optimized NPs with desirability criteria
From the results, the optimum levels of independent variables were screened by multiple regression analysis. Our desirability criteria were maximum entrapment with minimum particle size (less than 200 nm). Since PS and EE were taken into consideration simultaneously, the batch with smallest particle size of 126.6 ± 4.16 nm exhibited EE near to 22% (at X1 = −1, X2 = −1.0, X3 = −1.0) while that with highest EE of 95.7 ± 2.43% produced particle size greater than 200 nm (at X1 = 1, X2 = 0.0 X3 = −1). Hence, the optimum formulation with EE 93.03 ± 1.27% and particle size 142.1 ± 2.13 nm () found at 1.0, −1, and −1 levels of X1, X2 and X3, respectively, was selected.
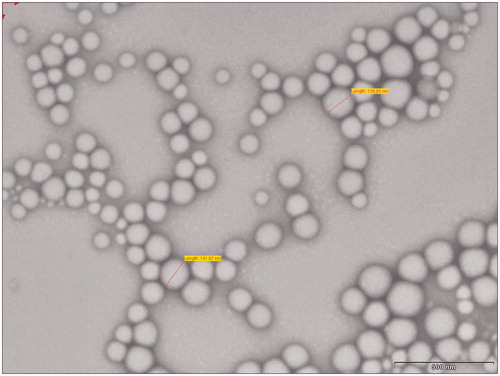
Figure 3. TEM image of lopinavir-loaded NPs.
Check point analysis
Three check points were selected as shown in . When both experimentally obtained and theoretically computed PS and EE values were compared using Student’s t-test, the difference was found to be nonsignificant (p > 0.05) in both the cases. The normalized error (NE = [Σ{(Pre – Obs)/Obs}2]1/2) between the observed and predicted values was found to be minimum. The NE for PS was found to be 0.04507 and NE for EE was found to be 0.0251.
Table 7. Check point analysis, t-test analysis and NE determination for lopinavir-loaded NPs.
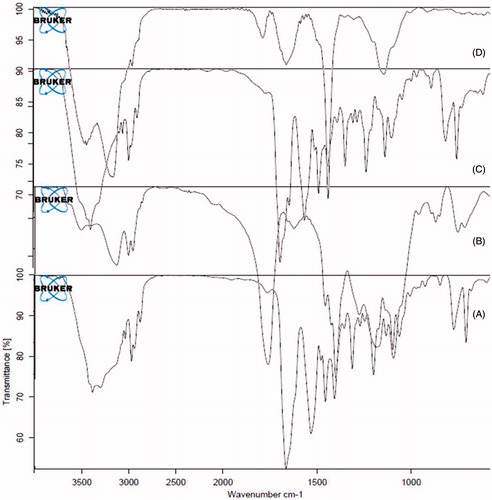
The NPs were prepared by nanoprecipitation method. The optimum formulation had EE 93.03 ± 1.27% and particle size 142.1 ± 2.13 nm. The zeta potential of optimized batch was found to be −27.2 ± 2.423 mV indicating physical stability of the NPs. TEM images () of NPs revealed discrete round structures without aggregation. NPs were seen as matrix structures with particle sizes below 200 nm. DSC thermograms of lopinavir, PLGA, physical mixture (lopinavir and PLGA) and lopinavir-loaded NPs are shown in . Pure lopinavir showed an endothermic peak at 94.13 °C showing its crystalline structure, while PLGA showed endothermic peak at 51.06 °C corresponding to its glass transition temperature (Montgomery, Citation2004). Physical mixture of drug and PLGA showed endothermic peaks of PLGA and drug respectively at 51.06 °C and 94.13 °C indicating the compatibility between them. There was no peak of lopinavir in the thermogram of NPs indicating the amorphization of drug in the polymer matrix. FTIR spectra of pure drug, PLGA, physical mixture and drug-loaded NPs are shown in . The PLGA spectrum showed characteristic peaks at 3509.60 cm−1, 3128 cm−1 and 1749.87 cm−1 indicative of O–H stretching, C–H stretching and C = O stretching (due to alpha-substitution). respectively (Eason, Citation2007). The lopinavir spectrum showed peaks at 1659 cm−1, 3376 cm−1. Physical mixture of lopinavir and PLGA retained the distinct peaks of lopinavir (3376 cm−1 and N–H 1659 cm−1) as well as PLGA (3509 cm−1, 3128 cm−1). Lopinavir-loaded NPs showed absence of peak at 3376 cm−1 corresponding to lopinavir but peak corresponding to PLGA was present confirming the encapsulation of drug in PLGA matrix.
Figure 4. DSC of (A) lopinavir, (B) PLGA, (C) physical mixture and (D) lopinavir NP.
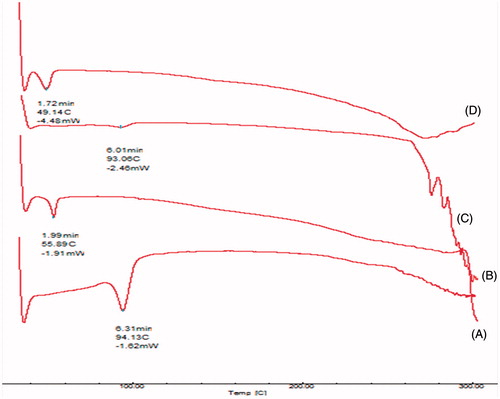
Figure 5. FTIR spectra of (A) lopinavir, (B) PLGA, (C) physical mixture of Lopinavir and PLGA and (D) lopinavir-loaded PLGA NPs.
Cell uptake studies of 6-coumarin-loaded NPs
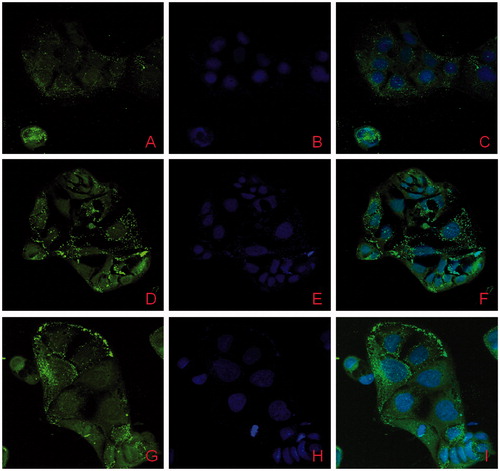
The confocal micrograph images of 6-coumarin solution and 6-coumarin-loaded NPs are shown in . 6-Coumarin was chosen as hydrophobic model dye. The micrograph images clearly showed the enhanced uptake of NPs in Caco-2 cells in comparison to plain dye solution (Supplementary Fig. ESM 1), which implies the enhanced absorption through the M cells of Peyer’s patches of intestine, as hypothesized. The uptake of NPs by Caco-2 cells was time dependent and increased with incubation time.
Figure 6. Qualitative cellular uptake of lopinavir-loaded NPs in Caco-2 cells; at 1 h (A–C), 2 h (D–F) and 4 h (G–I); Green flourescence spots represents dye-loaded NPs, Blue fluorescence represents DAPI-stained nuclei and (C, F, I) represents overlapped images.
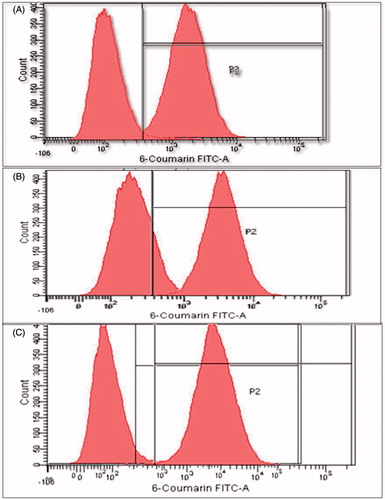
Relative extent of uptake of 6-coumarin-loaded PLGA NPs in comparison to plain dye solution was analyzed by FACS analysis. The shift of peak for fluorescent intensity clearly shows a significantly higher uptake and internalization for PLGA NPs (). Mean fluorescence intensity (MFI) for NPs was doubled from 1 to 4 h. Coumarin-loaded NPs had 2.1-fold higher MFI at 1 h, which increased to 3.6- to 6.4-fold higher MFI than plain dye solution at the end of 4 h. This clearly showed a significantly higher uptake as compared to plain dye solution. Also, uptake was time dependent, as intensity was increased with time. This enhanced uptake of NPs by Caco-2 cells can lead to greater absorption through oral GALT and can be correlated with enhanced therapeutic activity of the drug.
Figure 7. Quantitative uptake studies of coumarin-loaded NPs by FACS at (A) 1 h, (B) 2 h and (C) 4 h.
Cytotoxicity studies of lopinavir-loaded NPs and lopinavir suspension
Tolerability of lopinavir-loaded NPs as well as lopinavir was assessed in Caco-2 cells by MTT assay to check the safety of NPs (Silva et al., Citation2011). As Caco-2 cells were used as absorption model, biocompatibility and tolerability of NPs on Caco-2 cells was desirable., The lopinavir-loaded NPs did not exhibit cytotoxicity upto a concentration of 100 mcg/ml (Agarwal et al., Citation2008) (). Lopinavir was found to have no cytotoxicity effects on Caco-2 cells at 6 and 24 h. This proved the biocompatibility of PLGA NPs and explained that the composition of nanocarrier did not contribute to toxicity in Caco-2 cells (Semete et al., Citation2010; Silva et al., Citation2012) similar to findings of some other researchers on MT4 cells (Molla et al., Citation2002).
Table 8. In vitro cytotoxicity of lopinavir-loaded NPs and plain drug suspension on Caco-2 cells.
Transport studies of lopinavir-loaded NPs
The permeability coefficient of lopinavir-loaded NPs across the Caco-2 cells was found to be 8.84 × 10⁻⁵, whereas for lopinavir solution it was found to be 2.9 × 10⁻⁵ (). Lopinavir-loaded NPs had shown a 3.04 times increase in permeability, which could be attributed to the higher uptake of NPs by endocytosis in Caco-2 cells. There was a significant enhancement in the permeability of lopinavir by loading the drug in NPs.
Table 9. Drug transfer across the Caco-2 cell lines for lopinavir-loaded NPs and plain drug solution.
In vivo studies
Penetration studies
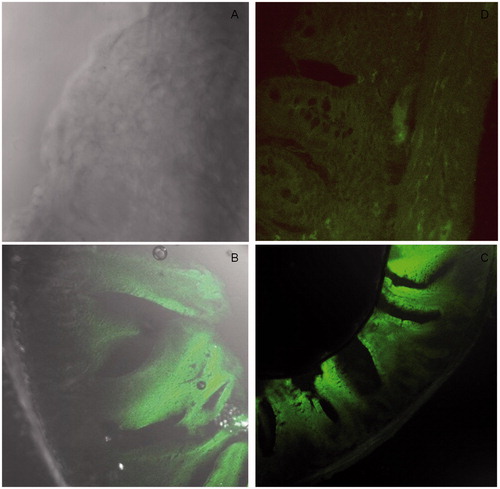
shows the confocal micrograph image of rat ileal tissue after oral administration of 6-coumarin-loaded NPs. shows negative control tissue without any dye intake, whereas shows the uptake after delivery of coumarin solution. The image 8C of NPs showed higher green fluorescence at the base of the villi region where the Peyer’s patches are intense in comparison to coumarin solution which could not reach at the base. Further 63 × image (8D) showed green fluorescence spot at the base of villi. This confirmed the higher penetration of NPs in the intestinal tissue as compared to plain solution after oral delivery (Florence, Citation1997).
Figure 8. (A) Negative control (B) control coumarin solution (C) 10× image showing uptake of coumarin-loaded NPs (D) 63× image showing intestinal uptake of coumarin-loaded NPs in rat after oral delivery.
Pharmacokinetic studies
The plasma concentration–time curve for lopinavir after oral administration of the plain drug suspension and lopinavir-loaded PLGA NPs are given in . The pharmacokinetic parameters of all these formulations were determined by Kinetica software (Kinetica 5.0, Thermo Fisher Scientific). Statistical analysis of data was done by Student’s unpaired t-test (p < 0.05, p < 0.01, p < 0.001). After oral administration, Lopinavir-loaded NPs exhibited higher plasma level concentration compared to plain drug solution. The AUClast for NPs was found to be 22335.3 ± 2310 ng.h/ml, which was significantly higher than plain drug suspension which showed AUClast of 1596.5.± 216.5 ng.h/ml. Significant improvement in Cmax in case of NPs compared to plain drug suspension solution was observed. The Cmax for lopinavir-loaded NPs was found to be 834.62 ± 86.8 ng/ml, whereas for plain drug suspension, it was 143.42 ± 22.43 ng/ml. The Cmax for plain drug solution was very less due to extensive metabolism of lopinavir by the liver microsomal CYP3A4 as well as P-glycoprotein efflux pump which secrete it back in intestinal lumen. This improvement in AUC and Cmax could be explained by the combination of the following effects: firstly, the NPs were absorbed from M cells of intestine due to particle size less than 200 nm. Secondly, a decrease in first-pass metabolism by liver microsomal enzymes, as NPs directly reaches systemic circulation through GALT. When Tmax of the NPs was compared with plain drug suspension, an increase in Tmax was observed in case of NPs.
Figure 9. Plasma concentration–time profile of lopinavir-loaded NPs and plain drug suspension in male Wistar rats (n = 6) showing the bioavailability enhancement of NPs.
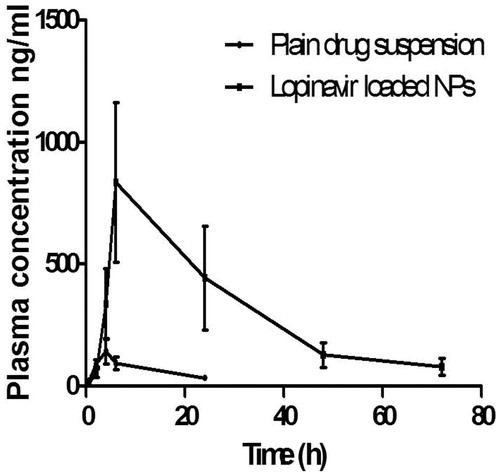
When t1/2 of the NPs was compared with plain drug suspension, it was observed that there was significant difference in t1/2 (17.93 h) as compared to plain drug suspension (8.45 h). Similarly, when the mean residence time (MRT) of the formulations was compared with plain drug suspension, there was increase in MRT observed which indicated that elimination was extended.
There was about 13.9 times increase in bioavailability (F) of lopinavir-loaded NPs and it could be attributed to capability of NPs to reach the systemic circulation, after absorption with M cells of Peyer’s patches. By formulating PLGA NPs, lopinavir could bypass the liver metabolism, therefore higher AUC was achieved along with increased MRT of drug in the body. Moreover, resistance to HIV by high viral loads in the lymphatic tissues, which is a major site for storage and replication of virus will also be reduced by delivering NPs directly to GALT.
Conclusion
Lopinavir-loaded NPs were formulated by nanoprecipitation technique. Optimum nanoparticulate preparation was found to have desirable particle size below 200 nm and entrapment efficiency above 90%. The uptake studies in Caco-2 cell lines and rat intestinal tissue by CLSM confirmed the internalization of NPs in the Caco-2 cells; the NPs were visible as fluorescent green spots inside cells and at the base of villi in the intestinal sections. FACS analysis confirmed the enhanced uptake of NPs in comparison to plain drug. Lopinavir-loaded NPs showed increase in permeability in Caco-2 cells as well as 13.9-folds bioavailability enhancement in rats after oral delivery. Thus, NPs of lopinavir have tremendous potential for improving the bioavailability of lopinavir without coadministration of ritonavir by directly delivering the drug at lymphatic viral reservoir sites, thereby preventing resistance. However, there is a need to conduct elaborate toxicological studies; preclinical studies and further investigations in human beings under clinical conditions before they can be commercially exploited. This work can be a step toward a better alternative for AIDS patients by reaching the drug directly at viral reservoir sites for effective therapy, omitting the need of coadministration of ritonavir and reducing the excessive load of drugs on AIDS patient who are already tired of longer duration and larger regimen of treatment.
Declaration of interest
The authors report no declaration of interests.
Supplementary material available online
Fig_ESM1.tif
Download TIFF Image (724.1 KB)Acknowledgement
The authors gratefully acknowledge All India Council of Technical Education, New Delhi, India, for providing National Doctoral Fellowship to Garima Joshi for her PhD work. The authors are grateful to Purac Biomaterials, The Netherlands for gift sample of PLGA (50:50, 0.2 dl/g) and SICART lab, Vallabh vidyanagar for TEM analysis, DBT-ILSPARE for CLSM and FACS studies.
Related Research Data
References
- Adinarayana K, Ellaiah P. (2002). Response surface optimization of the critical medium components for the production of alkaline protease by a newly isolated Bacillus sp. J Pharm Pharm Sci 5:272–8
- Agarwal S, Boddu SH, Jain R, et al. (2008). Peptide prodrugs: improved oral absorption of lopinavir, a HIV protease inhibitor. Int J Pharm 359:7–14
- Aji Alex MR, Chacko AJ, Jose S, Souto EB. (2011). Lopinavir loaded solid lipid nanoparticles (SLN) for intestinal lymphatic targeting. Eur J Pharm Sci 42:11–18
- Bharadwaj V, Kumar MNVR. (2006). Polymeric nanoparticles for oral delivery. New York, NY: Taylor and Francis
- Bolton SBC. (2004). Pharmaceutical statistics: practical and clinical applications. New York, NY: Marcel Dekker
- Cartiera MS, Johnson KM, Rajendran V, et al. (2009). The uptake and intracellular fate of PLGA nanoparticles in epithelial cells. Biomaterials 30:2790–8
- Chaudhary S, Garg T, Murthy RSR, et al. (2014). Recent approaches of lipid-based delivery system for lymphatic targeting via oral route. J Drug Target 22:871–82
- Dong Y, Feng SS. (2005). Poly(d, l-lactide-co-glycolide)/montmorillonite nanoparticles for oral delivery of anticancer drugs. Biomaterials 26:6068–76
- Eason R. (2007). Pulsed laser deposition of thin films: applications-led growth of functional materials. New Jersey, NJ: Wiley publishers
- Fessi H, Puisieux F, Devissaguet JP, et al. (1989). Nanocapsule formation by interfacial polymer deposition following solvent displacement. Int J Pharm 55:R1–4
- Florence A. (1997). The oral absorption of micro- and nanoparticulates: neither exceptional nor unusual. Pharm Res 14:259–66
- Florence A, Jani PU. (1993). Particulate delivery: the challenge of the oral route. In: Rolland A, ed. Pharmaceutical particulate carriers: therapeutic applications. New York, NY: Marcel Dekker
- Garinot M, Fievez V, Pourcelle V, et al. (2007). PEGylated PLGA-based nanoparticles targeting M cells for oral vaccination. J Control Release 120:195–204
- Govender T, Ojewole E, Naidoo P, Mackraj I. (2008). Polymeric nanoparticles for enhancing antiretroviral drug therapy. Drug Deliv 15:493–501
- Ina Hubatsch E. (2007). Determination of drug permeability and prediction of drug absorption in Caco-2 monolayers. Nat Protoc 2:2111–19
- Jaidev LR, Krishnan UM, Sethuraman S. (2015). Gemcitabine loaded biodegradable PLGA nanospheres for in vitro pancreatic cancer therapy. Mater Sci Eng C Mater Biol Appl 47:40–7
- Joshi G, Kumar A, Sawant K. (2014). Enhanced bioavailability and intestinal uptake of Gemcitabine HCl loaded PLGA nanoparticles after oral delivery. Eur J Pharm Sci 60:80–9
- Katerinopoulos HE. (2004). The coumarin moiety as chromophore of fluorescent ion indicators in biological systems. Curr Pharm Des 10:3835–52
- Kaur M, Malik B, Garg T, et al. (2015). Development and characterization of guar gum nanoparticles for oral immunization against tuberculosis. Drug Deliv 22:328–34
- Liu C, Shan W, Liu M, et al. (2015). A novel ligand conjugated nanoparticles for oral insulin delivery. Drug Deliv 23:1–11
- Macal M, Sankaran S, Chun TW, et al. (2008). Effective CD4+ T-cell restoration in gut-associated lymphoid tissue of HIV-infected patients is associated with enhanced Th17 cells and polyfunctional HIV-specific T-cell responses. Mucosal Immunol 1:475–88
- Mamo T, Moseman EA, Kolishetti N, et al. (2010). Emerging nanotechnology approaches for HIV/AIDS treatment and prevention. Nanomedicine (Lond) 5:269–85
- Molla A, Mo H, Vasavanonda S, et al. (2002). In vitro antiviral interaction of lopinavir with other protease inhibitors. Antimicrob Agents Chemother 46:2249–53
- Montgomery DC. 2004. Introduction to factorial designs. New York, NY: John Wiley and Sons
- Mosmann T. (1983). Rapid colorimetric assay for cellular growth and survival: application to proliferation and cytotoxicity assays. J Immunol Methods 65:55–63
- Patel G, Shelat P, Lalwani A. (2016). Statistical modeling, optimization and characterization of solid self-nanoemulsifying drug delivery system of lopinavir using design of experiment. Drug Delivery. [Epub ahead of print]. doi:10.3109/10717544.2016.1141260
- Prot M, Heripret L, Cardot-Leccia N, et al. (2006). Long-term treatment with lopinavir-ritonavir induces a reduction in peripheral adipose depots in mice. Antimicrob Agents Chemother 50:3998–4004
- Pukanud P, Peungvicha P, Sarisuta N. (2009). Development of mannosylated liposomes for bioadhesive oral drug delivery via M cells of Peyer’s patches. Drug Deliv 16:289–94
- Rivolta I, Panariti A, Lettiero B, et al. (2011). Cellular uptake of coumarin-6 as a model drug loaded in solid lipid nanoparticles. J Physiol Pharmacol 62:45–53
- Semete B, Booysen L, Lemmer Y, et al. (2010). In vivo evaluation of the biodistribution and safety of PLGA nanoparticles as drug delivery systems. Nanomedicine 6:662–71
- Senanayake TH, Warren G, Wei X, Vinogradov SV. (2013). Application of activated nucleoside analogs for the treatment of drug-resistant tumors by oral delivery of nanogel-drug conjugates. J Control Rel 167:200–9
- Shah U, Joshi G, Sawant K. (2014). Improvement in antihypertensive and antianginal effects of felodipine by enhanced absorption from PLGA nanoparticles optimized by factorial design. Mater Sci Eng C 35:153–63
- Silva AC, Gonzalez-Mira E, Garcia ML, et al. (2011). Preparation, characterization and biocompatibility studies on risperidone-loaded solid lipid nanoparticles (SLN): high pressure homogenization versus ultrasound. Colloids Surf B Biointerfaces 86:158–65
- Silva AC, Kumar A, Wild W, et al. (2012). Long-term stability, biocompatibility and oral delivery potential of risperidone-loaded solid lipid nanoparticles. Int J Pharm 436:798–805
- Soni G, Yadav KS. (2015). Applications of nanoparticles in treatment and diagnosis of leukemia. Mater Sci Eng C Mater Biol Appl 47:156–64
- Vyas TK, Shah L, Amiji MM. (2006). Nanoparticulate drug carriers for delivery of HIV/AIDS therapy to viral reservoir sites. Expert Opin Drug Deliv 3:613–28
- Zhang L, Wang S, Zhang M, Sun J. (2013). Nanocarriers for oral drug delivery. J Drug Target 21:515–27
- Zhou S, Feng X, Kestell P, et al. (2005). Transport of the investigational anti-cancer drug 5,6-dimethylxanthenone-4-acetic acid and its acyl glucuronide by human intestinal Caco-2 cells. Eur J Pharm Sci 24:513–24