
Abstract
A novel cationic nanoemulsified in-situ ophthalmic gel of loteprednol etabonate (LE) was developed to improve the permeability and retention time of formulations for overall improvement of drug’s ocular bioavability. Capryol 90 (oil phase), tween 80 (surfactant) and transcutol P (cosurfactant) was selected as formulation excipients to construct pseudoternary phase diagrams and nanoemulsion region was recognized from diagrams. Spontaneous emulsification method was used to manufacture LE nanoemulsion and it was optimized using 32 factorial design by considering the amount of oil and the ratio of surfactant to cosurfactant (Smix) as independent variables and evaluated for various physicochemical properties. Optimized NE was dispersed in Poloxamer 407 and 188 solution to form nanoemulsified sols that were predictable to transform into in-situ gels at corneal temperature. Drug pharmacokinetics of sterilized optimized in situ NE gel, NE-ISG2 [0.69% w/w Capryol 90, 0.99%w/w Smix (3:1), 13% Poloxamer 407, 4% w/w Poloxamer 188] and marketed formulation were assessed in rabbit aqueous humor. The in-situ gels were clear, shear thinning in nature and displayed zero-order drug release kinetics. NE-ISG2 showed the minimum ocular irritation potential and significantly (p < 0.01) higher Cmax and AUC(0–10 h), delayed Tmax, extended mean residence time and improved (2.54-fold times) bioavailability compared to marketed formulation.
Introduction
The most interesting and challenging accomplishments faced by scientist for Ocular drug delivery is poor permeation and bioavailability of drugs delivered through this route (Mitra, Citation1993). Main reasons for law bioavailability of drugs from orthodox formulations are quick drainage of drugs from the precorneal area along with prompt elimination of drugs by defense mechanisms of the eye alike reflex blinking and increased tear flow (Patton & Robinson, Citation1976; Sieg & Robinson, Citation1977). Because of this, numerous instillations of concentrated eye drops are needed for achieving the anticipated therapeutic effects (Chien, Citation1992), which may results in poor patient compliance and sometimes causing side effects due to nonproductive absorption of drugs in stomach through the nasolacrimal duct (Mathiowitz et al., Citation1999). Numerous ocular formulations, such as drops, suspensions, ointments, inserts and aqueous gels, have been established to increase the residence times of instilled dose and increase ocular bioavailability (Lee & Robinson, Citation1979), however, they have not been universally accepted and used widely, due to some shortcomings like hazy vision from semisolid dosage forms or poor patient compliance from inserts (Lee, Citation1990). Consequently, superior ophthalmic bioavailability of a drug following topical delivery to the eye remains a challenge that is yet to be solved acceptably (Felt, Citation1999).
The major pros of the ocular nanoemulsions (NE) compared to conventional eye formulations are it provides sustained release of the drug, better penetration and higher ocular bioavability. It can be easily sterilized, comparatively simple, do not require any complex requirement of equipment’s for production and economical (Ammar et al., Citation2009). The therapeutic window of the drug is achieved with less amount of dose which may reduce systemic and ocular side effects. The viscosity of NE is comparable with conventional ophthalmic formulations, so it is a challenge for formulation scientist to increase its residence time in the eye, incorporating the NE into the in-situ gel is an alternative method to improve the therapeutic performance of the drug into the eye by increasing its residence time. Recent trend is to develop cationic oil in water nanoemulsions for ophthalmic delivery to increase ocular drug bioavailability. The reason is ocular surface being negatively charged, which forms electrostatic interactions with cationic nanoemulsion and thus increases precorneal residence time of formulations (Rabinovich-Guilatt et al., Citation2004).
The in-situ gels are simple transparent polymeric solutions which are liquids at storage conditions, but converted into viscoelastic gel once inserted into eye because of phase transition properties of polymers. The reported advantages of gel are increase in ocular residence time and bioavailability; permit delivery of exact reproducible doses and improve patient compliance (Nanjawade et al., Citation2007). This conversion occurs because polymers incorporated in the system may undergo to modifications due to the change in temperature, pH or electrolyte composition of the lacrimal fluids (Ludwig, Citation2005). Various polymeric combinations have been successfully used for desired formulation and tailor-made release profile. It has been recommended that a good ophthalmic thermo-responsive in-situ gel should have sol–gel transition temperature greater than the room temperature and form gel at pre-corneal temperature (35 °C) to avoid storing in a fridge before instilling, which may sometime leads to eye irritation due to cold nature (Patel et al., Citation2016). We have selected Poloxamer, a temperature-responsive polymer because of its unique thermo-reversible gelation and nonionic surface-active properties.
Loteprednol etabonate (LE), an ester-based corticosteroid, is approved by the US Food and Drug Administration in 1998 as an aqueous suspension formulation for topical management of many ocular inflammatory diseases, and inflammation develops after cataract surgery. Unfortunately, due to the presence of suspended particles in the formulation, the dosage form has severe disadvantages like blurred vision or other change in vision, redness or inflammation of the eye, light sensitivity, swelling of the membrane covering the white part of the eye, etc. The ophthalmic suspension when introduced into the eye results in high amount of drug loss because of tear drainage and flashing of eyes. Therefore, very less quantity of drug (1–6%) enters into intraocular tissues, and thus limited corneal permeability results in low ocular bioavailability. So, recurrent administration is mandatory, which may have unwanted side effects produced by the systemic drug introduction. LE is slightly soluble in water (0.5 μg/mL) and its crystalline nature present persistent difficulties in evolving appropriate topical dosage form for ophthalmic use (Coffey et al., Citation2013; Schopf et al., Citation2014). Thus, an innovative ocular system is essential to improve the presentation and bioavailability of LE.
In the light of the above facts, the current study aimed to develop in-situ ocular poloxamer-based NE gels of LE, which is capable of upgrading the performance of drug related to predictable eye suspensions. The first advantages of NE gels are nanosize of globules, which may increase the solubility of the drug, permeation into cornea and aqueous humor. The second advantage is higher residence time into eye due to its viscous and cationic nature, which allows modifying the frequency of the drug release such that circumvents numerous instillations of the formulations and leads to enhance the ocular drug bioavailability. The best achieved in-situ NE gel was studied for the likely ocular irritation potential and pharmacokinetic performance in the aqueous humor of albino rabbits in comparison with the marketed formulation.
Materials and methods
Materials
LE was received as a gift sample from Sun pharmaceuticals, Baroda, India. The materials like Capmul MCM, Captex 300, Transcutol P and Capmul MCM C8 were generously donated by Abitec Corporation, Mumbai, India. Capryol 90, Labrafac PG, Cremophor EL, Cremophor HS 15 and Cremophor RH 40 were gifted from Gettefosse, Saint-Priest Cedex, France. Acrysol EL 135 and Acrysol K 140 were gifted form Corel Pharma Chem, Ahmedabad, India. Castor oil, oleic acid, olive oil, IPM, corn oil and soyabean oil were purchased from Loba Chem, Mumbai, India. Tween 20, Tween 80, PEG 400, PEG 600, PEG 200, propylene glycol (PG), Span 83, Span 20, Span 80, Poloxamer 188 and Poloxamer 407 were purchased from Himedia Labs, Mumbai, India. Double-distilled water was used throughput the study. Acetonitrile and methanol used in the present study were of high-performance liquid chromatography (HPLC) grade. All other chemicals were of analytical reagent grade.
Methods
Screening of oil (Azeem et al., Citation2009)
The solubility of LE in several oils was identified by adding a large amount of LE in 2 mL of the oils (Capryol 90, Soyabean oil, Oleic acid, Labrafac PG, IPM, Castor oil, Olive oil, Captax 300, Capmul MCM, Corn oil) individually in 5-mL stopper vials and mixed with vortex mixer for 10 min. The vials were then stored at 25 ± 1.0 °C in an isothermal shaker for 3 days to attain equilibrium. The samples were removed and centrifuged at 3000 rpm for half an hour. The supernatant was separated and filtered using a 0.22 μm membrane filter. The concentration of LE was analyzed by the reported HPLC method (Han & Segall, Citation2014).
Screening of surfactants (Azeem et al., Citation2009)
The solubility of LE in numerous surfactants (Cremophor EL, Cremophor RH 40, Cremophor HS 15, Tween 20 and Tween 80) was determined as per the method described for screening of oils. From the solubility study, three surfactants (Acrysol EL 135, Acrysol K 140 and Tween 80) were selected for further selection. Final selection of surfactant is based on its highest capacity to solubilize the maximum amount of the oil. For that, 2.5 mL of 15%w/v surfactant solution was prepared in water and 4 μL of formerly optimized oil was added with excess vortexing. The addition of oil was continued till the solution converted cloudy after the one phase clear solutions were obtained.
Screening of co-surfactant (Azeem et al., Citation2009)
Ten different cosurfactants, namely PEG 600, PEG 400, PEG 200, PG, Span 83, Span 80, Span 20, Triacetin, Transcutol P and Capmum MCM C8, were screened through solubility study for their potential to support formerly nominated surfactant with respect to emulsification of the corresponding oil phase. The co-surfactant was selected on the base of its role in concluding formulations. The study was accomplished in triplicates and the average values were recognized. A mixture of surfactant and co-surfactant (1:1) was used to prepare 2.5 mL of 15% w/v solution in distilled water. Previously optimized oil (4 μL) was added to each of the Smix solutions along with vortexing till the system converts hazy.
Construction of pseudoternary phase diagram
The aqueous water titration method was used to make pseudoternary systems consisting of oil (Capryol 90), surfactants (Acrysol K 140) and a co-surfactant (Transcutol P) by mixing them at 25 °C. The equivalent pseudoternary phase diagrams were created with Tri-plot software (PRO SIM Ternary phase diagram software, Labège, France). Surfactant and co-surfactants (S/CoS or Smix) in altered weight proportions (1:1, 2:1, 3:1, 4:1) were selected and their concentration proportions were identified from available range of NEs (Kumar et al., Citation2009; Chhabra et al., Citation2011) for the study of phase diagrams. For every phase diagram, altered weight ratios of oil and Smix, 1:9, 2:8, 3:7, 4:6, 5:5, 6:4, 7:3, 8:2 and 9:1 were prepared in distinct glass tubes to designate the boundaries of phases exactly made in all phase diagrams. Aqueous phase was added drop wise to the each weight ratios of oil and Smix with continuous stirring till one phase or clear solution was observed. The system was inspected for the appearance and flowability after each addition, and the end point of titration were considered when solution converts turbid. The amount of excipients mandatory was noted and form those, appropriate weight ratios of all entities (Oil, Smix and water) were selected (Sabna et al., Citation2015; Juber et al., Citation2016).
Formulation of the LE-loaded nanoemulsion
The LE-loaded nanoemulsion were formulated as per the experimental design employing a two-factor, three-level (32) factorial design by selecting the percentage of oil Capryol 90 (X1) and Smix (X2) as independent variables, while mean globule size are measured in nm (Y1) and polydispersity index (Y2) as responses (Ammar et al., Citation2010; Pathak et al., Citation2012). To recognize the significance of different independent variables on the experimental responses, response surface analyses were carried out. illustrates the selected factor levels from the phase diagram for the factorial design. LE (0.5% w/v) was added by vortexing into the optimized quantity of oil for the formulation of NE. The NEs were formulated by mixing an optimized amount of oil, water, surfactant and co-surfactant, and then stored in freeze at 4 °C with occasionally mixed till clear solutions were obtained. Nanoemulsion formulations were prepared at Smix weight ratio of 3:1. LE-loaded nanoemulsions were formulated 2 days before examination and kept at room temperature, so LE can thermodynamically distribute amongst oil, water, and surfactant micelles with equal attainment. Drug-loaded NE (0.5%, w/w) were preserved with benzalkonium chloride (0.01%, w/w). In an effort to mimic physiological dilution practice and subsequent ocular administration, the selected NEs were mixed with artificial tear fluid 1:5 (v/v) (pH 7.4) and checked for clarity for a period of 48 h (Moreno et al., Citation2003). Diluted systems that displayed transparency, preserved their physical characteristics and same phase were recorded as true oil-in-water NEs and were selected for auxiliary studies.
Table 1. Ranges of the factors investigated using 32 factorial experimental design.
Optimization by desirability function
Design Expert® software (version 8.0.5, Stat-Ease, Inc., Minneapolis, MN) was used to generate and evaluate the 32 factorial design matrixes. The second-order quadratic or polynomial equation was generated based on the responses and can be approached in the following mathematical model:
where Y is the measured response, β are regression coefficients, and X1, X2, are independent factors. ANOVA, lack-of-fit and multiple correlation coefficient (R2) tests were used to check the accuracy of the model using the Design Expert software and further optimization was accompanied by a desirability function. The general linear scale desirability function introduced by Derringer and Suich (Vojnovic et al., Citation1993) was used to optimize all the responses simultaneously.
The best positive and collaborating point in the design space that achieves the desired target for dependent variables was obtained from the desirability function. The targets are shown in . The desirability function for the response to be reduced can be defined by EquationEquation (1)
where di,min is the distinct desirability of the response to be reduced, Ymin represents the lesser maximum likely value or lowermost satisfactory value, Ymax characterizes the highest probable value or highest satisfactory value and Yi indicates the investigational value. If Yi is higher than or greater than Ymax, then di = 0; and if Yi is less than or below the tiniest, then di = 1. Likewise, for a response to be maximized, the desirability function is defined as EquationEquation (2)
.
where di,max is the discrete desirability of the response to be maximized. If Yi is equal to or less than Ymin, then di = 0; and if Yi is higher or equal to Ymax, then di = 1. An overall desirability (D), also termed universal desirability function, is then calculated by taking the geometric mean of the diverse desirability values, as revealed in EquationEquation (3)
.
where n is the number of responses. The Design Expert software was used to decide the highest desirability (Kim Kin, Citation2000).
Thermodynamic stability studies
The thermodynamic stability of the NEs was assessed on three stages as per protocol planned by Shafiq et al. (Citation2007). Firstly, the NEs were exposed to 6 heats (45 °C) and cool (4 °C) rotations by storing at every temperature for 48 h. Further, they were centrifuged at 3500 rpm for half an hour, and lastly permitted to 3 freeze (−21 °C) and thaw (25 °C) cycles with storing at every temperature for 2 days (Samira et al., Citation2016).
Physicochemical characterization
Particle size analyzer (Microtrac) working on the principle of dynamic light scattering was used to measure the globule size and polydispersity index (PDI) of NEs (Ammar et al., Citation2010; Chhabra et al., Citation2011; Pathak et al., Citation2012; Tayel et al., Citation2013). Globules of NEs have Brownian movement, which can vary the scattering light and measurement was carried out at 25 ± 1 °C with 90°, after diluting samples with phosphate buffer saline. One of the prime parameters for the stability and ocular absorption of nanoemulsion is the size of the oil nanodroplets. A supplementary aspect preferring drug absorption is associated to the small size of the nanodroplets (less than 150 nm), which may have greater interfacial area accessible for drug exchange. PDI indicates size distribution of globules in nanoemulsion, which may also affect stability of nanoemulsion and release property of the drug. The zeta potential generated due to electrophoretic mobility and primarily depends on the nature of the excipients, its concentration and the electrolyte environment of the oil nanodroplets and it was also calculated by microtrac particle size analyzer.
Refractive index (RI) measurements findings likely show the impairment of visualization or uneasiness to the patient after instillation of the eye drops. RI was measured by placing one drop of the NEs on the slide of refractometer (Model CAR-02, Digital Abbe Refractometer, Navi Mumbai, India).
The transparency of NEs was identified by optical inspection of the formulations below light alternatively against white and black backgrounds, and percentage transmittance (%T) was measured spectrophotometrically at 630 nm after diluting NEs with distilled water (1:10). A calibrated digital pH meter was used to measure pH at 25 °C and drug content was measured with the HPLC method. All measurements were made in triplicate and their average was taken for all the above-mentioned studies.
Preparation of drug-loaded NE gel solutions
The modified cold method (Shafiq et al., Citation2007) was used to formulate in-situ forming gels containing NEs. Poloxamer 407 (12, 13, 14, 15 and 16% w/w) with Poloxamer 188 (4% w/w) was gradually added to the predicated quantity of cold acetate buffer (pH 4) in a vial and the solution was continuously stirred with a thermostatically controlled magnetic stirrer (Model RH digital white, IKA, Wilmington, NC).
The moderately dissolved poloxamer solutions were refrigerated with occasional stirring until clear solutions were obtained (∼24 h). The drug-loaded NE gel solutions were formulated by adding the suitable amount of optimized LE-loaded NE in the planned quantity of acetate buffer during the mixing step. All the batches contains 0.69% W/W of oil and 0.99% W/W of Smix (3:1), which are obtained after optimization. To make the formulations isotonic with eye fluid, an isotonic agent, glycerin was added with the desired concentration calculated from the molecular concentration percent method (Srividya et al., Citation2001). Autoclave was used to sterile all the vessels used during the formulation of the in-situ forming gels and acetate buffer was passed through 0.2 μm membrane filter. Aseptic environment was maintained throughout the formulations by performing all procedures in the laminar flow hood (Gupta et al., Citation2007).
Characterization of drug-loaded in situ NE gels
The clarity, pH, refractive index, globule size, PDI, zeta potential, osmolarity, % transmittance and drug content of nanoemulsified in-situ gels (NE-ISGs) was done by the same methods described for characterization of NE (Hitendra & Surendra, Citation2010; Weiming et al., Citation2016).
Measurement of gelation temperature of NE-ISGs
Totally 2 ml of NE-ISGs were filled in glass tubes, heated at a rate of 1 °C/min, and the temperature at which the physical state of the NE-ISGs altered was considered as the gelation temperature (Pandit, Citation1996; Bentley et al., Citation1999). Gels were transparent and very gelatinous mixtures did not show a modification in the meniscus consequently being slanting to an angle of 90°.
Rheological behavior
Brookfield viscometer (Model DV-II+Pro (Brookfield AMETEK, Middleborough, MA) was used to measure the viscosity of the optimized NE-ISG2 after diluting it with artificial simulated tear fluid (ATF) (25:7) at 34 ± 0.5 °C by altering the shear rate from 5 to 100 rpm with controlled speed and waiting period of 6 s at each rpm. The grading of the shear rate was reversed at the same speed similar to the waiting period of 6 s (Miyazaki et al., Citation2001; Jain et al., Citation2012). Experiments were executed in triplicate.
Ex-vivo transcorneal permeation
The ex-vivo transcorneal permeation study of LE from drug solution, optimized NE formulation, NE-ISG2 and marketed product was implemented with goat cornea. The entire eyeballs of the goats were collected immediately after the goats were slaughtered in a slaughter house and transferred into normal buffered saline in cold condition (4 °C). The cornea were carefully detached with 2–4 mm of adjacent scleral tissues and washed with cold saline three to five times till it was free from protein and adhering tissues, after that it was placed in newly prepared artificial tear fluid (ATF). Modified Franz diffusion cell with two compartments was used to perform permeation study, the donor compartment was filled with 2 mL of the formulation containing 0.5% w/w of LE and the receptor compartment with 10 mL of ATF pH 7.4. Both the compartments are separated by cornea and the receptor compartment was continuously stirred and repeatedly filled with ATF at the rate 20 μl/min to mimic in-vivo ocular conditions. The whole system was well-maintained at 37 ± 0.5 °C and at specified time intervals, the samples were withdrawn from the receptor compartment and analyzed for quantity of drug permeated in nm using HPLC, and the mean values (±SD) were plotted versus time.
HET-CAM test
Modified Hen’s egg test-Chorioallantoic membrane (HET-CAM) test as reported by Velpandian (Clark et al., Citation2004) was performed to check irritancy of the formulation. Freshly collected fertilized hen’s eggs were incubated at 37 ± 0.5 °C for 3 days by manually rotating each egg at every 12 h. At the end of 3rd day, albumin was removed from the one end of egg using sterile forceps. Sterilized Para film was used to seal the hole and eggs were stored for 10 days in suitable conditions for the development of chorioallantoic membrane (CAM) away from the shell. 0.5 mL of test formulation and 0.9% NaCl solution (as a control because nearly nonirritant) was directly added onto the CAM surface and left for 5 min on the 10th day (Dinh & Liu, Citation2003). The CAM was scored for the parameters as follows: 0 Score for no visible hemorrhage, 1 for just visible membrane discoloration, 2 for structures covered partially due to membrane discoloration or hemorrhage, 3 for structures covered totally due to membrane discoloration or hemorrhages, which means nonirritant, mild irritant, moderately irritant and severely irritant, respectively.
Estimation of LE pharmacokinetics in the rabbit aqueous humor
Male New Zealand albino rabbits were used to find out pharmacokinetics of LE in the aqueous humor for optimized sterilized in-situ NE gels (NE-ISG2). The protocol of the studies (IAEC/DPS/SU/1511) was approved by the Institutional Animal Ethics Committee (IAEC), Department of Pharmaceutical Sciences, Saurashtra University, Rajkot, Gujarat, India.
Study design
The study was performed to compare the pharmacokinetics of LE succeeding ocular instillation of a marketed formulation (0.5%, w/v) and the sterile optimized drug-loaded NE-ISG2 (0.5%, w/v) by a non-blind, two-treatment, randomized, parallel design.
Instillation of drug formulations
The marketed formulation (0.5% w/v, 50 μl) and LE-loaded NE-ISG2 gel (0.5%, w/v) were instilled with micropipette into lower conjunctiva sac of the right eye of all rabbits, which were divided 5 in each group. Ketamine hydrochloride (50 mg/kg) in combination with a relaxing agent xylazine (10 mg/kg) was used intramuscularly to anesthetize the rabbits (El-Laithy et al., Citation2011). 0.1 ml of aqueous humor samples was withdrawn at the time interval of 0.25, 0.5, 1, 1.5, 4, 8 and 10 h post instillation after giving local anesthetics Benoxinate HCl (0.4%, w/v, 2 drops). The samples was mixed with acetonitrile (0.10: 0.20 ml) using vortexing for 30 s and centrifuged for half an hour at 2000 × g. The organic phase was collected and a portion of 20 μl was used for HPLC analysis.
HPLC analysis of LE in rabbit aqueous humor
A previously described HPLC method for the determination of LE in eye drops was implemented to find out the LE pharmacokinetics in the rabbit aqueous humor (Han & Segall, Citation2014). The LC method was carried out on a Shimadzu Coporation, LC-20AD, Tokyo, Japan 4.6 × 250 mm column (USA) (Inertsil ODS-3 reverse-phase C18 column) preserved at room temperature. The mobile phase consisted of water:acetonitrile:acetic acid (34.5:65.0:0.5, v/v/v) filtered with a 0.45 μm membrane filter and the eluent was observed at 244 nm with a flow rate of 1 ml/min and the injection volume was 20 μL. The chromatographic separation was attained with a retention time of 4.89 min. All standard curves showed excellent linearity with R2 = 0.999 through entire range of 10–60 μg/ml.
Pharmacokinetic analysis
The pharmacokinetic parameters were measured for every rabbit implementing non-compartmental analysis and the highest LE concentration in the rabbit aqueous humor (Cmax, ng/ml), the time to reach Cmax (Tmax, h) as well as the mean residence time (MRT, h) were estimated from the specific aqueous humor concentration–time curves. The trapezoidal rule method was employed to calculate the area under curve from 0 to 10 h (AUC(0–10 h), ng h/ml). The increase in the ocular bioavailability was calculated from the AUC(0–10 h) of the NE-ISG2 and that of the marketed formulation.
Results and discussion
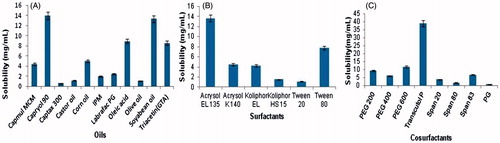
Screening of oil
Drug loading in the formulation is a precarious step for the development of nanoemulsion system because drug solubility is dependent on formulation components for less soluble APIs. For the nanoemulsion type of liquid dosage form, the volume of formulations should be small enough to transport the therapeutic quantity of the drug in a captured form. Solubility of the drug in the oil phase is one of the significant benchmarks for the selection of oils. The solubility of LE in different oils, surfactants and co-surfactants was determined (). The solubility of LE was found to be highest in Capryol 90 (13.95 ± 0.75 mg/ml), Acrysol EL135 (13.64 ± 0.65) and Transcutol P (38.87 ± 0.81 mg/ml) as related to other oils, surfactants and co-surfactants, respectively. Capryol 90 is chemically propylene glycol monocaprylate (type II) NF, whose HLB value is 6. The polarity of poorly soluble drugs is responsible for their solubilization by medium-chain triglycerides or mono- or di glycerides types of oils. Thus, Capryol 90 was selected as the oil phase for the development of nanoemulsion formulation.
Figure 1. Comparative solubility profiles of LE in various (A) oils, (B) surfactants and (C) cosurfactants.
Screening of surfactants
Based on solubility study of LE in surfactants (), three surfactants, namely Acrysol EL 150, Acrysol K140 and Tween 80, were selected for supplementary study. The solubility of LE in the Kolliphor EL is also quite comparable but it was omitted due to its ocular irritation, and reddening effect of the conjunctiva of rabbit has been reported in the literature (Lawrence & Rees, Citation2000). The objective was to recognize the surfactant that has the maximum solubilization capability for the selected oil; capryol 90 can provide maximum nanoemulsion area in the absence of cosurfactant. 1.76 wt. % of Capryol 90 was solubilized by Tween 80, which is highest amongst all So, it was selected as the surfactant for the nanoemulsion development in this study. A preliminary sign on the possibility of nanoemulsion formation with this system should be given from Surfactant–oil miscibility. Other advantages of the tween 80 are: it is a nonionic surfactant, with less toxicity compared to its equivalents, lower critical micelle concentrations, extensively used in ophthalmic preparations due to its safe property. It is also listed in US Pharmacopeia-National Formulary; European Pharmacopeia (Tenjarla, Citation1999) and categorized as essentially nonirritant. A supplementary significant benchmark for the selection of the surfactants is their HLB values, which must be higher than 10 to form o/w nanoemulsions (Yuan et al., Citation2006) and tween 80 also satisfying this requirement as its HLB value is 15.
Screening of co-surfactant
Based on the solubility study of LE in co-surfactants (), three surfactants namely Transcutol P, PEG 600 and PEG 200 were selected for further study. Co-surfactants are incorporated to acquire nanoemulsion systems at low surfactant concentration since it decreases the interfacial tension and increases the flexibility of the interface (Lawrence & Rees, Citation2000), which in turn increases the flexibility of the hydrocarbon tail leading to superior dispersion of the oil into this area. All the co-surfactants studied are pharmaceutically accepted components. After the selection of capryol 90 as the oil phase and Tween 80 as a surfactant, the objective was to identify the co-surfactant that has the highest solubilization capacity for the oil, so it can give maximum nanoemulsion area with the addition of surfactant. As Transcutol P along with Tween 80 solubilized the maximum amount of Capryol 90 (1.28 wt. %), it was chosen as the co-surfactant for the nanoemulsion development.
Construction of pseudoternary phase diagram
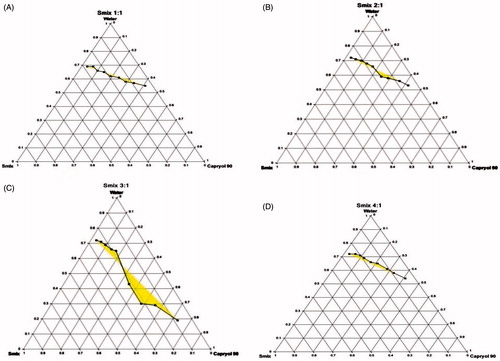
The pseudoternary phase diagram determines concentration range of the components for the existence of nanoemulsion in the absence of LE. ) represents the pseudoternary phase diagrams by varying the Smix ratio at 1:1, 2:1, 3:1 and 4:1. The dark areas of the diagram represent the NE region, while remaining portions exhibit emulsion region and metastable system are not selected for the further study. The area of NE region became wider as the Smix ratio increased from 1:1 to 3:1, and attained higher value with Smix of 3:1. The wider region designated better nanoemulsifying efficacy of the prepared NE formulation and improved interaction among all components. It has been concluded that improved dispersion of the oil phase in the hydrophobic region of the surfactant monomers due to increase in the fluidity of dispersion decreases the interfacial tension with enhancement in the entropy of the system. A decrease in the nanoemulsion area was detected when the surfactant concentration is further increased in the Smix ratio of 4:1 () compared with Smix 3:1. Therefore, there was no prerequisite requirement to attempt a Smix ratio of 5:1. Therefore, the areas of one-phase nanoemulsion zones are reliant on surfactant composition and nanoemulsion area decreased as compared to Smix 1:1, when the co-surfactant concentration with respect to surfactant was increased to the Smix 1:2 (figures are not shown). The surfactant and co-surfactant mass ratio and type and concentration of oil employed had been found to be an important point for the phase properties, i.e. size and position of nanoemulsion region. Based on these, Smix ratio (3:1) was selected for the preparation of NE.
Figure 2. Pseudoternary phase diagrams composed of Capryol 80: Tween 80: Transcutol P dispersed with water at 37 °C. Smix ratio = 1:1 (A), 2:1 (B), 3:1 (C) and 4:1 (D).
Formulation of the LE-loaded nanoemulsion using 32 factorial design
shows the results of dependent variables, mean globule size (Y1) and PDI (Y2) of the formulated LE nanoemulsions from 32 factorial design, and all data were generated by Design Expert® software in which every response was fitted to a second-order quadratic model and model significance was identified by ANOVA, lack-of-fit test and multiple correlation coefficient (R2) tests. represents model p-values, term p-values, lack-of-fit test and R2 for each dependent variable. The model p-value should be less than 0.05 to best fit the quadratic model (Rice, Citation1989). In the ANOVA test, the model p-values for Y1 and Y2 are less than 0.05, so all responses (Y1 and Y2) fitted the quadratic model. Lack-of-fit test describes the difference of the data around the fitted model; it should be insignificant (p-value > 0.1) relative to the pure error for the model to fit the data well. A model with a significant lack of-fit lacks prediction efficiency. In the lack-of-fit test, the p-values of the model for responses Y1 and Y2 fitted in the quadratic model are 0.4350 and 0.6521, respectively; thus, both the responses (Y1 and Y2) represent insignificant lack-of-fit (p-value > 0.1). Multiple correlation coefficient (R2) suggests the quantity of the difference around the mean as clarified by the model, and a value more than 0.9 is desirable. In this experiment, R2 values for the responses (Y1 and Y2) are 0.9928 and 0.9844, respectively, which signifies that for Y1 and Y2, the confidence that the regression equations would estimate the observed value was superior than mean. In , the coefficients (factor intercepts) with more than one term (X1*X2) and those with high-order terms (X12 and X22) indicate the interaction and quadratic effects, respectively.
Table 2. Results of physicochemical properties of prepared LE-loaded nanoemulsions and statistical analysis of measured responses.
Physicochemical characterization
shows the results of all physicochemical characterization tests of NE. Zeta potential shows the surface charge of particles and provides information about the degree of repulsion between adjacent correspondingly charged globules in the formulation with respect to negative or positive charge and high magnitude considers for better stability. All the formulations represent the zeta potential in the range of −6.22 to −20.27 mV. One of our goals was also to make cationic nanoemulsion because of its positive charge; it should form electrostatic interactions with negatively charged ocular surface and increase the precorneal residence time of formulations which may enhance permeation and ocular bioavaibility (Lallemand et al., Citation2012; Daull et al., Citation2013). The higher positive charge of the cationic agents leads to the higher stability of nanoemulsion due to the creation of an electrostatic repulsion amongst the oil droplets of the nanoemulsion. Cetalkonium chloride was found to be the best cationic agent which may form cationic o/w nanoemulsions with surprising valuable biological activity for the ocular surface, so we have added 0.005% w/w cetalkonium chloride as a cationic agent in the optimized batch to increase the zeta potential, which may increase the stability and retention time of nanoemulsion in the eye.
Refractive index measurements identify likely impairment of vision or discomfort to the patient after administration of formulations. Refractive index of tear fluid is 1.340–1.360 and it is recommended that eye drops should have refractive index values not greater than 1.476. LE NEs had refractive index values ranging from 1.366 to 1.430, which are within the recommended values. The % transmittance was found to be in the range of 96.22–99.45%. The pH of all the NEs was found to be in the range of 5.52–6.49 that is acceptable for ophthalmic delivery as it is well tolerated by human eye. The osmolarity of the formulation for ocular delivery is also an important parameter which decides the irritability of the formulation, and ideally it should be less than 290 mOsmol/L. All the formulations have osmolarity value in the range of 223.18–260.23 mOsmol/L. The drug content of all the formulations is also in the acceptable range.
Influence of formulation composition factors on responses
The globule size is a critical characteristic of nanoemulsion because it influences drug release rate, absorption and irritation to the eyes in the case of ophthalmic delivery. By virtue of their size, these NEs are predictable to be capable of transferring necessary drug quantities into the cornea and the aqueous humor. In , it can be seen that all independent variables influenced globule size (term p-value < 0.001). shows the response surface plot for mean globule size and for PDI. The mean globule size of all the formulations was found in the range of 15.32 ± 1.15 to 53.45 ± 0.75. However, the amount of oil (X1) had a more positive effect on globule size, as the concentration of oil increases, the globule size increases.
Figure 3. Response surface plot (A) for mean globule size and (B) PDI and (C) Contour plot for overall desirability (D).
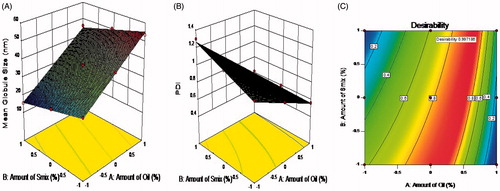
It has been observed that, as oil percentage increases, the globule size also increase and these findings also match with the previous research showing that globule size increases significantly when more oil is incorporated due to the enlargement of oil droplet of the microemulsion (Yuan et al., Citation2006). As the concentration of Smix increases, the globule size decreases, so the amount of Smix had a negative effect on the mean globule size but high concentration of surfactant and co-surfactant may cause ocular irritation. So, we restrain our formulation selection up to the Smix concentration of 40% from the selected phase diagram. The more surfactant ratios assisted the development of stable and shortened interfacial nanoemulsion films. Increasing the concentration of co-surfactant may enlarge this film and diffuse into the surfactant film along with lower mobility and viscosity of the interfacial film, which may decrease the radius of curvature of the nanodroplets (Hathout & Woodman, Citation2012).
PDI indicates the size distribution of nanoemulsion globules. The wider size distribution of globules may be a reason for the instability of NE and it may also affect the physicochemical properties, including release profiles of the drug from the formulations. Ideally, the PDI of NEs should be less than 1 for optimum results. PDI was negatively influenced by the amount of oil (X1) and less influenced by the amount of Smix (p-value < 0.05). The PDI of all the formulations was found in the range of 0.56 ± 0.15 to 1.3 ± 0.22. It has been observed that as the globule size decreases, the PDI increases and so it is very important to make suitable correlation between them to consider physicochemical properties and stability factor of the formulations.
Optimization by using desirability function
displays the response surface of the desirability function in a variable range of X1 and X2. The optimized LE-loaded NE formulation was accomplished using a desirability function to fulfill the anticipated goals concurrently for two responses are minimized droplet size and PDI. Mathematical equation from desirability function is used to convert multi-response into single response using multi-response optimization process (Jacobs, Citation2002). The results of response evaluations are in close agreement with observed values with less than 5%. The optimized levels of X1 and X2 were 12.65% and 39.6% while the predicted values of Y1 and Y2 were 40.22 nm and 0.7, respectively. This fact confirms that the 32 factorial design and desirability function are accurate and reliable approaches in the optimization process. The results of all other physicochemical parameters of the optimized batch like mean globule size, PDI, zeta potential, refractive index, % transmittance, PH, osmolarity and drug content are 41.50 ± 0.4 nm, 0.64, 31.22 ± 2.5 mV, 1.352 ± 0.04, 99.05 ± 0.20, 5.70 ± 0.29, 280.16 mOsmol/L and 99.05 ± 0.10, respectively. From that it was decided that formulated optimized nanoemulsion are appropriate for ophthalmic delivery after incorporation into the in-situ gel system.
Characterization of drug-loaded in situ NE gels
Ophthalmic dosage form must be clear enough and pH should be near to tear fluid. All the NE-ISG formulations (NE-ISG1-NEISG5) were homogenously clear and transparent with a pH in the range of 7.40–7.55. So, it can concluded that they will not affect the vision and irritation to the eyes. Poloxamers comprise of poly(oxyethylene) (PEO) and poly(oxypropylene) (PPO) units, with the general formula PEOx–PPOy–PEOx (Vadnere et al., Citation1984), in which PEO is mainly hydrophilic, whereas PPO is hydrophobic at higher temperatures, but in combined form, one can assume amphiphilic features and accumulation phenomena at higher temperatures (Ramzi et al., Citation1998). When the polymer concentration and the characteristic temperature are above a critical point, this triblock copolymer forms micelles (Zhou & Chu, Citation1987), which leads to increase in viscosity and tendency to forms gel at temperature above a critical point with respect to reversible thermo gelation property (Glatter et al., Citation1994; Bohorquez et al., Citation1999; Gupta et al., Citation2007; Koffi et al., Citation2008). Poloxamer 407 and Poloxamer 188 possess different PEO: PPO ratios and it was found by Choi et al. (Choi et al., Citation1998; Qi et al., Citation2007) that the optimal gelation temperature can be achieved by mixing altered quantities of Poloxamer 407 and Poloxamer 188 in the formulation. The optimum ophthalmic in-situ formulations should have a gelation temperature higher than the room temperature and a shift to gel at the conjunctiva sac temperature (34.5 ± 0.8 °C) (Kessel et al., Citation2010). So, we have selected NE-ISG2 as an optimum batch, because its gelation temperature is 34.5 °C. The results of all parameters like mean globule size, PDI, zeta potential, refractive index, % transmittance, PH, osmolarity and drug content are 70.85 ± 0.25 nm, 0.45, 31.65 ± 1.9 mV, 1.387 ± 0.07, 98.20 ± 0.45, 7.40 ± 0.29, 262.16 mOsmol/L and 98.82 ± 0.30 for optimized batch NE-ISG2.
Rheological property
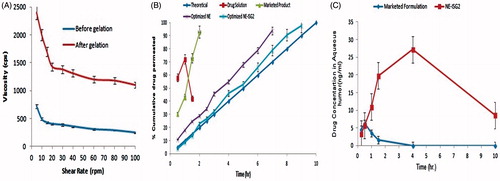
Viscosity of the ophthalmic dosage forms affect the residence time of the formulation and also affect the vision. Eye drops follows Newtonian-type behavior, so it cannot remain longer in the cul-de-sac of the eye. shows the rheological behavior of NE-ISG2 measured at different revolutions per minute before and after gelation. It has been observed from the figure that, viscosity of formulation after gelation is higher than the viscosity before gelation, which confirms the formation of gel form liquid. In both the cases, viscosity decreases, as the shear rate increases and it follows non-Newtonian type of flow with pseudo-plastic property. The viscosity of gel has been found in the range of 2400–1400 cps at every shear rate and it must not affect the vision of the eye and also increases the residence time of gel into eye. During blinking of the eyes, ocular shear rate has been changed and varies from 4250 to 28,500 s−1 (Srividya et al., Citation2001), which may not alter the viscosity of formulations too much. It is expected that this formulation will not present difficulty in blinking while undergoing gelation into eye because they have high viscosity at low shear rate and low viscosity at high shear rate, which favors ocular delivery.
Figure 4. (A) Rheological profile of NE-ISG5 before and after gelation, (B) comparison of ex-vivo transcorneal permeation, (C) comparison of Aqueous humor concentration–time profiles of NE-ISG2 and the marketed formulation in rabbits (mean ± SD, n = 5).
Ex-vivo transcorneal permeation
shows transcorneal permeation profile of all formulations and in the case of NE and NE-ISG2, drug permeation increased steadily with increase in time. A theoretical (zero order) drug-release profile was set to indicate the targeted drug release with 10% drug release in the first hour and remains with 10% rise every hour up to 10 h. Various kinetics models has been applied to all the formulations and it has been observed that NE and NE-ISG2 follows zero-order drug release with release profile of NE-ISG2 exactly matching with the theoretical profile, so we can conclude that following the development of the drug-loaded in situ NE gels, satisfactory sustained drug release were accomplished with the release of drug form dosage that lasts for 10 h. The T50% values of the dissolution profiles of NE-ISG2 and theoretical profile are 4.5 and 5 h, respectively, so it can be concluded that both are not significantly dissimilar (p > 0.05). The cumulative amount of LE permeated from NE-ISG2 was found to be slightly lower than that permeated from NE due to the lower diffusion of the LE from NE-ISG2 formulation because of the high viscosity of gel than that of the NE, so the diffusion of LE molecules in the gel is somewhat controlled due to increase in the diffusion path distance, and thus the release rate from gel is dropped down. Mathematical modeling of data showed that the dissolution profiles of NE and in-situ NE gels followed zero-order kinetics. The permeation flux was also calculated and no significant difference (p > 0.05) was detected amongst the corneal permeation flux of LE from NE-ISG2 (82.12 ± 3.70 μg/cm2/h) and that of the NE (94.57 ± 3.5 μg/cm2/h).
HET-CAM test
HET-CAM test was executed to identify the irritation potential of the optimized NE and NE-ISG2. Sodium chloride solution was taken as a control as it is practically nonirritant. HET-CAM is a speedy, sensitive and cheap test in which hatched eggs were used as a marginal circumstance between in-vivo and in-vitro systems. They do not have conflict with the ethical obligations. CAM has highly vascular-stratified tissue like conjunctiva tissues of the rabbit eyes, it responds to the injury with a comprehensive inflammatory process (Sina & Gautheron, Citation1994). From the scores obtained in the HET-CAM test, it is observed that a mean score of 0 was obtained for saline and optimized NE throughout the duration of study (10 h). The CAM exposed to NE-ISG2 displayed slightly visible membrane discoloration in all test egg (Egg 1, 2 and 3) after 4 h that did not aggravate in 8 h. But for last 2 h, two eggs (Egg 2 and 3) showed slight discoloration, thus a mean score of 0.66 was observed at 10 h. From that it may concluded that NE-ISG2 can be considered as mildly irritant after 8 h. This might be due to the rise in the viscosity of the formulation, once gel is formed. So, we can conclude that almost more than 80% of LE release and no irritation for 8 h confirmed the efficacy and safety of the NE-ISG2 even on repetitive use.
Pharmacokinetic study of LE in the rabbit aqueous humor
Solubility, electrical charge, ionization degree and lipophilic nature like physicochemical drug properties have the major role for the route and rate of transcorneal permeation (Xuanzhong et al., Citation2015). According to Mannermaa et al. (Citation2006), the optimal lipophilicity for corneal permeation resembles to log p values of 2–3. In the current work, LE is a lipophilic drug (log p = 3.04), which is suitable for transcorneal drug delivery. The drug pharmacokinetics in the aqueous humor after ocular instillation of NE-ISG2 and marketed product was evaluated in rabbits. The aqueous humor concentration–time profiles of LE evidently designate the capability of the NE-ISG2 to sustain the drug release upon ocular instillation as presented in . The notable alterations amongst the two formulations were statistically assessed by calculating Cmax, Tmax, MRT and AUC (0–10). The mean Cmax values of the marketed product and the NE-ISG2 were 6.254 and 27.152 ng/ml, respectively. The differences between the two formulations were statistically significant (p < 0.01). The delay in Tmax (from 0.50 to 4 h) as well as the prolongation in the MRT and increase in AUC(0–10) from 14.7 to 37.43 ng h/mL for the marketed formulation to the in-situ NE gel, respectively, could specify the sustained release features of the latter. These differences were shown to be statistically significant, p < 0.01. The increase in the ocular bioavailability of LE, judged from the AUC(0–10), was 2.54-fold. The higher ocular bioavailability of the in-situ NE gel could be connected to its capability to increase the corneal wettability and prolong the droplet residence time on the corneal epithelial layer. In addition, the lipophilic drug nature would minimize its partition from the oil droplets to the corneal epithelial membrane. On the other hand, the poor wettability and immediate removal from the pre-ocular surfaces of the marketed formulation add negative impacts on the ocular drug bioavailability. To recapitulate, the developed NE-ISG2 not only succeeded in controlling the rate of LE release in the rabbit aqueous humor, but also prospered in improving the ocular drug bioavailability, relative to the marketed formulation.
Conclusion
The developed cationic nanoemulsified in-situ ophthalmic gel of LE can be considered as an effective and superior alternative dosage form over marketed formulation for the treatment of various ocular inflammatory diseases due to higher permeation along with controlled drug release without compromising the safety and patient compliance. Furthermore, the presence of in-situ gelling polymer leads to longer residence of dosage form in the eye due to the transformation of NE into gel form which is not easily eroded or dissolved by tear. The sterilized NE-ISG2 in-situ NE gel was nonirritant to rabbits, succeeded in controlling the rate of LE release in the rabbit aqueous humor and improved the ocular drug bioavailability, relative to the marketed formulation. However, clinical benefits to the risk ratio of the formulation developed in this investigation by in vivo studies with humans will decide its appropriateness in the clinical practice.
Declaration of interest
The authors report no declarations of interest. The authors alone are responsible for the content and writing of this article.
Acknowledgements
The authors are highly thankful to Dr. Sachin Parmar, Mr. Tejas Sharma and Mr. Vishal Airao, faculties of Pharmacology Department for helping in the Animal study.
References
- Ammar H, Salama H, Ghorab M, Mahmoud A. (2009). Nanoemulsion as a potential ophthalmic delivery system for dorzolamide hydrochloride. AAPS PharmSciTech 10:808–19
- Ammar H, Salama H, Ghorab M, Mahmoud A. (2010). Development of dorzolamide hydrochloride in situ gel nanoemulsion for ocular delivery. Drug Dev Ind Pharm 36:1330–9
- Azeem A, Rizwan M, Ahmad F, et al. (2009). Nanoemulsion components screening and selection: a technical note. AAPS PharmSciTech 10:69–76
- Bentley M, Marchetti J, Ricardo N, et al. (1999). Influence of lecithin on some physical chemical properties of poloxamer gels: rheological, microscopic and in vitro permeation studies. Int J Pharm 193:49–55
- Bohorquez M, Koch C, Trygstad T, Pandit N. (1999). A study of the temperature-dependent micellization of pluronic F127. J Colloid Interface Sci 216:34–40
- Chhabra G, Chuttani K, Mishra A, Pathak K. (2011). Design and development of nanoemulsion drug delivery system of amlodipine besilate for improvement of oral bioavailability. Drug Dev Ind Pharm 37:907–16
- Chien Y. (1992). Novel drug delivery systems. New York: M. Dekker, 13–55
- Choi H, Oh Y, Kim C. (1998). In situ gelling and mucoadhesive liquid suppository containing acetaminophen: enhanced bioavailability. Int J Pharm 165:23–32
- Clark L, Bezwada P, Hosoi K, et al. (2004). Comprehensive evaluation of ocular toxicity of topical levofloxacin in rabbit and primate models. J Toxicol Cutan Ocul Toxicol 23:1–18
- Coffey MJ, Decory H, Lane SS. (2013). Development of a non-settling gel formulation of 0.5% loteprednol etabonate for anti-inflammatory use as an ophthalmic drop. Clin Ophthalmol 7:299–312
- Daull P, Lallemand F, Garrigue J. (2013). Benefits of cetalkonium chloride cationic oil-in-water nanoemulsions for topical ophthalmic drug delivery. J Pharm Pharmacol 66:531–41
- Dinh S, Liu P. (2003). Advances in controlled drug delivery. Washington, DC: American Chemical Society
- El-Laithy H, Nesseem D, El-Adly A, Shoukry M. (2011). Moxifloxacin-gelrite In Situ ophthalmic gelling system against photodynamic therapy for treatment of bacterial corneal inflammation. Arch Pharm Res 34:1663–78
- Felt O. (1999). Topical use of chitosan in ophthalmology: tolerance assessment and evaluation of precorneal retention. Int J Pharm 180:185–93
- Glatter O, Scherf G, Schillen K, Brown W. (1994). Characterization of a poly(ethylene oxide)-poly(propylene oxide) triblock copolymer (EO27-PO39-EO27) in aqueous solution. Macromolecules 27:6046–54
- Gupta H, Jain S, Mathur R, et al. (2007). Sustained ocular drug delivery from a temperature and pH triggered novel in situ gel system. Drug Deliv 14:507–15
- Han Y, Segall A. (2014). A validated specific stability-indicating RP-HPLC assay method for the determination of loteprednol etabonate in eye drops. J Chromatogr Sci 53:761–6
- Hathout R, Woodman T. (2012). Applications of NMR in the characterization of pharmaceutical microemulsions. J Control Release 161:62–72
- Hitendra SM, Surendra G. (2010). In situ gels of metoclopramide hydrochloride for intranasal delivery: in vitro evaluation and in vivo pharmacokinetic study in rabbits. Drug Deliv 17:19–27
- Jacobs M. (2002). Pharmaceutical balancing act. Chem Eng News 80:5
- Jain S, Soni V, Rawlins E. (2012). Bentley's textbook of pharmaceutics. New Delhi, India: Elsevier
- Juber A, Hefazat S, Sheeba F, et al. (2016). Nanoemulsion: for improved oral delivery of repaglinide. Drug Deliv 23:2026–34
- Kessel L, Johnson L, Arvidsson H, Larsen M. (2010). The relationship between body and ambient temperature and corneal temperature. Invest Ophthalmol Vis Sci 51:6593
- Kim Kin D. (2000). Simultaneous optimization of mechanical properties of steel by maximizing exponential desirability functions. J R Stat Soc Series C Appl Stat 49:311–25
- Koffi A, Agnely F, Besnard M, et al. (2008). In vitro and in vivo characteristics of a thermogelling and bioadhesive delivery system intended for rectal administration of quinine in children. Eur J Pharm Biopharm 69:167–75
- Kumar M, Pathak K, Misra A. (2009). Formulation and characterization of nanoemulsion-based drug delivery system of risperidone. Drug Dev Ind Pharm 35:387–95
- Lallemand F, Daull P, Benita S, et al. (2012). Successfully improving ocular drug delivery using the cationic nanoemulsion, novasorb. J Drug Deliv 2012:1–16
- Lawrence M, Rees G. (2000). Microemulsion-based media as novel drug delivery systems. Adv Drug Deliv Rev 45:89–121
- Lee V. (1990). Review: new directions in the optimization of ocular drug delivery. J Ocul Pharmacol Ther 6:157–64
- Lee V, Robinson J. (1979). Mechanistic and quantitative evaluation of precorneal pilocarpine disposition in albino rabbits. J Pharm Sci 68:673–84
- Ludwig A. (2005). The use of mucoadhesive polymers in ocular drug delivery. Adv Drug Deliv Rev 57:1595–639
- Mannermaa E, Vellonen K, Urtti A. (2006). Drug transport in corneal epithelium and blood-retina barrier: emerging role of transporters in ocular pharmacokinetics. Adv Drug Deliv Rev 58:1136–63
- Mathiowitz E, Chickering D, Lehr C. (1999). Bioadhesive drug delivery systems. New York: Marcel Dekker, 179–202
- Mitra A. (1993). Ophthalmic drug delivery systems. New York: Dekker, 1–27
- Miyazaki S, Suzuki S, Kawasaki N, et al. (2001). In situ gelling xyloglucan formulations for sustained release ocular delivery of pilocarpine hydrochloride. Int J Pharm 229:29–36
- Moreno M, Ballesteros M, Frutos P. (2003). Lecithin-based oil-in-water microemulsions for parenteral use: pseudoternary phase diagrams, characterization and toxicity studies. J Pharm Sci 92:1428–37
- Nanjawade B, Manvi F, Manjappa A. (2007). In situ-forming hydrogels for sustained ophthalmic drug delivery. J Control Release 122:119–34
- Pandit N. (1996). Loss of gelation ability of Pluronic® F127 in the presence of some salts. Int J Pharm 145:129–36
- Patel N, Thakkar V, Metalia V, et al. (2016). Formulation and development of ophthalmic in situ gel for the treatment ocular inflammation and infection using application of quality by design concept. Drug Dev Ind Pharm 42:1406–23
- Pathak M, Chhabra G, Pathak K. (2012). Design and development of a novel pH triggered nanoemulsified in-situ ophthalmic gel of fluconazole: ex-vivo transcorneal permeation, corneal toxicity and irritation testing. Drug Dev Ind Pharm 39:780–90
- Patton T, Robinson J. (1976). Quantitative precorneal disposition of topically applied pilocarpine nitrate in rabbit eyes. J Pharm Sci 65:1295–301
- Qi H, Chen W, Huang C, et al. (2007). Development of a poloxamer analogs/carbopol-based in situ gelling and mucoadhesive ophthalmic delivery system for puerarin. Int J Pharm 337:178–87
- Rabinovich-Guilatt L, Couvreur P, Lambert G, Dubernet C. (2004). Cationic vectors in ocular drug delivery. J Drug Target 12:623–33
- Ramzi M, Rochas C, Guenet J. (1998). Structure–properties relation for agarose thermoreversible gels in binary solvents. Macromolecules 31:6106–11
- Rice W. (1989). Analyzing tables of statistical tests. Evolution 43:223
- Sabna K, Abdul K, Ansari S, et al. (2015). Formulation of nanoemulsion: a comparison between phase inversion composition method and high-pressure homogenization method. Drug Deliv 22:455–66
- Samira K, Fariborz K, Amir A. (2016). Design and evaluation of oral nanoemulsion drug delivery system of mebudipine. Drug Deliv 23:2035–43
- Schopf L, Enlow E, Popov A, et al. (2014). Ocular pharmacokinetics of a novel loteprednol etabonate 0.4% ophthalmic formulation. Ophthalmol Ther 3:63–72
- Shafiq S, Shakeel F, Talegaonkar S, et al. (2007). Development and bioavailability assessment of ramipril nanoemulsion formulation. Eur J Pharm Biopharm 66:227–43
- Sieg J, Robinson J. (1977). Vehicle effects on ocular drug bioavailability ii: evaluation of pilocarpine. J Pharm Sci 66:1222–8
- Sina J, Gautheron P. (1994). A multitest approach to evaluating ocular irritation in vitro. Toxicol Methods 4:41–9
- Srividya B, Cardoza R, Amin P. (2001). Sustained ophthalmic delivery of ofloxacin from a pH triggered in situ gelling system. J Control Release 73:205–11
- Tayel S, El-Nabarawi M, Tadros M, Abd-Elsalam W. (2013). Promising ion-sensitive in situ ocular nanoemulsion gels of terbinafine hydrochloride: design, in vitro characterization and in vivo estimation of the ocular irritation and drug pharmacokinetics in the aqueous humor of rabbits. Int J Pharm 443:293–305
- Tenjarla S. (1999). Microemulsions: an overview and pharmaceutical applications. Crit Rev Ther Drug Carrier Syst 16:62
- Vadnere M, Amidon G, Lindenbaum S, Haslam J. (1984). Thermodynamic studies on the gel-sol transition of some pluronic polyols. Int J Pharm 22:207–18
- Vojnovic D, Moneghini M, Rubessa F, Zanchetta A. (1993). Simultaneaus optimization of several response variables in a granulation process. Drug Dev Ind Pharm 19:1479–96
- Weiming D, Yanfang L, Xucheng H, Guiling L. (2016). Bleomycin A6-loaded anionic liposomes with in situ gel as a new antitumoral drug delivery system. Drug Deliv 23:88–94
- Xuanzhong W, Shurong W, Yan Z. (2015). Advance of the application of nano-controlled release system in ophthalmic drug delivery. Drug Del Early 1–5
- Yuan Y, Li S, Mo F, Zhong D. (2006). Investigation of microemulsion system for transdermal delivery of meloxicam. Int J Pharm 321:117–23
- Zhou Z, Chu B. (1987). Anomalous association behavior of an ethylene oxide/propylene oxide ABA blocks copolymer in water. Macromolecules 20:3089–91