
 ?Mathematical formulae have been encoded as MathML and are displayed in this HTML version using MathJax in order to improve their display. Uncheck the box to turn MathJax off. This feature requires Javascript. Click on a formula to zoom.
Abstract
Topical and transdermal drug delivery has great potential in non-invasive and non-oral administration of poorly bioavailable therapeutic agents. However, due to the barrier function of the stratum corneum, the drugs that can be clinically feasible candidates for topical and transdermal delivery have been limited to small-sized lipophilic molecules. Previously, we fabricated a novel iontophoretic system using reverse electrodialysis (RED) technology (RED system). However, no study has demonstrated its utility in topical and/or transdermal delivery of poorly permeable therapeutic agents. In this study, we report the topical delivery of fluorescein isothiocyanate (FITC)–hyaluronic acid (FITC–HA) and vitamin C and the transdermal delivery of lopinavir using our newly developed RED system in the in vitro hairless mouse skin and in vivo Sprague–Dawley rat models. The RED system significantly enhanced the efficiency of topical HA and vitamin C and transdermal lopinavir delivery. Moreover, the efficiency and safety of transdermal delivery using the RED system were comparable with those of a commercial ketoprofen patch formulation. Thus, the RED system can be a potential topical and transdermal delivery system for various poorly bioavailable pharmaceuticals including HA, vitamin C, and lopinavir.
Introduction
Topical and transdermal drug delivery can offer great potential for non-invasive and non-oral administration of poorly bioavailable therapeutic agents (Kalia et al., Citation2004; Chen et al., Citation2016; Jacobs et al., Citation2016; Zidan et al., Citation2016). Drug delivery through the skin has merits in improving patient compliance and avoiding gastrointestinal irritation and hepatic first-pass effect (Baek & Cho, Citation2016; Jain et al., Citation2017). Moreover, topical delivery can enhance the efficiency of drug targeting to the skin and adjacent tissues, while transdermal delivery can provide a constant systemic exposure profile, potentially reducing several side effects caused by fluctuating blood drug concentrations (Jung et al., Citation2015; Patel et al., Citation2016; Rao et al., Citation2016). The outermost layer of the skin, i.e. the stratum corneum, has a multilamellar lipid structure reinforced with a dense network of keratin, which protect internal tissues against desiccation, infection, xenobiotic chemicals, and mechanical stress (Rawlings & Harding, Citation2004; Sadowski et al., Citation2017). However, owing to its barrier function, the drugs that can be clinically feasible candidates for topical and transdermal delivery have been severely limited to highly potent lipophilic molecules with low molecular weight (<500 Da) (Naik et al., Citation2000; Prausnitz et al., Citation2004; Hussain et al., Citation2016).
Among various delivery systems that can enhance drug penetration across the skin, iontophoretic systems have attracted great interest as a useful tool for hydrophilic and/or large-sized molecules (Banga, Citation2007; Sachdeva et al., Citation2010; Saluja et al., Citation2013). It is a non-invasive technique to drive a charged substance through the skin by a low level of current (typically <500 μA/cm2) generated from a small electrical potential (Calatayud-Pascual et al., Citation2011). However, the conventional iontophoresis-based transdermal delivery systems require a circuit system connected to an external power supply that is generally non-portable, non-disposable, hazardous, and expensive (Calatayud-Pascual et al., Citation2011; Vikelis et al., Citation2012; Saluja et al., Citation2013).
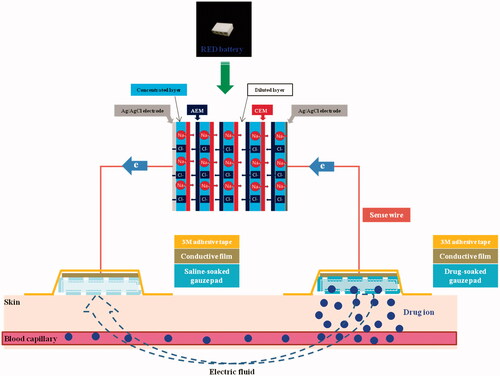
To remedy the disadvantage of conventional iontophoretic systems, we recently developed a novel iontophoretic system using reverse electrodialysis (RED) technology [RED-driven iontophoretic system (RED system); ] (Lee et al., Citation2017). This technology uses the salinity gradient energy produced by the controlled mixing of salt water (brine) and fresh water through alternating ion exchange membranes, which generates chemical potential difference over each membrane (Długołęcki et al., Citation2008; Post et al., Citation2008; Veerman et al., Citation2009). The electric current-generating part of the RED system (RED battery) was fabricated by stacking a series of cells containing a pair of anion- and cation-exchange membranes and placing them between two electrodes (Lee et al., Citation2017). The electric potential of the RED battery is the sum of the potential difference generated from all the membranes, which can be readily controlled by adjusting the size and numbers of the stacked cells. Moreover, the RED battery is disposable and eco-friendly because it uses only brine and water as fuel (Lee et al., Citation2017).
Figure 1. Schematic diagram of RED system.
In our previous study, we evaluated the electrical performance of the RED system and its enhancing effect on the permeation of fluorescein isothiocyanate (FITC)-poly-l-lysine (FITC-PLL) through the porcine skin (Lee et al., Citation2017). However, until date, no study has demonstrated the utility of the RED system in the topical and/or transdermal delivery of therapeutic agents whose dermal applications in clinical settings have been limited due to their poor skin permeability.
Hyaluronic acid (HA) is an anionic non-sulfated glycosaminoglycan comprising repeating polymeric disaccharides of glucuronic acid and acetylglucosamine (Mandal et al., Citation2016). It is an anti-wrinkle and moisturizing agent widely used in the area of pharmaceutics and cosmetics. It also plays pivotal roles in regulating the response of dermal fibroblasts and epithelial cells to skin injury and activating inflammatory cells to stimulate immune response during extracellular matrix synthesis and wound healing (Papakonstantinou et al., Citation2012). Moreover, it has been reported that the level of HA in the epidermis/dermis decreases to five percent of baseline with aging (Jegasothy et al., Citation2014). Vitamin C, a well-known antioxidant agent, can protect the skin from UV-induced reactive oxygen species and regulate collagen synthesis in the epidermis/dermis. It inhibits the action of tyrosinase which is the key enzyme in melanogenesis (Sauermann et al., Citation2004). Similar to HA, the level of vitamin C in the epidermis tends to decrease with aging (Leveque et al., Citation2002). Thus, delivering HA and vitamin C to the epidermis/dermis is a crucial prerequisite for exerting their therapeutic efficacy in skin health care. Lopinavir, a human immunodeficiency virus (HIV) protease inhibitor, has a low and variable oral bioavailability due to extensive intestinal and hepatic first-pass metabolism mediated by cytochrome P450 (CYP) 3A4 (ter Heine et al., Citation2011). To overcome the poor bioavailability, lopinavir is currently co-administered with low-dose ritonavir, a potent CYP3A4 inhibitor, for enhancing the systemic exposure to lopinavir. However, the use of bioavailability boosters in antiretroviral therapy may result in adverse drug–drug interaction and toxicity in HIV patients (Kumar et al., Citation2015). As transdermal drug administration can enhance and prolong systemic exposure compared with oral administration (Jung et al., Citation2015), the development of transdermal delivery systems of lopinavir is highly warranted to improve the efficacy and safety of lopinavir-based antiretroviral therapy. However, in clinical settings, the topical or transdermal delivery of the above-mentioned three therapeutic agents has been severely limited due to their large molecular size (about 10,000 Da for HA and 628.8 Da for lopinavir) and/or low lipophilicity (Log P = −1.8 for HA and −1.85 for vitamin C). Therefore, we selected FITC-HA, vitamin C, and lopinavir to demonstrate the feasibility of our RED system as an effective topical and transdermal drug delivery system for poorly permeable therapeutic agents.
Herein, we report the topical delivery of FITC-HA and vitamin C and the transdermal delivery of lopinavir using the RED system in the in vitro hairless mouse skin and in vivo Sprague–Dawley rat models. In addition, the transdermal delivery efficiency and safety of the RED system were compared with those of the Ketotop® patch, a commercial transdermal patch formulation of ketoprofen (Oh et al., Citation2017).
Materials and methods
Materials
FITC-PLL (FITC-linker-K-K-K-K-K; purity >93%; 1,160 Da) was purchased from Peptron Inc. (Daejeon, Korea). FITC-HA (purity >95%; 10,000 Da) was purchased from Creative PEGWorks Co. (Chapel hill, NC). Vitamin C, ketoprofen, and sodium lauryl sulfate (SLS) were purchased from Sigma-Aldrich Chemical Co. (St. Louis, MO). Ketotop® patch was purchased from Handok Pharmaceutical Co., Ltd. (Seoul, Korea). Lopinavir was purchased from Toronto Research Chemicals Inc. (Toronto, Ontario, Canada). Valsartan was purchased from Tokyo Chemical Industry Co., Ltd. (Tokyo, Japan). All other reagents were of analytical grade and used without further purification
Preparation and characterization of RED system
The RED system was fabricated by our previously reported method with slight modifications (Lee et al., Citation2017). In brief, the RED system used in this study comprised RED battery, sense wire (Keithley Instruments Inc., Cleveland, OH), conductive carbon film (Suzhou HC Plastic Co. Ltd., Anhui, China), and gauze pad (for drug loading; KM Supplies Inc., Los Angeles, CA) (). The RED battery comprised electrodes, non-woven fabrics, cation exchange membranes (CEMs), and anion exchange membranes (AEMs). Homogeneous SelemionTM CMV and AMV membranes (Asahi Glass CO. Ltd., Tokyo, Japan) were used as the CEMs and AEMs, respectively. A non-woven fabric (SP60, NamYang Nonwoven Fabric CO. Ltd., Ansan, Korea) with 0.3-mm thickness was used in both the concentrated and diluted layers. Sodium chloride (NaCl) solution was added to the concentrated layer and dried. The Ag/AgCl electrode was fabricated by an electroplating method. The bottom and lateral sides of the RED battery were tightly sealed with a typical epoxy to avoid any leaks. The upper side of the RED battery was kept open to allow the supply of diluted NaCl solution. The active area for ion exchange in eight cell pairs was 2.4 cm × 0.6 cm. To confirm the generation of electric current from the RED system, a bulb lighting test was performed (see the Supplementary Information, Video S1 and Figure S1).
Animals
Male hairless mice (6–8 weeks of age) and male Sprague–Dawley (SD) rats (5 weeks of age) were used for the in vitro and in vivo studies, respectively. They were purchased from OrientBio Inc. (Seongnam, Korea) and maintained in a clean room (Animal Center for Pharmaceutical Research, College of Pharmacy, Seoul National University) at a temperature of 20–23 °C with a 12/12-h light (7 am–7 pm)/dark (7 pm–7 am) cycle and a relative humidity of 50 ± 5%. The animals were housed in metabolic cages (Tecniplast USA Inc., West Chester, PA) under filtered and pathogen-free air, with food (Agribrands Purina Canada Inc., Levis, QC, Canada) and water available ad libitum. Experimental protocols for the current animal studies were reviewed by the Animal Care and Use Committee of the College of Pharmacy, Seoul National University (Mouse study: SNU-111007-4-2; Rat study: SNU-160311-3-1), in accordance with the National Institutes of Health’s Guide for the Care and Use of Laboratory Animals (National Institutes of Health Publication Number 85-23, revised 1985).
Application of RED system for in vitro studies
Keshary–Chien diffusion cells with a surface area of 4.41 cm2 at 32 °C were used for in vitro skin deposition and permeation studies. After sacrificing hairless mice by cervical dislocation, the dorsal skin was cut to about 5 cm × 5 cm and the subcutaneous fat was removed. Then, the skin was fixed tightly between the donor and receptor cells, laying the stratum corneum toward the donor cells. A gauze pad soaked with drug solution was placed on the stratum corneum side of skin (donor cells). Then, the conductive carbon film was mounted on the gauze pad and tightly fixed on the skin with 3 M adhesive tape. The edge of the film was connected to one of the two electrodes (either the anode or cathode) of the RED battery using sense wire. The other electrode of the RED battery was extended with Ag/AgCl wire and dipped into the receptor cells which were filled with 22.0-mL PBS (pH 7.4; consisting of 1.1 mM KH2PO4, 5.6 mM NaHPO4, and 155 mM NaCl) and continuously stirred with magnetic bar (600 rpm). The RED-driven iontophoretic reaction was initiated by adding NaCl solution to the upper side of the RED battery. The images of the set up of RED system applied to the diffusion cells for the in vitro skin deposition and permeation study are provided in the Supplementary Information (Figure S2A).
CLSM analysis
The CLSM analysis was performed as previously described (Wang et al., Citation2011). The FITC-PLL or FITC-HA-loaded RED system (RED) was applied on the stratum corneum side of the skin fixed in the Keshary–Chien diffusion cells as described above. Gauze pad of donor side was soaked with FITC-PLL (0.116 mg) or FITC-HA (0.2 mg) dissolved in PBS. In the RED system, the FITC-PLL or FITC-HA-loaded part was connected to the cathode of the RED battery. For comparison, the FITC-PLL or FITC-HA-soaked gauze pad without the RED system (control) was applied to the other diffusion cells. At 1 h and 6 h after the application of the control and RED systems, the skin was removed from the diffusion cells, washed with PBS, cut to 1 cm × 1 cm, and placed on a glass slide, laying the stratum corneum side faced downward. A CLSM (TCS SP8 X; Leica Microsystems, Ltd., Wetzlar, Germany) was employed to visualize the distribution of FITC-PLL and FITC-HA applied on the hairless mouse skin. The system was equipped with an white-light laser source whose fluorescence emission wavelength was 530 nm. Z-stacks profiles of the prepared skin samples were generated by capturing individual images from the surface of the skin to the interior at an interval of 3 µm. A fluorescent signal emitted from FITC-PLL or FITC-HA was represented by green color. The intensity of the fluorescent signal was quantified using LAS-AF-Lite software program (Version 2.6.3; Leica Microsystems, Ltd., Wetzlar, Germany).
In vitro hairless mouse skin deposition study
For the in vitro skin deposition study of vitamin C, gauze pad of donor side was soaked with vitamin C (12.5 mg) dissolved in PBS and applied on the stratum corneum side of skin fixed in the diffusion cell as described above. The vitamin C-loaded part was connected to the cathode of the RED battery for the RED system group, while the control group was not. At 6 h after the application of the control and RED systems, the skin was removed from the diffusion cells and washed five times with 50% methanol (5 mL each time). The washing procedure was validated and found to remove >95% of the initial dose applied on the skin surface at time zero (Singh et al., Citation2010). The amount of vitamin C deposited in the stratum corneum was determined by a tape stripping method (Gopee et al., Citation2009; Lademann et al., Citation2009; Rissmann et al., Citation2009; Aripin et al., Citation2013). In brief, a cellophane adhesive tape (CuDerm Co., Dallas, TX) was pressed on the skin surface ten times with a roller of 1 kg in weight (the weight of the roller itself was used to press the tape) and then pulled off with one fluent stroke. This tape striping procedure was repeated 10 times using one tape at each repetition. The tape samples were extracted with 3 mL of 50% methanol for 3 h and centrifuged at 16,100 × g for 5 min. The skin samples whose stratum corneum was removed (epidermis and dermis) were chopped, collected into a 15-mL tube containing 3 mL of 50% methanol, homogenized using ULTRA-TURAX® T25basic (IKA, Staufen, Germany), and centrifuged at 16,100 × g for 5 min. The amount of vitamin C in the supernatant was determined by LC-MS/MS analysis.
In vitro hairless mouse skin permeation study
The in vitro skin permeation studies of lopinavir and ketoprofen were performed as described above. For lopinavir, 6.5 mg of lopinavir dissolved in 100% propylene glycol was loaded in gauze pad, and it was connected to the anode of the RED battery, while the control group was not. For ketoprofen, 3.86 mg of ketoprofen dissolved in 50% propylene glycol was loaded in gauze pad, and it was connected to the cathode of the RED battery, while the control group was not. In addition, the commercial Ketotop® patch (3.86 mg as ketoprofen) without the RED system was applied in the same manner as the control group. At 1, 2, 3, 4, 5, 6, 7, 8, 9, and 10 h after the application, 0.5-mL aliquots were taken from the receptor cell and replaced immediately with an equal volume of fresh receptor medium. The amount of lopinavir and ketoprofen in the samples was determined by LC-MS/MS analysis.
In vivo pharmacokinetic study in rats
The abdominal hair of rats was removed using an electric clipper and depilatory cream. After 1 d, the rats were anesthetized with intramuscular injection of zoletil (Virbac Korea Co. Ltd., Seoul, Korea), and their femoral artery was cannulated with a polyethylene tube (PE-50; Clay Adams, Parsippany, NJ) filled with heparinized saline (20 IU/mL) to prevent blood clotting (Heo et al., Citation2016; Kim et al., Citation2017). Then, two gauze pads (one soaked with drug solution and other with saline) were placed on the shaven abdominal skin spaced slightly apart. Then, the conductive carbon film was mounted on each of the two gauze pads and they were tightly fixed on the skin with 3 M adhesive tape. The edge of each of the two films was connected to each of the two electrodes of the RED battery using sense wire. The RED-driven iontophoretic reaction was initiated in the same manner as that in the in vitro study. The images of the rats fixed on a plate for in vivo rat studies using the RED system are provided in the Supplementary Information (Figure S2B). The same experimental conditions as those tested in the in vitro skin permeation studies of lopinavir (control and RED) and ketoprofen (control, RED, and Ketotop®) were applied on the shaven abdominal skin of rats as described above. About 200-μL aliquots of blood were collected from the femoral artery at 0.5, 1, 2, 3, 4, 6, 9, 12, and 24 h after the transdermal application. Plasma samples were obtained by centrifugation at 16,100 × g for 5 min and stored at −80 °C until LC-MS/MS analysis.
In vivo dermal toxicity study in rats
To assess the skin irritation caused by the RED system, the rat skin erythema test was performed using a spectrophotometer (CM-2500d; Konica Minolta Inc., Tokyo, Japan) as previously described (Banks et al., Citation2010; Kadam & Chuan, Citation2016). In brief, the abdominal hair of rats was removed using an electric clipper and depilatory cream. Saline solution, saline-soaked gauze dressing without the RED system, and the same experimental group as those tested in the in vitro skin permeation studies of ketoprofen (control, RED, and Ketotop®) were applied on the shaven abdominal skin of rats as described above. After 1 and 24 h, the tested formulations were removed carefully from the skin, and the skin erythema were measured using the spectrophotometer, which projects white light onto the skin and measures the color of light reflected from the skin. The erythema index was calculated from the following equation:
(1)
(1)
where Ir is the intensity of red component such as hemoglobin (R value) of reflected light and Ig is the intensity of green component such as bilirubin (G value) of reflected light.
LC-MS/MS analysis of vitamin C, lopinavir, and ketoprofen
The amount of vitamin C in mouse skin homogenate samples was determined by LC-MS/MS analysis. The samples were diluted adequately with mobile phase solution [acetonitrile: DW containing 0.2% formic acid (70:30, v/v)] and transferred into the MS vials and a 3-µL aliquot was injected into Agilent LC-MS/MS system (Agilent Technologies, Palo Alto, CA) through Poroshell EC C18 column (50 mm × 3.0 mm, 2.6 µm; Agilent Technologies, Palo Alto, CA). MS detection was operated in the multiple reaction monitoring (MRM) mode with negative electrospray ionization (ESI). The isocratic mobile phase was run at a flow rate of 0.3 mL/min. The retention time of vitamin C was 1.7 min. The signal-to-noise ratio on LLOQ (100 ng/mL) was higher than 5.0 and there was no interference around the peak of vitamin C (Figure S3). The calibration standard samples were prepared with a final concentration of 100–5000 ng/mL. The calibration curves for lopinavir were linear with the r2 of more than 0.999.
The concentrations of lopinavir and ketoprofen in buffer solution used in the receptor cells (buffer samples) and rat plasma samples were determined by LC-MS/MS analysis. A 3-µL aliquot of the pretreated samples was injected into an Agilent LC-MS/MS system (Agilent Technologies, Palo Alto, CA) operated in the multiple reaction monitoring (MRM) mode with positive electrospray ionization (ESI). For the analysis of lopinavir, the samples were injected onto Poroshell EC C18 column (50 mm × 3.0 mm, 2.6 µm; Agilent Technologies, Palo Alto, CA). The isocratic mobile phase composed of acetonitrile and DW containing 0.2% formic acid (75:25, v/v) was run at a flow rate of 0.4 mL/min. The retention times of lopinavir and IS were 2.6 and 2.1 min, respectively. The signal-to-noise ratio on LLOQ (5.0 ng/mL) was higher than 5.0 and there was no interference around the peak of lopinavir. The calibration standard samples were prepared with a final concentration of 5.0–1000 ng/mL. The calibration curves for lopinavir were linear with the r2 of more than 0.999.
For the analysis of ketoprofen, the prepared samples were injected onto Hypersil BDS C18 column (50 mm × 4.6 mm, 5 µm; Thermo Fisher Scientific Co., Waltham, MA). The isocratic mobile phase, composed of acetonitrile and DW containing 0.2% formic acid (30:70, v/v), was run at a flow rate of 0.3 mL/min. The retention times of ketoprofen and IS were 0.80 and 0.77 min, respectively. The signal-to-noise ratio on LLOQ (20.0 ng/mL) was higher than 5.0 and there was no interference around the peak of ketoprofen. The calibration standard samples were prepared with a final concentration of 20.0–5000 ng/mL. The calibration curves for ketoprofen were linear with the r2 of more than 0.999. The analytical data were processed using the MassHunter Workstation Software Quantitative Analysis (vB.05.00; Agilent Technologies, Palo Alto, CA). The analytical conditions used for the mass detection of the analytes are summarized in .
Table 1. Mass detector parameters used for the analysis of vitamin C, lopinavir, ketoprofen, and valsartan (IS).
Data analysis
In vitro skin permeation parameters were calculated by plotting the cumulative amount of drug permeated through the skin per unit area versus time. The slope of the linear portion in the plot was calculated as the flux (μg/h/cm2) (Ibrahim et al., Citation2015; Salah et al., Citation2017). The lag time was calculated by extrapolating the linear portion to the X-axis of the plot (Rao et al., Citation2015; Salah et al., Citation2017). Non-compartmental analysis was performed using the WinNonlin software (Version 4.0; Certara USA Inc., Princeton, NJ) to determine the in vivo pharmacokinetic parameters. The peak drug concentration in plasma (Cmax) and time to reach Cmax (Tmax) were read directly from the observed data points. The area under the plasma drug concentration versus time curve from time 0 to 24 h (AUClast) was calculated by the linear trapezoidal method. The drug concentration at steady state (Css) was calculated by dividing the AUClast by time (24 h).
Statistical analysis
All data were expressed as means ± standard deviation. A p value of less than .05 was considered to be statistically significant using a two-tailed unpaired Student’s t-test or one-way ANOVA test with Tukey’s multiple comparison.
Results
Effects of RED system on skin distribution of FITC-PLL and FITC-HA
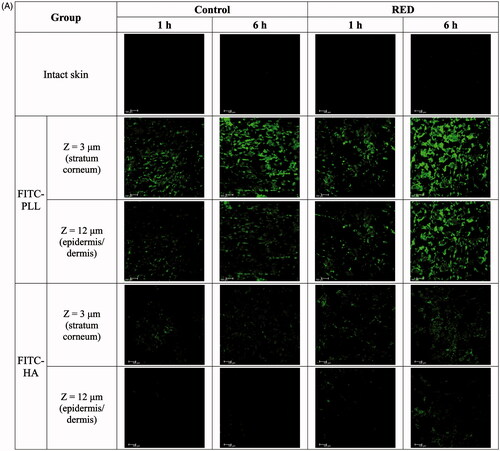
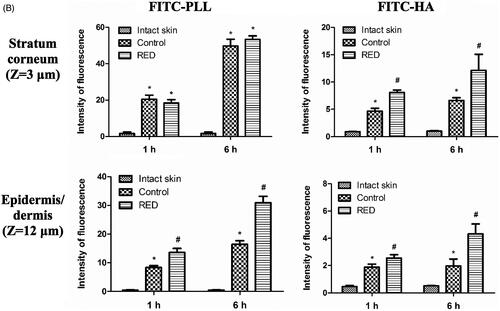
To assess the enhancement of skin permeation by the RED system, the skin distribution of FITC-PLL and FITC-HA was visualized by confocal laser scanning microscopy (CLSM) with or without the application of RED system. , S5, and S6 show the Z-stack, X/Z penetration, and X/Y/Z penetration CLSM images of hairless mouse skin at 1 h and 6 h after the application of FITC-PLL- or FITC-HA-loaded control or RED system. The Z-stack images at a skin depth of 3 μm for FITC-PLL and FITC-HA, respectively, were representative of the stratum corneum, while those at 12 μm were representative of the epidermis/dermis (). The fluorescence intensities at the stratum corneum and epidermis/dermis skin depth have been summarized in . As shown in , no background green fluorescence was observed in the intact skin. Overall, the fluorescence density of FITC-PLL and FITC HA tended to be higher at 6 h than at 1 h as well as markedly higher in the FITC-PLL-loaded groups than in the FITC-HA-loaded groups. Furthermore, the CLSM images at various skin depths demonstrated that both FITC-PLL and FITC-HA were absorbed deeper into the skin following the RED system application and FITC-PLL showed stronger fluorescence intensity than FITC-HA (Figures S5 and S6). As shown in , for FITC-PLL, no significant difference in fluorescence density values at the stratum corneum was observed between the control and RED groups. However, the fluorescence density value at the epidermis/dermis was significantly higher in the RED group than in the control group. For FITC-HA, the fluorescence density values at the stratum corneum and epidermis/dermis were significantly higher in the RED group than in the control group.
Figure 2. Z-stack CLSM images (A) and fluorescence intensities (B) at the stratum corneum and epidermis/dermis of hairless mouse skin at 1 h and 6 h after the application of FITC-PLL- or FITC-HA-soaked gauze dressing without the RED system (control) and FITC-PLL- or FITC-HA-loaded RED system (RED) on the mouse skin fixed in the diffusion cells. A fluorescent signal emitted from FITC-PLL or FITC-HA was represented by green color. The scale bars represent 100 μm. The rectangular bars and their error bars represent the means and standard deviations (n = 3–4). The asterisk (*) represents a value significantly different from that of the intact skin group, and the pound sign (#) represents a value significantly different from that of the control group (p < .05).
Effects of RED system on in vitro skin deposition of vitamin C
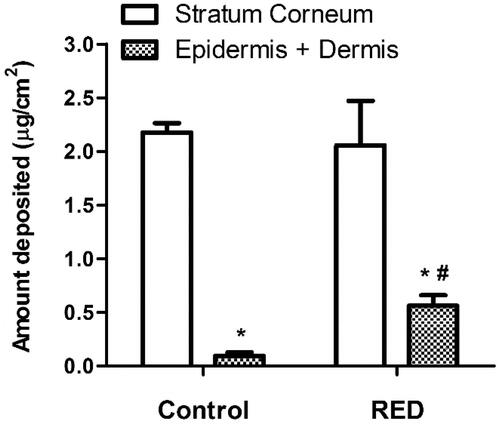
The effects of RED system on the skin deposition of vitamin C, an antioxidant agent, were investigated. shows the amount of vitamin C deposited in the stratum corneum and epidermis/dermis of hairless mouse skin at 6 h after the application of vitamin C-loaded control or RED system on the skin fixed in the diffusion cells. Regardless of RED system application, the vitamin C deposition was significantly higher in the stratum corneum than in the epidermis/dermis. Notably, the vitamin C deposition in the epidermis/dermis significantly increased with the application of RED system, while that in the stratum corneum was comparable between the RED and control groups.
Figure 3. The amount of vitamin C deposited in the stratum corneum and epidermis/dermis of hairless mouse skin at 6 h after the application of vitamin C-soaked gauze dressing without the RED system (control) and vitamin C-loaded RED system (RED) on the mouse skin fixed in the diffusion cells. The rectangular bars and their error bars represent the means and standard deviations (n = 3–4). The asterisk (*) represents a value significantly different from that of the stratum corneum, and the pound sign (#) represents a value significantly different from that of the control group (p < .05).
Effects of RED system on in vitro skin permeation and in vivo pharmacokinetics of lopinavir
shows the in vitro hairless mouse skin permeation profiles of lopinavir after the application of lopinavir-loaded control or RED system on the skin surface. The relevant skin permeation parameters are listed in . However, as shown in , no discernible linear portion was observed in the terminal phases of the plotted curves. Thus, the flux and lag time were not determined in the present lopinavir study. The Q10h values for lopinavir were significantly higher by 5.25-fold in the RED group (99.5% of initial dose) than in the control group (19.0% of initial dose). shows the plasma pharmacokinetic profiles of lopinavir after the transdermal application of lopinavir-loaded control or RED system in rats. The relevant pharmacokinetic parameters are listed in . After the application of the RED system, plasma levels of lopinavir increased more rapidly and reached a peak (Cmax) at 4 h (Tmax), which was significantly earlier than that in the control group. The Cmax, Css, and AUClast values of lopinavir were also significantly higher in the RED group (2.68-, 2.21-, and 2.21-folds, respectively) than in the control group.
Figure 4. In vitro hairless mouse skin permeation profiles of lopinavir after the application of lopinavir-soaked gauze dressing without the RED system (control) and lopinavir-loaded RED system (RED) on the mouse skin fixed in the diffusion cells (A) and the arterial plasma concentration versus time profiles of lopinavir after the transdermal application of lopinavir-soaked gauze dressing without the RED system (control) and lopinavir-loaded RED system (RED) in rats (B). Bullet symbols and their error bars represent the means and standard deviations (n = 3–4). The asterisk (*) represents a value of the RED group significantly different from that of the control group (p < .05).
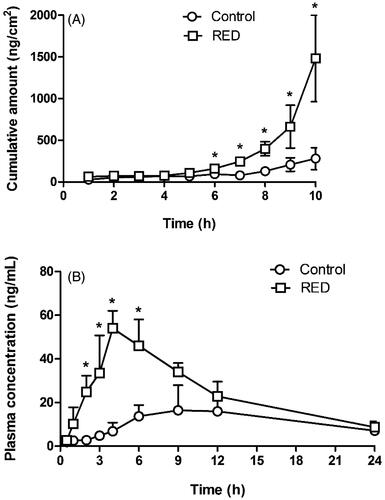
Table 2. In vitro skin permeation parameters of lopinavir after the application of lopinavir-soaked gauze dressing without the RED system (control) and lopinavir-loaded RED system (RED) on the hairless mouse skin fixed in the diffusion cells (n = 3–4).
Table 3. Pharmacokinetic parameters of lopinavir after the transdermal application of lopinavir-soaked gauze dressing without the RED system (control) and lopinavir-loaded RED system (RED) in rats (n = 3–4).
Effects of RED system on in vitro skin permeation and in vivo pharmacokinetics of ketoprofen
shows the in vitro hairless mouse skin permeation profiles of ketoprofen after the application of ketoprofen-loaded control, RED system, or Ketotop® on the skin surface. The relevant skin permeation parameters are listed in . For comparison, Ketotop®, a commercial ketoprofen patch formulation, was applied on the hairless mouse skin without the RED system. The flux of ketoprofen at steady state and Q10 h were significantly higher in the RED group (by 4.68- and 4.32-folds, respectively) than in the control group. The slopes through the linear portions were readily determined by linear regression analysis with the coefficients of determination (r2) of more than 0.95. The Q10 h values for the control, RED, and Ketotop® groups were equivalent to 4.83%, 20.9%, and 19.8% of initial dose. These values of RED and Ketotop® were also significantly higher (4.24- and 4.10-folds, respectively) than the control group. However, the lag time of ketoprofen among the three groups was not significantly different. shows the plasma pharmacokinetic profiles of ketoprofen after the transdermal application of ketoprofen-loaded control, RED system, or Ketotop® in rats. The relevant pharmacokinetic parameters are listed in . The application of RED system resulted in significantly higher Cmax, Css, and AUClast values (2.20-, 2.10-, and 2.10-folds, respectively) than the control group. Moreover, these values were comparably high with the Ketotop® group, except the lag time.
Figure 5. In vitro hairless mouse skin permeation profiles of ketoprofen after the application of ketoprofen-soaked gauze dressing without the RED system (control), ketoprofen-loaded RED system (RED), and Ketotop® patch without the RED system (Ketotop®) on the mouse skin fixed in the diffusion cells (A) and the arterial plasma concentration versus time profiles of ketoprofen after the transdermal application of ketoprofen-soaked gauze dressing without the RED system (control), ketoprofen-loaded RED system (RED), and Ketotop® patch without the RED system (Ketotop®) in rats (B). Bullet symbols and their error bars represent the means and standard deviations (n = 3–4). The asterisk (*) represents a value of the RED group significantly different from that of the control group (p < .05), and the pound sign (#) represents a value of the Ketotop® group significantly different from that of the control group (p < .05).
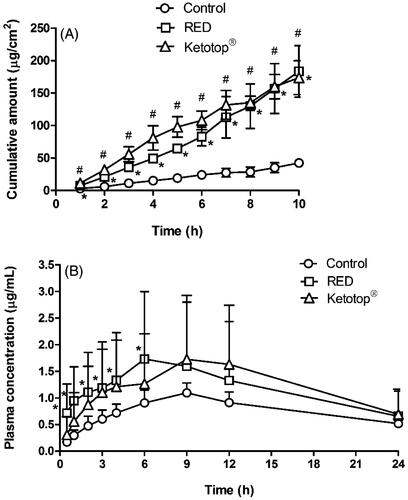
Table 4. In vitro skin permeation parameters of ketoprofen after the application of ketoprofen-soaked gauze dressing without the RED system (control), ketoprofen-loaded RED system (RED), and Ketotop® patch without the RED system (Ketotop®) on the hairless mouse skin fixed in the diffusion cells (n = 3–4).
Table 5. Pharmacokinetic parameters of ketoprofen after the transdermal application of ketoprofen-soaked gauze dressing without the RED system (control), ketoprofen-loaded RED system (RED), and Ketotop® patch without the RED system (Ketotop®) in rats (n = 3–4).
In vivo dermal toxicity study in rats
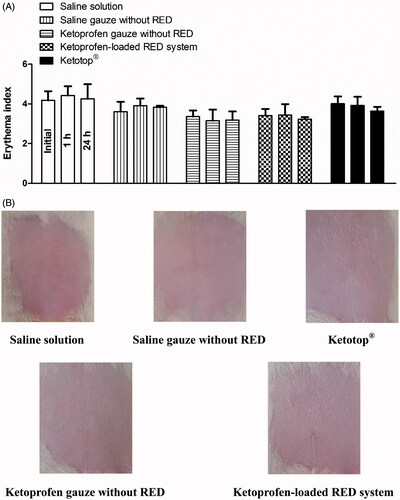
Skin irritation caused by the developed RED system was assessed using the rat skin erythema test. shows the erythema indices at 0, 1, and 24 h after the transdermal application of saline solution, saline-soaked gauze dressing, ketoprofen-loaded gauze dressing and RED system, and Ketotop® patch in rats. No significant difference in the erythema indices was observed at the three time points among all the experimental groups tested (). Images of rats at 1 h (Figure S7) and 24 h () also demonstrate that no discernible changes in skin were observed during the entire period of the toxicity study.
Figure 6. Erythema indices of skin at 0, 1, and 24 h (A) and its photographs at 24 h (B) after the transdermal application of saline solution, saline-soaked gauze dressing without the RED system (Saline gauze without RED), ketoprofen-soaked gauze dressing without the RED system (Ketoprofen gauze without RED), ketoprofen-loaded RED system, and Ketotop® patch without the RED system (Ketotop®) in rats. The rectangular bars and their error bars represent the means and standard deviations (n = 3–4).
Discussion
The present study provides novel data on the application of our newly developed RED system for the topical delivery of FITC-HA and vitamin C and the transdermal delivery of lopinavir and ketoprofen in hairless mouse skin and Sprague–Dawley rat models. As our RED system is intended for dermal use, it needs to be sufficiently small and lightweight, and hence, the size of the RED battery was fixed at eight pairs of cells. In our previous study, after the electrical reaction was initiated by adding brine to the RED battery, the electric current produced from the RED system increased rapidly, reaching a peak within a few minutes, and then decreased slowly over 1 h (Lee et al., Citation2017). Moreover, in a preliminary test, we measured the current density produced from the RED system applied on the hairless mouse and human skin (n = 3 for each group). The maximal current density values observed in three mice ranged from 372 to 575 μA/cm2 and in three humans ranged from 379 to 459 μA/cm2. This result implies that the electrical performance of the RED system is comparable to that of conventional iontophoretic systems (typically <500 μA/cm2) (Calatayud-Pascual et al., Citation2011). Therefore, we attempted to apply the RED system for topical and/or transdermal delivery of therapeutic agents whose dermal applications have been limited due to their physicochemical properties.
Our previous study reported the cross-sectional CLSM images of FITC-PLL distribution within the porcine skin (Lee et al., Citation2017). However, in the present study, the CLSM analysis was performed in the Z-stack image-generating mode with intact hairless mouse skin. Thus, we performed the Z-stack CLSM analysis with FITC-PLL to confirm the validity of the modified experimental conditions related to the CLSM analysis. As shown in , the fluorescence density of FITC-PLL at the skin depths of 12 and 30 μm (corresponding to the epidermis/dermis) was significantly enhanced by the RED system, which shows similar results to those reported in our previous study (Lee et al., Citation2017). Furthermore, the CLSM analysis with FITC-HA showed that the fluorescence density of FITC-HA at a skin depth of 3 and 12 μm (corresponding to the stratum corneum and epidermis/dermis, respectively) was significantly enhanced by the RED system (). This result clearly indicates that the RED system significantly enhanced the permeation of FITC-HA across the stratum corneum and its deposition in the epidermis/dermis. Similarly, as shown in , the RED system significantly enhanced the deposition of vitamin C in the epidermis/dermis. As the epidermis/dermis is considered as the primary site of action of topically administered HA and vitamin C, it is plausible that the current RED system can enhance their biological and pharmacological effects on the skin. Moreover, the in vitro skin permeation parameter (Q10) and in vivo pharmacokinetic parameters (Css and AUC) of lopinavir significantly increased when the RED system was applied ( and ), suggesting that the RED system successfully enhanced the skin permeation and systemic absorption of transdermally administered lopinavir.
It is well known that iontophoretic system enhances molecular transport across the skin through two main mechanisms: electrorepulsion and electroosmosis (Calatayud-Pascual et al., Citation2011). Electrorepulsion, also known as electromigration, refers to the ordered movement of ions through the skin by direct interaction with the applied electric field (Kalia et al., Citation2004). In this mechanism, the repulsion between a charged molecule and electrode of the same polarity acts as a driving force for the permeation of the charged molecule through the skin. As vitamin C and HA exist primarily in the form of anion at the pH of skin, it is plausible that the application of RED system enhanced the topical delivery of the two substances by electrorepulsion. Meanwhile, skin can be viewed as a negatively charged membrane at physiological pH. When an electrical current is applied across the skin, the net flow of solvent can occur in the direction of movement of the counter ions with positive charge, which is referred to as electroosmosis (Calatayud-Pascual et al., Citation2011). The electroosmotic flow of solvent can carry any solutes in the anode-to-cathode direction though the skin, acting as an additional driving force, particularly for the permeation of neutral and large-sized molecules (Guy et al., Citation2001). As lopinavir exists as a neutral molecule at the pH of skin, it is suggested that the RED system enhanced its transdermal delivery by electroosmosis. However, further investigation is required to clarify the exact mechanism of the effects of the RED system on the topical and transdermal delivery of the therapeutic agents observed in this study.
The efficiency of transdermal delivery and skin irritation was compared between the RED system and Ketotop® patch, a commercially available transdermal patch formulation of ketoprofen. As shown in and , the extent of increases in the in vitro skin permeation parameters (flux and Q10) and in vivo pharmacokinetic parameters (Css and AUC) of ketoprofen were comparable between the two groups. Moreover, the results shown in and S7 indicate that no skin irritation was observed after applying either. These results suggest that the application of RED system can offer transdermal delivery efficiency and safety profiles equivalent to those of the commercial available Ketotop® patch. Furthermore, we expect that the RED system can be readily developed as a potable, compact, and disposable patch formulation, which can be a good alternative to conventional iontophoresis systems.
Conclusion
The present study demonstrated that our novel RED-driven iontophoretic system significantly enhanced the efficiency of topical and transdermal delivery of HA, vitamin C, and lopinavir. Moreover, the transdermal delivery efficiency and safety of the RED system were shown to be comparable with those of the commercial ketoprofen patch formulation. To the best of our knowledge, this is the first study on the utility of the RED-driven iontophoretic system for topical and transdermal drug delivery. We believe that the RED system can serve as an efficient topical and transdermal delivery system for various poorly bioavailable therapeutic agents, including HA, vitamin C, and lopinavir, in the near future.
IDRD_Kim_et_al_Supplemental_Content.zip
Download Zip (15.4 MB)Acknowledgements
This research was supported by the National Research Foundation of Korea (NRF), funded by the Korean government (MSIP) (Nos. 2009-0083533 and NRF-2017R1D1A3B03030252).
Disclosure statement
The authors report no conflicts of interest in this work. The authors alone are responsible for the content and writing of the paper.
Additional information
Funding
Related Research Data
References
- Aripin NF, Hashim R, Heidelberg T, et al. (2013). Effect of vesicle’s membrane packing behaviour on skin penetration of model lipophilic drug. J Microencapsul 30:265–73.
- Baek JS, Cho CW. (2016). Transdermal delivery of tadalafil using a novel formulation. Drug Deliv 23:1571–7.
- Banga AK. (2007). Theme section: transdermal delivery of proteins. Pharm Res 24:1357–9.
- Banks SL, Pinninti RR, Gill HS, et al. (2010). Transdermal delivery of naltrexol and skin permeability lifetime after microneedle treatment in hairless guinea pigs. J Pharm Sci 99:3072–80.
- Calatayud-Pascual MA, Balaguer-Fernandez C, Serna-Jimenez CE, et al. (2011). Effect of iontophoresis on in vitro transdermal absorption of almotriptan. Int J Pharm 416:189–94.
- Chen S, Qin M, Han Y, et al. (2016). Assessment of the efficacy of drug transdermal delivery by electro-phonophoresis in treating tuberculous lymphadenitis. Drug Deliv 23:1588–93.
- Długołęcki P, Nymeijer K, Metz S, et al. (2008). Current status of ion exchange membranes for power generation from salinity gradients. J Membr Sci 319:214–22.
- Gopee NV, Roberts DW, Webb P, et al. (2009). Quantitative determination of skin penetration of PEG-coated CdSe quantum dots in dermabraded but not intact SKH-1 hairless mouse skin. Toxicol Sci 111:37–48.
- Guy RH, Delgado-Charro MB, Kalia YN. (2001). Iontophoretic transport across the skin. Skin Pharmacol Appl Skin Physiol 14 Suppl 1:35–40.
- Heo S-H, Lee D-S, Ham S-H, et al. (2016). Pharmacokinetic evaluation of paeoniflorin after oral administration of Paeoniae Radix extract powder to healthy Korean subjects using UPLC-MS/MS. J Pharm Invest 46:273–82.
- Hussain A, Samad A, Singh SK, et al. (2016). Nanoemulsion gel-based topical delivery of an antifungal drug: in vitro activity and in vivo evaluation. Drug Deliv 23:642–7.
- Ibrahim HK, Abdel Malak NS, Abdel Halim SA. (2015). Formulation of convenient, easily scalable, and efficient granisetron HCl intranasal droppable gels. Mol Pharmaceutics 12:2019–25.
- Jacobs GA, Gerber M, Malan MM, et al. (2016). Topical delivery of acyclovir and ketoconazole. Drug Deliv 23:631–41.
- Jain S, Patel N, Shah MK, et al. (2017). Recent advances in lipid-based vesicles and particulate carriers for topical and transdermal application. J Pharm Sci 106:423–45.
- Jegasothy SM, Zabolotniaia V, Bielfeldt S. (2014). Efficacy of a new topical nano-hyaluronic acid in humans. J Clin Aesthet Dermatol 7:27–9.
- Jung E, Lee EY, Choi HK, et al. (2015). Development of drug-in-adhesive patch formulations for transdermal delivery of fluoxetine: in vitro and in vivo evaluations. Int J Pharm 487:49–55.
- Kadam PD, Chuan HH. (2016). Erratum to: Rectocutaneous fistula with transmigration of the suture: a rare delayed complication of vault fixation with the sacrospinous ligament. Int Urogynecol J 27:505.
- Kalia YN, Naik A, Garrison J, et al. (2004). Iontophoretic drug delivery. Adv Drug Deliv Rev 56:619–58.
- Kim SB, Kim KT, Joo J, et al. (2017). Assessment of pharmacokinetics, bioavailability and protein binding of anacetrapib in rats by a simple high-performance liquid chromatography-tandem mass spectrometry method. Biomed Chromatogr 31:e3791.
- Kumar S, Rao PS, Earla R, et al. (2015). Drug–drug interactions between anti-retroviral therapies and drugs of abuse in HIV systems. Expert Opin Drug Metab Toxicol 11:343–55.
- Lademann J, Jacobi U, Surber C, et al. (2009). The tape stripping procedure-evaluation of some critical parameters. Eur J Pharm Biopharm 72:317–23.
- Lee J, Kwon K, Kim M, et al. (2017). Transdermal iontophoresis patch with reverse electrodialysis. Drug Deliv 24:701–6.
- Leveque N, Muret P, Mary S, et al. (2002). Decrease in skin ascorbic acid concentration with age. Eur J Dermatol 12:XXI–XXII.
- Mandal S, Mandal SD, Chuttani K, et al. (2016). Neuroprotective effect of ibuprofen by intranasal application of mucoadhesive nanoemulsion in MPTP induced Parkinson model. J Pharm Invest 46:41–53.
- Naik A, Kalia YN, Guy RH. (2000). Transdermal drug delivery: overcoming the skin’s barrier function. Pharm Sci Technol Today 3:318–26.
- Oh DW, Kang JH, Lee HJ, et al. (2017). Formulation and in vitro/in vivo evaluation of chitosan-based film forming gel containing ketoprofen. Drug Deliv 24:1056–66.
- Papakonstantinou E, Roth M, Karakiulakis G. (2012). Hyaluronic acid: a key molecule in skin aging. Dermatoendocrinol 4:253–8.
- Patel MR, Patel RB, Parikh JR, et al. (2016). Formulation consideration and skin retention study of microemulsion containing tazarotene for targeted therapy of acne. J Pharm Invest 46:55–66.
- Post JW, Hamelers HV, Buisman CJ. (2008). Energy recovery from controlled mixing salt and fresh water with a reverse electrodialysis system. Environ Sci Technol 42:5785–90.
- Prausnitz MR, Mitragotri S, Langer R. (2004). Current status and future potential of transdermal drug delivery. Nat Rev Drug Discov 3:115–24.
- Rao S, Barot T, Rajesh K, et al. (2016). Formulation, optimization and evaluation of microemulsion based gel of Butenafine Hydrochloride for topical delivery by using simplex lattice mixture design. J Pharm Invest 46:1–12.
- Rao Y, Zheng F, Liang X, et al. (2015). Penetration profile and human cadaver skin distribution of finasteride from vesicular nanocarriers. Drug Deliv 22:1003–9.
- Rawlings A, Harding C. (2004). Moisturization and skin barrier function. Dermatol Ther 17:43–8.
- Rissmann R, Oudshoorn MH, Hennink WE, et al. (2009). Skin barrier disruption by acetone: observations in a hairless mouse skin model. Arch Dermatol Res 301:609–13.
- Sachdeva V, Kim HD, Friden PM, et al. (2010). Iontophoresis mediated in vivo intradermal delivery of terbinafine hydrochloride. Int J Pharm 393:112–18.
- Sadowski T, Klose C, Gerl MJ, et al. (2017). Large-scale human skin lipidomics by quantitative, high-throughput shotgun mass spectrometry. Sci Rep 7:43761.
- Salah S, Mahmoud AA, Kamel AO. (2017). Etodolac transdermal cubosomes for the treatment of rheumatoid arthritis: ex vivo permeation and in vivo pharmacokinetic studies. Drug Deliv 24:846–56.
- Saluja S, Kasha PC, Paturi J, et al. (2013). A novel electronic skin patch for delivery and pharmacokinetic evaluation of donepezil following transdermal iontophoresis. Int J Pharm 453:395–9.
- Sauermann K, Jaspers S, Koop U, et al. (2004). Topically applied vitamin C increases the density of dermal papillae in aged human skin. BMC Dermatol 4:13.
- Singh HP, Tiwary AK, Jain S. (2010). Preparation and in vitro, in vivo characterization of elastic liposomes encapsulating cyclodextrin-colchicine complexes for topical delivery of colchicine. Yakugaku Zasshi 130:397–407.
- ter Heine R, Van Waterschoot RA, Keizer RJ, et al. (2011). An integrated pharmacokinetic model for the influence of CYP3A4 expression on the in vivo disposition of lopinavir and its modulation by ritonavir. J Pharm Sci 100:2508–15.
- Veerman J, Saakes M, Metz S, et al. (2009). Reverse electrodialysis: performance of a stack with 50 cells on the mixing of sea and river water. J Membr Sci 327:136–44.
- Vikelis M, Mitsikostas DD, Rapoport AM. (2012). Sumatriptan transdermal iontophoretic patch (NP101-Zelrix): review of pharmacology, clinical efficacy, and safety in the acute treatment of migraine. Neuropsychiatr Dis Treat 8:429–34.
- Wang Q, Jaimes-Lizcano YA, Lawson LB, et al. (2011). Improved dermal delivery of FITC-BSA using a combination of passive and active methods. J Pharm Sci 100:4804–14.
- Zidan AS, Hosny KM, Ahmed OA, et al. (2016). Assessment of simvastatin niosomes for pediatric transdermal drug delivery. Drug Deliv 23:1536–49.