
 ?Mathematical formulae have been encoded as MathML and are displayed in this HTML version using MathJax in order to improve their display. Uncheck the box to turn MathJax off. This feature requires Javascript. Click on a formula to zoom.
Abstract
The influence of chiral excipient D-chitosan (CS) on the stereoselective release of racemic ketoprofen (rac-KET) microspheres has been investigated in comparison to those microspheres containing individual enantiomers in vitro and in vivo. Stereoselectivity was observed in vitro release test, with R-KET release slightly higher than that of S-KET, especially in 3% rac-KET loading microspheres. Stereoselectivity is dependent on the content of chiral excipient and pH of release medium. A molecular docking study between CS and KET enantiomers further revealed that S-KET has a stronger interaction with CS compared to R-KET. Moreover, the plasma concentration of KET enantiomers in rats shows substantial differences, as the plasma levels of S-KET were higher than those of R-KET. Plasma levels of enantiomers from the R-KET microspheres had similar stereoselectivity as rac-KET microspheres. The S/R ratio of rac-KET microspheres was significantly lower than that of rac-KET suspension (regular-release formulation) (p<.05), and the differences is 3–5 fold. Besides, rates of R-KET converted to S-KET exhibited differences between rac-KET microspheres and suspension. Similar results were also found between R-KET microspheres and suspension. All investigations suggest that the chitosan interacting preferentially with S-KET to R-KET significantly affect the stereoselective pharmacokinetics of rac-KET from chitosan microspheres in rats.
1. Introduction
It is estimated that 56% of the drug available for clinical use are marketed as chiral drugs (Jonathan & Michael, Citation2003). Widely used chiral drugs, such as rosuvastatin, duloxetine, and salbutamol, play an important role in testing human diseases. The physiochemical and biochemical properties of racemic mixtures and individual stereoisomers can differ significantly (Muller et al., Citation1990; Barbanoj et al., Citation2001). In some cases, one enantiomer is active, while the other may produce deleterious side-effects, including toxicity (Shen et al., Citation2013). Most chiral drugs have been used as racemates while the beneficial effects are often attributed mainly to one of the enantiomers (Asghar et al., Citation2015).
In various pharmaceutical formulations, a wide variety of chiral excipients (Cellulose, etc.) are used as excipients. The chiral excipients may interact preferentially with one enantiomer, leading to a stereoselective dissolution from a racemate containing formulation, based on the hypothesis put forward by Duddu et al (Duddu et al., Citation1993). Numerous studies have studied the effect of chirality on the release or dissolution such as salbutamol, ketoprofen, propranolol, tiaoprofenic acid, and verapamil from matrix formulations (Majid & Fakheddin, Citation1994; Vakily et al., Citation1995; Maggi et al., Citation1996; Suedee et al., Citation1997; Solinís et al., Citation1998; Álvarez et al., Citation1999; Suedee et al., Citation2000; Srichana & Suedee, Citation2001; Solinis et al., Citation2002a), and these studies suggest that stereoselective release of a racemic drug from a delivery system is possible and such stereoselective release may affect the drug performance in vivo. Therefore, investigation of pharmacokinetic interactions between chiral excipients and the enantiomers of racemic compounds is important in order to optimize the efficacy and safety of such therapy. However, fewer in vivo studies were carried out and the current researches are mostly limited to stereoselective release of racemic drugs with chiral excipient in vitro experiments or stereoselective pharmacokinetics of racemic drugs (Brocks, Citation2000; Wang et al., Citation2005; Nagilla et al., Citation2007; Bressolle et al., Citation2009; Hamdy & Brocks, Citation2009; Wang et al., Citation2009)
Ketoprofen (KET) belongs to the group of 2-aryl propionic acid (2-APA) derivatives and is one of the most commonly used non-steroidal anti-inflammatory drugs (NSAIDs). KET is also a chiral compound existing in two enantiomeric forms, S (+) and R (−) KET. Each enantiomer has different pharmacodynamics and pharmacokinetic properties, of which the biological activity is mainly due to the S-KET while R-KET is therapeutically inactive or less active (Jamali & Brocks, Citation1990).In our previous study, we prepared KET injectable implants elaborated with chiral excipient PLG, which significant stereoselective release of KET was observed in rat due to stereoselective interaction between D,L-PLG in the implant and KET enantiomers, as well as the chiral inversion of KET in vivo (Wang et al., Citation2007a; Citation2007b).
Similar to D,L-PLG, chitosan (CS) is a biodegradable drug carrier which is commonly used in the drug release system for microsphere, microcapsule, nano preparation and so on. Meanwhile, chitosan is also a chiral excipient widely used as the carrier for drug preparation (Yamada et al., Citation2001; Sinha et al., Citation2004). However, the in vitro and in vivo study on the effect of chitosan to the stereoselective release of the chiral drugs had not been reported previously. It is possible that such a chiral polymer may differentially release each stereoisomer.
In the present work, the influence of CS on enantiomeric release from injectable microspheres loading rac-KET has been studied. Molecular docking study was also performed in order to confirm the existence of chiral interactions between drugs and chiral excipient CS. Its enantioselective behavior of enantiomers and the possible reason for stereoselectivity were investigated in comparison to those microspheres containing individual enantiomers in rats.
2. Material and methods
2.1. Material and animals
rac-KET (purity > 99.5%, HPLC) was kindly provided by Jiu Zhou Pharmaceutical Company (Zhejiang, China). S-KET (purity >99.5%, HPLC) was obtained from Pinxin Tech & Trade Co., Ltd. (Shanghai, China). R-KET(%e.e.=80%) was prepared in our lab. CS with an average molecular weight (Mw) of 200KDa and 90% degree of deacetylation was purchased from Golden-shell Biochemical Co., Ltd. (Zhejiang, China). Vancomycin (purity of 99.3%, HPLC) was purchased from Xin Chang Pharmaceutical Company (Zhejiang, China). (S)-(2)-a-(1-naphthyl)ethylamine) (S-NEA), N-hydroxybenzotriazole (HOBT), and 1-ethyl-3- (dimethylaminopropyl) carbodiimide hydrochloride (EDC HCl) were purchased from Sigma Chem (St. Louis, MO). All other agents were commercial products of reagents or HPLC grade and were used without further purification.
Sprague–Dawley rats (weight between 240 and 260 g, half male and half female) were obtained from Zhejiang Laboratory Animal Center (Hangzhou, China) and maintained at 22 ± 2 °C on a 12 h light–dark cycle with access to food and water. All animal experiments were carried out in accordance with the guidelines published by the National Institutes of Health for the care and use of laboratory animals (NIH Publications No. 8023).
2.2. Preparation of rac-KET, S-KET, and R-KET microspheres
Microspheres were produced using emulsion crosslinking method (Shantha & Harding, Citation2002), explained as follows. CS (5 g) was dissolved in a 2% (v/v) acetic acid aqueous solution (100 ml), followed by addition of appropriate amounts of drug (rac-KET, S-KET, and R-KET). The mixture was stirred to give a uniform suspension. Then 8 ml of the suspension was put in liquid paraffin (160 ml) (30 °C) containing 2% (w/v) Span 80 with stirring 5–10 min. This mixture was stirred (200 r/min) for another 4 h after addition of 25% pentanedial (3 ml) to undergo the cross-linking reaction. The product was filtered and the resulting precipitate was washed with petroleum ether, water, and isopropanol, respectively. The microspheres were dried in vacuum. Different drug loading of rac-KET microspheres was prepared by altering the drug added.
2.3. Microspheres characterization
Microspheres were examined with a scanning electron microscope (SEM) (HITACHI S-4700, Hitachi Ltd., Japan), after sputter coating with gold. In addition, the particle size analysis of the microspheres was carried out on a Mastersizer 2000(Malvern Instruments Ltd., Malvern, England). The microspheres were dispersed in an aqueous medium and particle size analyzed after sonication of the sample.
The drug loading was calculated from the ratio of the drug amount in the microspheres to the total microspheres amount added in the solution. The microspheres were destroyed by adding 0.01 M sodium hydroxide solution in 70 °C water bath for 48h. The solution was the cool down to room temperature and then 0.01 M sodium hydroxide solution added until 50 mL. The amount of KET in the filtrate was analyzed by UV at 255 nm. The drug loading was then calculated from EquationEquation (1)(1)
(1) :
(1)
(1)
2.4. In vitro release test
The effects of the release mediums pH and the drug loadings on the stereoselective release were studied in vitro release test. The release test was similar to the one used by our previously reported method (Wang et al., Citation2007a) for PLG microspheres. Two release mediums of pH2.5, pH7.4 phosphate buffers (0.05 M) were prepared, respectively. In vitro release test was performed in a glass bottle (3.2 cm in inner diameter × 5.8 cm in height) with 15 ml release medium. The release medium was replaced with fresh medium at each time point in order to maintain sink conditions. Approximate 30–100 mg microspheres (3 mg KET) were accurately weighed into a 1 cm × 3 cm paper tea bag. The bag was then staple sealed and placed into the 15 ml of releasing medium in the bottle. The bottles were then capped and placed on an orbital environmental shaker (Lab-Line Instruments Inc.) agitated at 50 rpm and maintained at 37 °C. The releasing solution samples were filtered with 0.45 μm syringe tip filter and an aliquot of 100 μl of the filtrate was injected into the HPLC system for each KET enantiomer analysis. KET enantiomers were determined in our previously reported stereospecific HPLC assay (Wang et al., Citation2009).
The HPLC system consists of an LC-10Avp pump and an SPD-10Avp UV-vis detector (Shimadzu, Japan) at 300 nm. KET was separated on a DiamonsilTM C18 column (5 μm, 250 mm × 4.6 mm) at room temperature. Vancomycin was used as the chiral mobile phase additive at 5 mM concentration. The mobile phase involved methanol and 0.25% triethylamine acetate (TEAA) buffer (pH 5.5) at 45:55(v/v). The flow rate of mobile phase was 0.8 ml/min.
2.5. Molecular docking study
In an attempt to understand the molecular interaction between CS and KET enantiomers, a molecular docking study was performed under the Discovery Studio 2.1 (Accelrys, USA). The geometries of CS were firstly optimized using energy optimization and molecular dynamics simulation method (Sakajiri et al., Citation2006). The optimized structures between CS and KET enantiomers were then selected and the total energy was calculated.
2.6. KET enantiomer release in rats from the biodegradable injectable microspheres
2.6.1. Pharmacokinetics study
Thirty Sprague–Dawley rats (weight between 240 and 260 g) were obtained from Zhejiang Laboratory Animal Center (Hangzhou, China). These rats were divided into six groups. Group A, B, and C were given rac-KET suspension, S-KET suspension and R-KET suspension (regular-release formulation), respectively at a dose of 40 mg/kg. Group D, E, and F were administered with rac-KET microspheres, S-KET microspheres, and R-KET microspheres, respectively at a dose equivalent to the corresponding suspension group. Both microspheres and suspensions were suspended in 1 ml 0.9% saline solution containing 2% (w/w) sodium carboxymethylcellulose (CMC-Na) and 1% (w/w) Tween 20. The doses were injected subcutaneously into the rats using a 22-gauge needle. After injection, 1 ml of blood samples were collected via the caudal vein at predetermined time points(0 h, 1 h, 5 h, 12 h, 1 d, 2 d, 3 d, 5 d, 7 d, 9 d, 11 d) and centrifuged for 5 min at 12000 rpm to obtain plasma samples, which were stored at −20 °C until analysis.
2.6.2. HPLC analysis of KET enantiomers
The plasma samples (0.5 ml) were spiked with 25 μl of the internal standard solution (100 μg/ml Flurbiprofen solution), 200 μl of 6% perchloric acid, and 3 ml of dichloromethane. The mixture was vortexed for 5 min and then centrifuged at 5500 rpm for 10 min. The organic layer was separated and evaporated to dryness under a gentle stream of nitrogen at 35 °C. Fifty microliter of HOBT (2.5 mg/ml in 1% pyridine dichloromethane solution), 100 μl of EDC, HCl (2.5 mg/ml dichloromethane solution), and 100 μl of S-NEA (2.5 mg/ml dichloromethane solution) were added to the residue. The mixture was vortexed for 5 min and then kept at 30 °C for 2 h. The reaction mixture was evaporated to dryness under nitrogen and reconstituted with 100 μl of mobile phase. 20 μl of the resulting solution was injected into the HPLC system.
The HPLC system consisted of a LC-10Avp pump and an SPD-10Avp UV–vis detector (Shimadzu, Japan) at 244 nm. After pre-column derivatization, KET and the I.S. FBP diastereoisomeric amides with S-NEA were separated on a (TM) C18 column (5 μm, 250 × 4.6 mm) at 25 °C. The mobile phase consisted of methanol and 0.01 M KH2PO4 (pH 4.5) at 71:29 (v/v). The flow rate of mobile phase was 0.8 ml/min.
2.6.3. Pharmacokinetic analysis
The pharmacokinetic parameters were calculated with Drug and Statistics computer program (PKS, Shanghai Magnsoft Consulting). The maximum plasma concentration (Cmax) and the time to reach maximal plasma concentration (Tmax) were both obtained directly from the measured data. Mean residence time (MRT) was calculated using the equation MRT = AUMC/AUC. The terminal elimination half-life (t1/2) was estimated by linear regression analysis of the terminal phase of the plasma concentration–time curve.
2.7. Statistical analysis
Data are presented as mean ± standard deviation. Significant differences in mean release values and ratio of S/R enantiomers and rate of R-KET converted to S-KET were evaluated by a paired-sample t-test and two-way ANOVA. All statistical analyses were performed using GraphPad Prism 6. The difference was considered statistically significant when the p-value was less than .05.
3. Results and discussion
3.1. Characterization of KET microspheres
A typical scanning electron micrograph displayed that microspheres exhibited a smooth surface morphology full of dense and regular spheres (Figure 1S).
Almost all microspheres had sizes ranging from 30–110 μm in diameter and about 67% of the microspheres were within a narrower range of 50–90 μm (Figure 2S). The microspheres of such sizes can easily pass through a 22-gauge needle for subcutaneous injection. The drug loading of rac-KET microspheres were 3%,5%, and 11%.
3.2. Release of KET enantiomers from microspheres
Three percent, 5% and 11% drug loadings of rac-KET microspheres in the pH 7.4 phosphate buffer were observed to exhibit a sustained release characteristic (Figure 3S). Subsequently, there were differences between the dissolution profiles of three formulations. Microspheres of 11% and 5% drug loadings released practically 26.9% and 23.4% of the drug at 1 d respectively, while microspheres of 3% drug loading at these times released only 12.4% of the drug.
Significant differences of R/S ratio of KET enantiomers released from rac-KET microspheres of 3%, 5% and 11% drug loading (p < .05) were shown between KET enantiomers in the percentage released at many times point (Figure 4S). The release profiles clearly shown the R-KET released amount is larger than that release by S-KET, which indicated that there is a major chiral interaction between S-KET and the excipient, and hence this enantiomer stays longer in the formulation. The difference between enantiomers release became more apparent in 3% drug loading microsphere with the R/S ratio ranging from 1.05 to 1.17, which could be explained by the fact that 3% drug loading microsphere had the lower drug loading and mean the larger content of chiral excipient- CS. Solinis et al. also suggested that there is relation between the amount of chiral excipient and stereoselectivity (Solinis et al., Citation2002b).
It is reported that pH of release medium can also affect the stereoselective release of enantiomers (Vakily et al., Citation1995; Wang et al., Citation2007a). The results obtained in the present study shown that KET release was faster in pH 2.5 buffer than in pH 7.4 buffer. Fifty percent of the drug was released from microspheres in pH 2.5 buffer whereas only 23% of the drug was released in pH 7.4 buffer after nearly two days. These can be explained that CS was in the conformation of random coil in the acid solution and present small steric hindrance (Jin et al., Citation2010). We also observed that stereoselective release in both release mediums of pH 2.5 and pH 7.4 buffer. Moreover, substantial difference of release between enantiomers was found in pH 7.4 buffer, with the R/S ratio ranging from 1.05 to 1.17. The R/S ratio in pH 2.5 buffer was 1.02–1.05 (Figure 5S).
Different physicochemical and properties of the isomers can produce different release. Solubility of rac-KET and its pure enantiomers are quite different (solubility: 182.6 ± 9.1 μg/ml for rac-KET, and 304.3 ± 2.7 μg/ml for S-KET, and 259.6 ± 6.6 μg/ml for R-KET) (Wang et al., Citation2007a). Based on the solubility, S-KET should release faster than R-KET, which was opposite to our experimental results. That indicated existence of chiral interactions between KET enantiomers and CS.
3.3. Molecular docking study
By energy optimization and molecular dynamic simulation, the CS with linear conformation was preferred. And the result disclosed that there were two preferred bonding forms when KET enantiomers interaction with CS respectively, regardless of S-KET or R-KET (Figure 6S). The total energies and the distances of hydrogen bonds of the four optimized conformation were calculated (Table 1S). Hydrogen bonding interactions were observed between both two S-KET conformations with CS, whereas only one conformation of R-KET has Hydrogen bonding interactions with CS. A lower the binding energy indicated a stronger interaction between enantiomers with CS. S-KET has low value of 28.523 kcal/mol by comparing the total energies between R-KET with CS (52.511 kcal/mol). The results confirmed that the theoretical analyses were in good agreement with the experimental values and that interaction of CS with S-KET is stronger than that with R-KET. Docking study could help explain the results found experimentally at the molecular level.
3.4. Analytical method validation
No endogenous peaks from plasma were found to interfere with the elution of KET and I.S (Figure 7S). Overall, this HPLC system is specific for simultaneous determination of rac-KET in rat.
The calibration curves prepared as described in the Analytical Procedure section were found to be linear over the concentration range 0.03–25 μg/ml for both R- and S-KET. Peak height ratios (y) of S- and R-KET vs. the I.S. (S-FBF) were measured and plotted against the concentration (x) of S-or R-RET. The regression equations of the calibration curves of S- and R-KET were y = 0.7074x + 0.1631 (r = 0.9997, n = 6, S-KET) and y = 0.6415x + 0.1198 (r = 0.9997, n = 6, R-KET), respectively. The lowest concentration of the calibration curves, which also represents the limit of quantification (LOQ, S/N > 10), was 0.03 μg/ml with RSD of 12.0% (n = 5) for S-KET and 12.4% (n = 5) for R-KET.
The intra- and inter-day precision and accuracy were obtained by analyzing the spiked internal standard samples at concentrations of 0.1, 1, and 7.5 μg/ml (n = 5). For intra-precision and accuracy, 5 replicate quality control samples at each concentration were assayed on the same day. The intra-day and inter-day precisions were within 14%.
Extraction efficiency of R- and S-KET from the spiked internal standard samples were evaluated at concentrations of 0.1, 1, and 7.5 μg/ml (n = 5) by comparing the height of an extracted sample containing known amount of the enantiomers. The peak heights of the extracted sample were obtained from direct injections of the solution containing the same concentration of enantiomers in pure solvent. The average recovery through this analytical method varied from 80.7% to 88.4% (Table 2S).
3.5. Sustained-release of enantiomers after subcutaneous injection of rac-KET microspheres in rats
After subcutaneous injection of rac-KET microspheres in rats, the persistent time was prolonged and the Cmax was also substantially reduced in comparison with rac-KET suspension. The plasma level of S-KET can be detected 11 days above the minimum effective KET plasma level of 2 ng/ml when the rac-KET suspension was already below the quantitation limit since 3 d (). These marked changes were simultaneously observed by comparing the individual enantiomer microspheres injection group with their control. Thus, the result of release indicated that microspheres preparation efficiently sustained the release of the drug, and prolonged the resident time of the drug in vivo.
Figure 1. S-KET and R-KET plasma level after single subcutaneous injection of rac-KET suspension and microspheres at a dose of 40 mg/kg in rats. Each point represents the mean ± SD (n = 5).
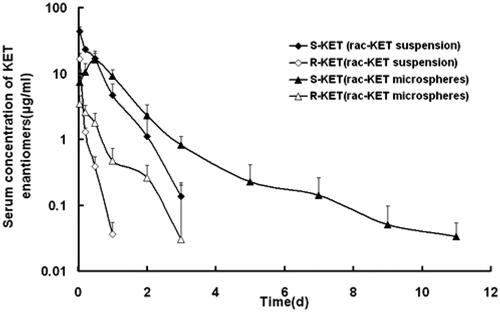
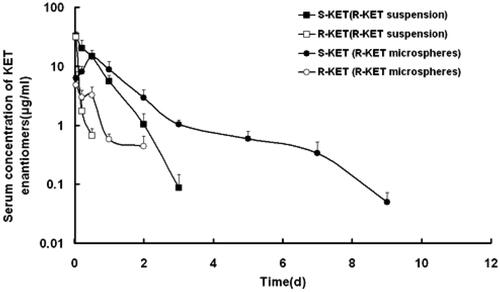
After injection of an individual enantiomer microsphere (R-KET), R and S-KET were simultaneously detected in the plasma (). Compared to S-KET, R-KET has lower plasma level and shorter MRT. The S-KET was only from unidirectional chiral conversion. Therefore, the plasma level of S-KET above the minimum effective KET plasma level over 11 days was resulting from the sustained release of R-KET microspheres. Similar to R-KET microspheres, R-KET from rac-KET microspheres also exhibited sustained-release as S-KET, though R-KET released from rac-KET microspheres represent lower plasma level and shorter MRT in rats.
Figure 2. S-KET and R-KET plasma level after single subcutaneous injection of R-KET suspension and microspheres at a dose of 40 mg/kg in rats. Each point represents the mean ± SD (n = 5).
3.6. Enantioselectivity of rac-KET microspheres in rats
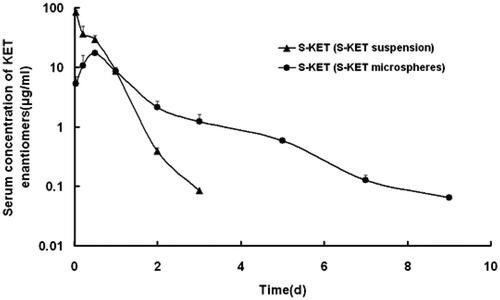
The plasma concentrations of KET enantiomers in rats showed substantial difference after injection of the rac-KET microspheres (). The plasma levels of S-KET were greater than those of R-KET. The Cmax of S-KET was 16.26 ± 3.97 μg/ml, AUC was 20.59 ± 3.68 μg.h/ml, which were greater than that of R-KET (3.37 ± 0.74 μg/ml, 1.93 ± 0.20 μg.h/ml). Besides, MRT was also prolonged (1.18 ± 0.26h vs.0.51 ± 0.08h). Interestingly, the enantiomers released from R-KET microspheres have similar stereoselectivity as rac-KET microspheres (Table 3S). One reason resulted in stereoselectivity may be the chiral conversion of R-KET to S-KET in rat liver under the action of coenzyme A. Because of the unidirectional chiral conversion, only S-KET was detected in the rat after injection of S-KET microspheres ().
Figure 3. S-KET plasma level after single subcutaneous injection of S-KET suspension and microspheres at a dose of 40 mg/kg in rats. Each point represents the mean ± SD (n = 5).
Further investigation revealed that S/R ratios of rac-KET microspheres were much smaller than that of rac-KET suspension at the same time points, and the difference can be 3–5 fold (). If the chiral conversion ability basically kept the same in vivo, the S/R ratio of rac-KET microspheres should be similar to the suspension. On the other hand, if the high plasma concentration of KET may result in saturation of chiral conversion, the rac-KET suspension which has higher plasma concentration should have lower S/R ratio. However, in fact, their ratios were quite different from each other. It suggested that there were some other factors relative to its stereoselective release of rac-KET microsphere in rats.
Table 1. S/R enantiomers ratio as a function of time for KET enantiomers released from rac-KET, R-KET suspension and microspheres (*p < .05).
shown rates of R-KET converted to S-KET after injection of KET. The conversion rates exhibited differences between rac-KET microspheres and rac-KET suspension. The range of conversion rates was 44.4%–88.9% for rac-KET microspheres versus 45.7%–99.4% for rac-KET suspension. Similar results were also found between R-KET microspheres and suspension. Furthermore, conversion rates of rac-KET microspheres were slightly lower than that of R-KET microspheres at the same time points. If only considering the factor of chiral conversion, conversion rates were not significantly different between the rac-KET microspheres and rac-KET suspension as well as R-KET microspheres and R-KET suspension. Because the same drug loadings and preparation technology, the difference in conversion rates indicated that some factors might reduce the release of S-KET from rac-KET microspheres.
Table 2. R-S conversion rate as a function of time for KET enantiomers released from R-KET, rac-KET suspension and microspheres.
The major difference between rac-KET microspheres and suspension is that the microspheres is a sustained-release preparation and the carrier is chiral excipient chitosan. Duddu believed that the chiral excipients may interact preferentially with one enantiomer leading to a stereoselective dissolution from a formulation containing a racemate. The same hypothesis is also applied to the resolution of enantiomers on a chromatographic column packed with chiral material. For a chiral preparation of racemic drug, interaction between enantiomers and chiral excipients are unavoidable in the release process, probably results in a stereoselective release consequently. The in vitro release and diffusion test turned out that the chitosan microspheres of rac-KET with 3% drug loading exhibit stereoselective release (the release rate of R-KET was significantly quicker than S-KET). The result was confirmed by the diffusion experiment as well. It seemed that S-KET presents a stronger interaction with chitosan. Our molecular docking study also supports the results that S-KET was easier to form complex with D-CS by Hydrogen bonding interactions than R-KET. Hence stereoselective pharmacokinetics of rac-KET microspheres in rats may, in part, attributed to the preferential interaction between KET enantiomers and chiral excipient chitosan in addition to chiral conversion. Consequently, not only when assessing dissolution but also when studying the pharmacokinetics of racemic drugs in matrix formulation, the possibility of interactions between the enantiomers and chiral excipients and consequent stereoselective release must be considered.
4. Conclusions
The obvious stereoselective release was observed from the CS microspheres with 3% drug loading in pH 7.4 releases medium. The content of CS in microspheres, as well as pH of the release medium, also affected the stereoselective release. Due to a stronger interaction with CS, the S-KET released slightly slower than that of the R-KET. Furthermore, molecular docking study supports the experimental results at the molecular level. Moreover, the rac-KET microspheres provided sustained release of KET enantiomers and the plasma level of enantiomers in rats shown substantial differences. We attributed the stereoselective pharmacokinetics to stereoselective release from chiral microspheres and the chiral conversion of KET in rats.
supplemental_file.doc
Download MS Word (475.5 KB)Acknowledgments
The authors would like to thank Prof. S Zeng for his kind help.
Disclosure statement
No potential conflict of interest was reported by the authors.
Additional information
Funding
Related Research Data
References
- Álvarez C, Torrado JJ, Cadórniga R. (1999). Stereoselective drug release from ketoprofen and ricobendazole matrix tablets. Chirality 11:611–5.
- Asghar W, Pittman E, Jamali F. (2015). Most chiral drugs have been used as racemates while the beneficial effects are often attributed mainly to one of the enantiomers. DARU J Pharm Sci 23:50–7.
- Barbanoj MJ, Antonijoan RM, Gich I. (2001). Clinical pharmacokinetics of dexketoprofen. Clin Pharmacokinet 40:245–62.
- Bressolle F, Rochette A, Khier S, et al. (2009). Population pharmacokinetics of the two enantiomers of tramadol and O-demethyl tramadol after surgery in children. Brit J Anaesth 102:390–9.
- Brocks DR. (2000). Stereoselective pharmacokinetics of desbutylhalofantrine, a metabolite of halofantrine, in the rat after administration of the racemic metabolite or parent drug. Biopharm Drug Dispos 21:365–71.
- Duddu SP, Vakilynejad M, Jamali F, Grant DJW. (1993). Stereoselective dissolution of propranolol hydrochloride from hydroxypropylmethylcellulose matrices. Pharm Res 10:1648–53.
- Hamdy DA, Brocks DR. (2009). Nonlinear stereoselective pharmacokinetics of ketoconazole in rat after administration of racemate. Chirality 21:704–12.
- Jamali F, Brocks DR. (1990). Clinical pharmacokinetics of ketoprofen and its enantiomers. Clin Pharmacokinet 19:197–217.
- Jin SP, Feng L, He WY, et al. (2010). Preparation and release behavior in vitro of aspirin/chitosan nanospheres by nucleation and ionic crosslinking in emulsion. Acta Phys Chim Sin 26:2581–8.
- Jonathan MC, Michael JO. (2003). Stereochemistry in Drug Action. Prim Care Companion J Clin Psychiatry 5:70–3.
- Kunz CM, Vakily M, Jamali F. (1994). Stereoselective release of racemic drugs in the presence of chiral excipients. Pharm Res S-305. AAPS Annual Meeting PDD 7521.
- Maggi L, Massolini G, De Lorenzi E, et al. (1996). Evaluation of stereoselective dissolution of verapamil hydrochloride from matriz tablets press-coated with chiral excipients. Int J Pharm 136:43–52.
- Majid V, Fakheddin J. (1994). Human Pharmacokinetics of tiaprofenic acid after regular and sustained release formulations: lack of chiral inversion and stereoselective release. J Pharma Sci 83:495–8.
- Muller N, Payan E, Lapicque F, et al. (1990). Pharmacological aspects of chiral non-steroidal antiinflammatory drugs. Fund Clin Pharmacol 4:617–34.
- Nagilla R, Deshmukh DD, Duran SH, Ravis WR. (2007). Stereoselective pharmacokinetics of ketorolac in calves after a single intravenous and oral dose. J Vet Pharmacol Ther 30:437–42.
- Sakajiri T, Kikuchi T, Simon I, et al. (2006). Molecular dynamics approach to study the discrepancies in the thermal behavior of amylose and chitosan conformations. Theochem 764:133–40.
- Shantha KL, Harding DRK. (2002). Synthesis and characterization of chemically modified chitosan microspheres. Carbohydr Pol 48:247–53.
- Shen Q, Wang L, Zhou H, et al. (2013). Stereoselective binding of chiral drugs to plasma proteins. Acta Pharmacol Sin 34:998–1006.
- Sinha VR, Singla AK, Wadhawan S, et al. (2004). Chitosan microspheres as a potential carrier for drugs. Int J Pharm 274:1–33.
- Solinis MA, Cruz Y, Hernandez RM, et al. (2002a). Release of ketoprofen enantiomers from HPMC K100M matrices diffusion studies. Int J Pharm 239:61–8.
- Solinis MA, Cruz Y, Calvo B, et al. (2002b). Release of salbutamol sulphate and ketoprofen enantiomers from matrices containing HPMC and cellulose derivatives. Chirality 14:806–812.
- Solinís MA, Lugará S, Calvo B, et al. (1998). Release of salbutamol sulfate enantiomers from hydroxypropylmethylcellulose matrices. Int J Pharm 161:37–43.
- Srichana T, Suedee R. (2001). Evaluation of stereoselective dissolution of racemic salbutamol matrices prepared with commonly used excipients and 1H-NMR study. Drug Dev Ind Pharm 27:457–64.
- Suedee R, Brain K, Heard CM. (1997). Enantioselective retardation of rac-propranolol from matrices containing cellulose derivatives. Chirality 9:307–12.
- Suedee R, Srichana T, Martin GP. (2000). Evaluation of matrices containing molecularly imprinted polymers in the enantioselective-controlled delivery of β-blockers. J Control Rel 66:135–47.
- Vakily M, Pasutto FM, Daneshtalab M, Jamali F. (1995). Inclusion complexation of heptakis (2,6-di-ethyl)-b-cyclodextrin with tiaprofenic acid: pharmacokinetic consequences of a pH-dependent release and stereoselective dissolution. J Pharm Sci 84:1014–9.
- Wang SH, Liang ZH, Zeng S. (2007a). Monitoring release of ketoprofen enantiomers from biodegradable poly (D,L-lactide-co-glycolide) injectable implants. Inter J Pharm 337:102–8.
- Wang QX, Qiu J, Wang P, et al. (2005). Stereoselective kinetic study of hexaconazole enantiomers in the rabbit. Chirality 17:186–92.
- Wang Q, Qiu J, Zhou Z, et al. (2009). Stereoselective pharmacokinetics of diniconazole enantiomers in rabbits. Chirality 21:699–703.
- Wang SH, Yin LN, Liang ZH, et al. (2007b). Stereoselective behavior of a novel biodegradable racemic ketoprofen injectable Implant in rats. Chirality 19:769–74.
- Yamada T, Onishi H, Machida Y. (2001). In vitro and in vivo evaluation of sustained release chitosan-adjuvanteded ketoprofen microspheres. Yakugaku Zasshi 121:239–45.