
 ?Mathematical formulae have been encoded as MathML and are displayed in this HTML version using MathJax in order to improve their display. Uncheck the box to turn MathJax off. This feature requires Javascript. Click on a formula to zoom.
Abstract
The multidrug resistance in tumor (MDR) is a major barrier to efficient cancer therapy. Modern pharmacological studies have proven that tetrandrine (TET) has great potential in reversing MDR. However, it has a series of medication problems in clinic such as poor water solubility, low oral bioavailability and short half-life in vivo. Aiming at the above problems, red blood cell membrane-camouflaged TET-loaded poly(lactic-co-glycolic acid) (PLGA) nanoparticles (RPTNs) had been developed. The RPTNs had spherical shell-core double layer structure with average particle size of 164.1 ± 1.65 nm and encapsulation efficiency of 84.1% ± 0.41%. Compared with TET-PLGA nanoparticles (PTNs), the RPTNs reduced RAW 264.7 macrophages’ swallowing by 32% due to its retention of natural membrane proteins. The cumulative drug release of RPTNs was 81.88% within 120 h. And pharmacokinetic study showed that the blood half-life of RPTNs was 19.38 h, which was 2.95 times of free drug. When RPTNs of 2 μg/mL TET were administered in combination with adriamycin (ADR), significant MDR reversal effect was observed in drug-resistant cells MCF-7/ADR. In a word, the RPTNs hold potential to improve its efficacy and broaden its clinical application.
1. Introduction
Chemotherapy is one of the most efficient cancer treatments, but multidrug resistance (MDR) has seriously affected the success of chemotherapy (Slichenmyer & Hoff, Citation1990; Caitriona, Citation2013; Siegel et al., Citation2018). In order to reverse MDR, various inhibitors have been approved, such as calcium channel blockers (Tsuruo et al., Citation1985), calmodulin antagonists (Mayur et al., Citation2007) and protein kinase inhibitor (Palayoor et al., Citation1987). However, their application is limited due to single target effect and serious toxicity. Recently, many natural products from traditional Chinese medicines have been research hotspots in reversing MDR, such as ginseng (Wen et al., Citation2015; Lu et al., Citation2017), Ligusticum chuanxiong (Zhang et al., Citation2012; Chen et al., Citation2014) and Curcuma longa (Ye et al., Citation2012; Si et al., Citation2013). They provide more possibilities with advantages of multi-target, multi-way and low-toxicity in cancer therapy.
Tetrandrine (TET) is a bisbenzylisoquinoline alkaloid in the roots of Stephania tetrandra S. Moore. Many research have proven that TET has great potential in cancer therapy (Liu et al., Citation2016). It not only inhibits proliferation and induces apoptosis in normal cancer cells like human oral cancer cells (CAL27) (Lien et al., Citation2017), human pancreatic cancer cells (PaCa) (Singh et al., Citation2018), human hepatocellular carcinoma cells (HCC) (Yu & Shing Ho, Citation2013) and human prostate cancer cells (DU145 and PC-3) (Liu et al., Citation2015), but also is used in combination with other anticancer drugs in drug-resistant cancer cells like human breast cancer resistant to adriamycin (ADR) cells (MCF-7/ADR) (Cao et al., Citation2015), human lung cancer resistant to cisplatin cells (A549/DDP) (Ye et al., Citation2017), human osteosarcoma resistant to paclitaxel cells (U20S/PTX) (Lu et al., Citation2017) and human colon cancer resistant to 5-fluorouracil cells (LOVO/5-Fu) (Wang et al., Citation2017). The dosage forms of TET in market are tablets and injections, but they still have a series of problems such as poor water solubility, low oral bioavailability, and short half-life. Different TET drug delivery systems (DDS) have been developed, including polymer material nanoparticles (Li et al., Citation2012; Guo et al., Citation2015), liposomes (Fan et al., Citation2013; Jiawei Citation2014), magnetic nanoparticles (Cheng et al., Citation2012; Ren et al., Citation2012), microspheres (Cang & Guo, Citation2016; Shi et al., Citation2016) and mesoporous silica nanoparticles (Jia et al., Citation2015). These researches have solved the poor solubility problem and achieved the sustained release of TET in vivo to a certain extent. But there are still deficiencies such as insufficient sustained release time, complicated preparation process and poor biocompatibility of the carrier materials. Therefore, it is necessary to develop new DDS.
Poly(lactic-co-glycolic acid) (PLGA) is an FDA-approved biodegradable synthetic polymer material, which is widely used in pharmaceutical industry due to its good biocompatibility and low toxicity (Makadia & Siegel, Citation2011; Khan et al., Citation2016). Red blood cell membrane (RBCM) is a kind of membrane fragment obtained from the rupture of natural red blood cells (RBCs). RBCM has the same amphiphilic phospholipid bilayer structure as liposomes, and it can self-assemble into RBCM vesicles (RVs) by sonication or extrusion method (Sun et al., Citation2017). As a drug carrier, RBCM can sustain the release of drugs, improve the biocompatibility, avoid elimination by the immune system and thus achieve long drug circulation in vivo (Hongbo Fang et al., Citation2012; Tan et al., Citation2015).
In this work, the PLGA was firstly used to load TET. The TET-PLGA nanoparticles (PTNs) were coated with RBCM on the surface to form RBCM-camouflaged TET-loaded PLGA nanoparticles (RPTNs). Then, the in vitro release, membrane protein activity, in vitro cell uptake and pharmacokinetic assays were tested to evaluate the sustained release and prolonged circulation of the DDS. To evaluate their MDR reversal effect, MCF-7/ADR was used as the model cell line with RPTNs treated in combination with ADR.
2. Materials and methods
2.1 Materials
TET and dauricine were purchased from Dalian Meilun Biotechnology Co., Ltd. PLGA (50/50, molecular weight 30000) was purchased from Jinan Biotech Co., Ltd. F-68 was purchased from BASF. SDS-PAGE gel rapid preparation kit and DiO (cell membrane green fluorescent probe) were purchased from Biyuntian Biotechnology Co., Ltd. Phosphotungstic acid (pH 6.5) and carbon support copper mesh (230 mesh) were purchased from Beijing Zhongjing Keyi Technology Co., Ltd. Dialysis bag (COMW = 3500 Da) was purchased from United States for carbonization. Polycarbonate film was purchased from Whatman Company of the United Kingdom. ADR was purchased from Shanghai Aladdin Biochemical Technology Co., Ltd. Nile Red was purchased from Shanghai Maclean Biochemical Technology Co., Ltd. RPMI 1640 medium, DMEM medium and fetal bovine serum (FBS) were purchased from Gibco, USA. CCK-8 kit was purchased from Tongren Chemical Research Institute, Japan. Dimethyl sulfoxide (DMSO) was purchased from Sigma, USA. Methanol and acetonitrile were HPLC grade, other reagents were analytical grade.
2.2 Cells and animals
MCF-7, RAW264.7 and 293 T cells were obtained from the Shanghai Cell Bank of the Chinese Academy of Sciences. Cultured in DMEM medium containing 10% FBS. MCF-7/ADR cells were purchased from Shanghai Gefan Biotechnology Ltd. Cultured in RPMI 1640 medium containing 10% FBS. The drug resistance index of MCF-7/ADR cells was 32.26 (Supplemental Figure 4). All cells were cultured at 37 °C and 5% CO2.
SD rats (weighing about 200 g) purchased from Shanghai Jiesijie Experimental Animal Co., Ltd were used in this project. All procedures performed in this work involving animals were in accordance with the Guidelines for Care and Use of Laboratory Animals of Shanghai Jiao Tong University and approved by the Animal Ethics Committee (Number:A2018053).
2.3 Preparation of PTNs
PTNs were prepared by emulsification method. 1 mg/mL TET and 20 mg/ml PLGA were solved in acetone as the organic phase. F68 aqueous solution(0.5%) was prepared as the aqueous phase. Under the condition of magnetic stirring, 1 mL organic phase was slowly added 20 mL of aqueous phase. And acetone was removed by magnetic stirring at room temperature for 3 h to obtain the PTNs solution.
2.4 Preparation of RVs
RVs were prepared by low permeability method. Firstly, the whole blood of rat was collected from its abdominal aorta. To remove plasma and leukocyte layers, the blood was centrifuged at 3000 rpm, 4 °C for 5 min. The obtained RBCs were washed 3 times with PBS, and then 0.2 mM EDTA solution was added to break the RBCs. To remove the released hemoglobin, the broken cells were centrifuged at 13200 rpm, 4 °C for 10 min. The above procedure was repeated 4 times to wash the membrane thoroughly, and it was suspended in EDTA solution to obtain the RBCM. Then the RBCM was sonicated at 100 W and a frequency of 40 KHz for 2 min. Finally, the RVs was obtained with sequentially extruding through a polycarbonate film of 800 nm, 400 nm and 200 nm by extruder at least 10 times respectively.
2.5 Preparation of RPTNs
The RVs and PTNs solution were mixed with the volume ratio of 1:5, then the mixture was extruded through the 200 nm polycarbonate film by extruder at least 10 times to obtain the RPTNs.
2.6 Measurement of particle size, PDI and potential
After the sample was diluted with equal volume of ultrapure water, the particle size, polymer dispersity index (PDI) and potential of PTNs, RVs and RPTNs were measured by Malvern Zetasizer at an infrared laser wavelength (λo = 633 nm, He-Ne, 4.0 Mw).
2.7 Determination of encapsulation efficiency and drug loading capacity
Encapsulation efficiency and drug loading capacity of the nanoparticles were analyzed by HPLC. Five-milliliter PTNs solution was placed in the dialysis bag and the bag was placed in 50 mL PBS (pH 7.4). Then it was dialyzed under magnetic stirring at 37 °C for 4 h. After the dialysate filtered with 0.22 μm microporous membrane, 40 μL filtrate was automatically injected into HPLC system and analyzed with Agilent SB-C18 (50 mm × 4.6 mm, 5 μm). The effluent was detected at 280 nm. The mobile phase was methanol/acetonitrile/0.003 mol/L KH2PO4 aqueous solution/triethylamine (50:30:20:0.05) with the flow rate at 1.0 mL/min. TET showed good linearity in the range of 0.4–20 μg/mL, and the encapsulation efficiency and drug loading capacity of TET were calculated by the following formula.
W1 is the amount of free TET, W2 is the amount of initial added TET, and W3 is the total amount of the gathered PTNs.
2.8 Morphological observation of PTNs, RPTNs, and RVs
The morphology of the nanoparticles was observed by TEM. Firstly, 10 μL samples were dropped on carbon-supported copper meshes. Two minutes later, they were diluted with 10 μL ultrapure water and excess water was removed with filter paper. Then the nanoparticles were stained with 10 μL phosphotungstic acid solution for 1 min. After the samples had been completely dried, they were observed by TEM.
2.9 Stability test
The samples were centrifuged and redispersed in PBS (pH 7.4). Then they were placed at room temperature. The particle size and PDI were measured for 15 consecutive days to investigate their stability.
2.10 In vitro release study
Since tumor cells are in oxygen-deficient environment, the anaerobic metabolism of the cells determines the microenvironment at low pH value. Thus in vitro release of the drug was tested in PBS (pH 6.8). 5 mL TET, PTNs and RPTNs solution were put into dialysis bags respectively, and the bags were put into 50 mL PBS. Then they were dialyzed under magnetic stirring at 100 rpm, 37 °C. 1 mL release solution was taken at 0.5, 1, 2, 4, 8, 12, 24, 36, 48, 72, 96, 120 h and another 1 mL fresh PBS was supplemented. The concentration of TET at each time point was determined by HPLC and the cumulative release of TET was calculated.
2.11 Membrane protein verification of RVs and RPTNs
The protein concentration of each sample was determined by BCA protein quantification kit and protein concentrations of all sample (RBCM, RVs, RPTNs) were adjusted to same concentration. PTNs were taken as blank group. Then 100 μL of the above four groups were mixed with 25 μL loading buffer respectively. The mixtures were boiled in water bath at 95 °C for 5 min to make the proteins denatured. Then the prepared gel plate was loaded with 15 μL of each group and 2 μL protein marker was added into another separate loading slot. After the electrophoresis, the gel pieces were stained at room temperature for 30 min in the dark and decolorized overnight on decolorizing shaker. The gel was recorded by photographing under the gel imager.
2.12 Qualitative observation of in vitro cellular uptake
PTNs, RVs and nuclei were labeled with Nile Red, DiO and DAPI respectively. RPTNs were prepared with labeled PTNs and RVs to observe the uptake of nanoparticles by MCF-7/ADR cells qualitatively. Appropriate amount of cells were inoculated in the 12-well cell culture plate and cultured for 24 h. Then the old medium was removed and 1 mL serum-free fresh medium containing PTNs or RPTNs (PLGA concentration was 0.2 mg/mL) was added. After incubated for 2 h, the nucleus were stained with DAPI for 8 min and all samples were observed under laser confocal scanning microscope. The excitation wavelengths of Nile Red, DiO and DAPI dyes were 543 nm, 484 nm and 405 nm respectively.
2.13 Quantitative detection of in vitro cellular uptake
PTNs were labeled with Nile Red and RPTNs were prepared with labeled PTNs. And the uptake of nanoparticle was detected quantitatively by MCF-7/ADR and RAW264.7 cells. The 12-well cell culture plate was used and these wells were divided into PTNs group, RPTNs group and blank group with 3 duplicate wells respectively. Then 1 mL of cell liquid with density of 2 × 10⁵ cells/mL was inoculated into each well. After 24 h, for PTNs group and RPTNs group, 1 mL serum-free medium containing PTNs or RPTNs (PLGA concentration was 0.2 mg/mL) was added. And for the blank group, 1 mL serum-free medium without drug was added. After incubation for 2 h, all the groups were digested with trypsin and washed 3 times with PBS. Finally, they were resuspended in 500 μL PBS, and the cell uptake was detected by flow cytometry FL-2 channel.
2.14 Hemolysis test of RPTNs
RBCs were collected from the blood of rat and physiological saline was added to prepare the 2% (v/v) RBC suspension. Then the RBC suspension, physiological saline, ultrapure water and RPTNs solution were added to seven test tubes according to . As shown in the table, the No. 6 tube was negative control group, and the No. 7 tube was positive control group. The results were recorded after incubation for 3 h and 24 h at 37 °C respectively.
Table 1. Hemolysis test of RPTNs.
2.15 Cytotoxicity test
Cytotoxicity test was carried out with normal human 293 T cells. PLGA nanoparticles (PNs) and RBCM-PLGA nanoparticles (RPNs) were prepared without TET according to 2.3 and 2.5. Then TET (dissolved in DMSO), PTNs and RPTNs solution were diluted with complete medium to make TET concentrations at 1, 2, 4, 6, 8, 10, 12 μg/mL respectively. The PNs and RPNs solution were diluted with complete medium to make PLGA concentrations at 20, 40, 80, 120, 160, 200, 240 μg/mL respectively. The above groups were administration groups (AG). And the control group (CG) and the blank group (BG) were also set. For AG and CG, 100 μL cell liquid with density of 5 × 10⁴ cells/mL was inoculated into 96-well cell culture plate. After 24 h, 100 μL AG was administered and 100 μL complete medium was added to CG. After incubation for 24 h, 100 μL CCK8 working solution was added to each group. 2 h later, the absorbance (OD) at 450 nm was measured with microplate reader and cell survival rate was calculated with the following formula.
2.16 Reversal of MDR effect
MCF-7 and MCF-7/ADR cells were used to evaluate the MDR reversal effect. 100 μL MCF-7 and MCF-7/ADR cell liquid with density of 5 × 10⁴ cells/mL was inoculated into 96-well cell culture plate respectively. After 24 h, 100 μL of TET group, ADR group, TET + ADR group, PTNs + ADR group and RPTNs + ADR group were administered to two kind of cell lines respectively. The concentrations of TET and ADR of each group were 2 μg/mL and 1 μg/mL. The control group and the blank group were treated as 2.15. After incubation for 12, 24, 36, 48, and 72 h, the OD was measured and the cell survival rate was calculated.
2.17 Pharmacokinetic study (PK)
The PK of TET in RPTNs was studied by UPLC-MS. 12 male rats were randomly divided into 2 groups. Rats were fasted 12 h before dosing and given free access to water. 1 mL TET and RPTNs solutions (250 μg/kg) were injected respectively through the tail vein and the time was recorded immediately after injection. At different points of 0.083, 0.25, 0.5, 1, 2, 4, 6, 8, 12, 24, 36, 48, 72 h, 0.5 mL blood was collected into heparin-pretreated centrifuge tube by eye puncture method. Samples were centrifuged at 13200 rpm, 4 °C for 10 min. Then 160 μL plasma, 20 μL dauricine methanol standard solution (500 ng/mL) and 820 μL methanol were mixed and vortexed for 30 s. Then samples were centrifuged again and the supernatant was analyzed by UPLC-MS. Chromatography separation was conducted on an ACQUITY UPLC I Class system. Chromatographic separation was performed on a Agilent Eclipse Plus-C18 RRHD (2.1 mm × 50 mm, 1.8 μm) at a flow rate of 0.40 mL/min, and the column temperature was 45 °C. The mobile phase was composed of A (0.1% aqueous formic acid) and B (acetonitrile) using a gradient elution of 99%–60% A at 0–2.2 min, 60%–5% A at 2.2–2.3 min, 5% A at 2.3–3.3 min, 5%–99% A at 3.3–3.4 min, 99% A at 3.4–4.5 min. The injection volume was 2 μL. MS analysis was performed on an AB SCIEX Triple Quad 5500 LC/MS/MS system with ESI source in MRM mode. The detection was achieved under the following conditions: positive ion mode, source temperature: 550.0 °C. Analytes were quantified in MRM mode for the following transitions of the precursor ion to specific product ion (m/z): TET, m/z 623.4 [M + H]+ → m/z 381.1 (collision energy: 54 V), dauricine, m/z 625.4 [M + H]+ → m/z 206.1 (collision energy: 46 V). The detailed PK parameters were calculated by Phoenix WinNonlin software version 6.0.
3. Results and discussion
3.1 Particle size, PDI, potential, encapsulation efficiency, and drug loading capacity
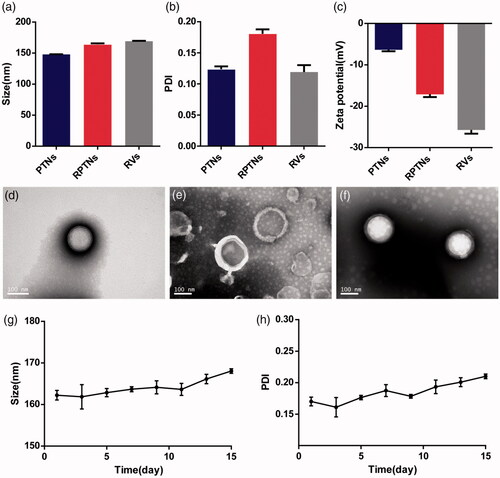
The average size of PTNs was 147.9 nm. After camouflaged with the RBCM, the size increased to 164.1 nm (). Since the thickness of RBCM was 7–8 nm (Hochmuth et al., Citation1983), so the increase in particle size confirmed the encapsulation of RBCM. The average PDI of PTNs and RPTNs were 0.124 and 0.181 (), indicating their uniform distribution. The average potential of RPTNs was −17.1 mV (), which was much lower than that of PTNs. It also proved the successful encapsulation. Analyzed by HPLC, nanoparticles showed good encapsulation efficiency and drug loading capacity, which were 84.1% ± 0.41% and 4.03%±0.02% respectively.
Figure 1. Characterization of the DDS. (a) (b) (c) Particle size, PDI and Zeta potential of PTNs, RPTNs and RVs. (d) (e) (f) TEM images of PTNs, RVs, and RPTNs. (g) (h) Particle size and PDI changes of RPTNs in 15 days. Data were presented as the mean ± SD (n = 3).
3.2 Morphological observation of PTNs, RVs, and RPTNs
The results of TEM showed that PTNs () were regular spherical structure with smooth surface. RVs () were closed rounded cavity structure. RPTNs () presented clear shell-core double-layer structure, indicating that the RVs had successfully coated on the surface of PTNs. The particle size of PTNs, RVs and RPTNs was 130–180 nm, which was consistent with the previous results obtained by Zetasizer. The TEM images of PTNs, RVs and RPTNs with larger field were shown in Supplemental Figure 1.
3.3 Stability test
showed that the particle size of RPTNs was stable at 165 ± 3.1 nm within 15 days, and the PDI remained below 0.25 (). Although the particle size and PDI increased slightly after day 10, there was no precipitation observed in the solution. It indicated that the RPTNs were basically stable in structure and distribution within 15 days.
3.4 In vitro release study
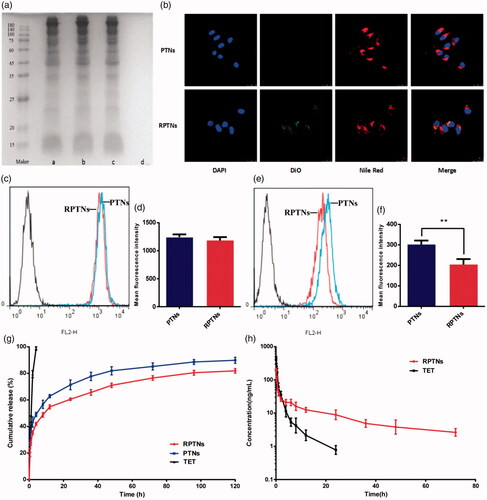
As shown in , the free TET group had the fastest release rate and was completely released within 4 h. The release rates of the PTNs group and the RPTNs group were also fast within 4 h. It was because of the free drug not encapsulated or attached to the surface of the nanoparticles. After 4 h, the release rate gradually slowed down. The cumulative TET release of two groups were 87.23% and 81.88% respectively within 120 h. In a word, both PTNs and RPTNs had significant sustained release effect. And the cumulative TET release of RPTNs at each time was slower than that of PTNs. It showed that the encapsulation of RBCM further improved the sustained release effect of PTNs. This effect was also proved at pH 7.4 (Supplemental Figure 5).
Figure 2. Sustained release and prolonged circulation evaluation of the DDS. (a) RBCM proteins verification in the RBCM a), RVs b), RPTNs c) and PTNs d) by SDS-PAGE. (b) Confocal image of cellular uptake of the PTNs and RPTNs with MCF-7/ADR cells. The nucleus of cells was labeled by DAPI, PTNs were by labeled Nile red and RBCM were labeled by DiO. (c) (e) Fluorescence intensity histogram of PTNs and RPTNs with MCF-7/ADR and RAW264.7 cells. (d) (f) Quantitative analysis of the fluorescence intensity. (g) Release curve of RPTNs and PTNs in vitro. (h) PK behavior of TET and RPTNs in vivo after intravenous administration. Data were presented as the mean ± SD (n = 6). ** correspond to p < .01.
3.5 Verification of membrane proteins of RBCM
SDS-PAGE gel electrophoresis was used to verify whether the membrane proteins would be hurt during the preparation process of RVs and RPTNs. As shown in , the RVs, RPTNs and RBCM groups presented same protein bands while PTNs group showed no bands. It showed that both RVs and RPTNs retained the natural RBCM proteins. Furthermore, sonication and extrusion did not cause any significant hurt to the proteins during the preparation process of RVs and RPTNs. Therefore, it could be predicted that the RPTNs maintained the biological activity as the natural RBCM and hold the potential to achieve long circulation in vivo.
3.6 Qualitative observation of in vitro cellular uptake
The structural integrity of the RPTNs is important to efficiency. The laser scanning confocal microscope was used to observe the cellular uptake process in vitro. As shown in , the blue, green and red fluorescence represented the stained nucleus, RVs and PTNs respectively. After administrated for 2 h, it was observed that both red and green fluorescence overlapped around the blue fluorescence. It showed that the core-shell structure of RPTNs was intact after internalized by cells.
3.7 Quantitative detection of in vitro cellular uptake
The immune evasion ability of RPTNs was verified with flow cytometry by comparing the uptake quantitatively between PTNs and RPTNs with MCF-7/ADR () and RAW 264.7 cells (). As shown in , their mean fluorescence intensity in MCF-7/ADR cells were 1243 and 1183 respectively. And their value in RAW 264.7 cells were 302 and 204 (). No significant difference between PTNs and RPTNs in MCF-7/ADR could be seen. But the uptake of RPTNs by RAW 264.7 cells was significantly less than that of PTNs (p < .01). It was because of RBCM protein retention of RPTNs at 3.5. These proteins could help RPTNs to pretend as autologous substance to avoid phagocytosis of macrophages, such as CD47, CD59, HRP and DAF (Oldenborg et al., Citation2000; Gao et al., Citation2013). It could ensure that there were adequate TET reaching the tumor site instead of clearing by the immune system.
3.8 Hemolysis test of RPTNs
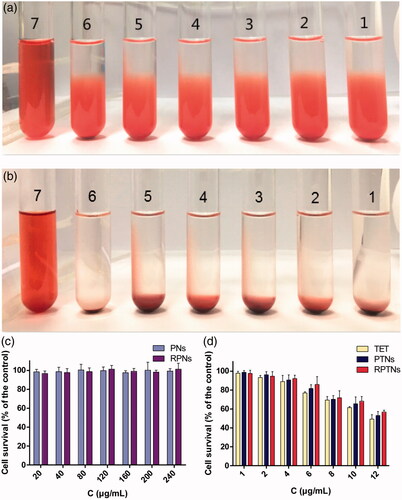
Since the administration of RPTNs is intravenous, it is necessary to ensure that RPTNs do not cause rupture of RBCs in vitro. As shown in and , the positive control group (Tube 7) was red and clear without any cell residue at bottom, it suggested that RBCs were totally hemolytic. For RPTNs group, all the RBCs sank and the supernatants were colorless and clear as the negative control group (Tube 6) with the increase of concentration. Further observation showed that there was no erythrocyte aggregation under the inverted microscope. The hemolysis test indicated that RPTNs will not cause hemolysis or aggregation of RBCs. And it was suitable for intravenous injection.
Figure 3. Safety evaluation of the DDS. (a) (b) Result of the RPTNs in vitro hemolysis test after incubation for 3 h and 24 h. (c) (d) Cell survival of 293T cells after treatment with materials and various formulations of TET at different concentration for 24 h. Data were presented as the mean ± SD (n = 6).
3.9 Cytotoxicity test
Both PLGA and RBCM are materials with good biocompatibility and low toxicity. In vitro toxicity of carrier materials and formulations was tested by CCK-8 method. As shown in , the cell survival rate of PNs and RPNs groups were higher than 95% in the range of 20-240 μg/mL PLGA concentration. It showed that both PLGA and RBCM were safe. According to the result in , the IC50 values of the free TET group, PTNs group and RPTNs group to 293 T cells were calculated with GraphPad Prism6.0, which were 12.47, 13.42 and 14.23 μg/mL respectively. It was obvious that the RPTNs group could reduce the cytotoxicity of free TET group on normal human cells. Thus they were more suitable for cancer therapy.
3.10 Reversal of MDR effect
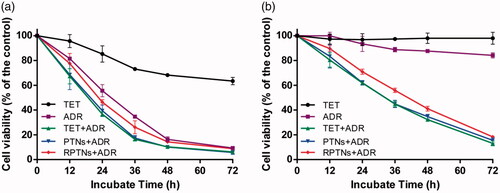
MCF-7 and MCF-7/ADR cell lines were chosen respectively to investigate whether the delivery system could reverse the MDR. Some anti-tumor drugs had great effect on MCF-7 cell lines. However, the anti-tumor effect was inhibited on MCF-7/ADR cells as a result of MDR (Chen & Chen, Citation2013; Cao et al., Citation2015). ADR was used to mix with RPTNs to test the anti-tumor efficacy on MCF-7/ADR cell lines. In , it was obvious that free ADR group showed significant effect and the MCF-7 were almost killed at 72 h. But as shown in , it was found that both free TET and free ADR groups had weak killing effects on MCF-7/ADR within 72 h. However, after ADR was mixed with TET together, the above 3 groups showed strong killing effects against MCF-7/ADR cell lines. And with the drug in nanoparticles releasing gradually, the PTNs + ADR and RPTNs + ADR groups showed same effect as TET + ADR group. Since RPTNs had sustained release and prolonged circulation characteristics, the RPTNs + ADR group showed slightly slower MDR reversal effect than the TET + ADR group in the cell culture plates circumstance. When they get into the body, it could be predicted that the free drug would be easily cleared away and the RPTNs would have better behaviors. It had been proven in the following pharmacokinetic study.
Figure 4. Cell survival of MCF-7 (a) and MCF-7/ADR (b) cells after treatment with various groups for 72 h. Data were presented as the mean ± SD (n = 6).
3.11 Pharmacokinetic study
As shown in Supplementary Figure 2 and 3, the content of TET in plasma from 0.5 ng/mL to 100 ng/mL could be accurately carculated by our UPLC-MS method. It could be seen from that the free drug was quickly cleared away by the circulatory system. After administrated for 24 h, the TET plasma concentration of free TET group was 0.778 ng/mL, which was close to the minimum concentration detection limit. However, the TET plasma concentration of the RPTNs group could be detected after 72 h. As shown in , the half-life (t1/2) and mean residence time MRT (19.38 h and 27.18 h) of the RPTNs group were longer than those of the free drugs (6.56 h and 2.73 h). The peak concentrations of the two groups also have significant difference (p < .01). Therefore, the preparation of free TET into RPTNs could significantly improve the sustained release characteristics and prolong the circulation time.
Table 2. PK parameters of TET and RPTNs in the rat after intravenous administration.
4. Conclusion
Based on various problems in the clinical application of TET, PTNs were prepared by coating TET with PLGA. Then the RBCM was wrapped on the surface of the PTNs to obtain RPTNs with shell-core double-layer structure. Compared with PTNs, the increase in size and decrease in potential of RPTNs demonstrated the successful encapsulation of RBCM. The encapsulation efficiency of nanoparticles was 83.97% and the RPTNs were stable within 15 days. Furthermore, the RPTNs showed good sustained release effect in vitro release, and the cumulative release of TET was 81.88% within 120 h. It also showed a significant difference from the free TET administration group with half-life of 19.38 h in vivo pharmacokinetics. Meanwhile, the safety and efficacy test of the nanoparticles also showed that the carrier materials were safe. Moreover, the significant MDR reversal effect of the RPTNs was observed in drug-resistant cells MCF-7/ADR.
Thus it is concluded that RPTNs shows high entrapment efficiency, uniform distribution, sustained release, long circulation time and significant reversal of MDR effect with lower toxicity. We hope that they will provide good prospects for the development of MDR reversal.
Supplemental_File.docx
Download MS Word (2.8 MB)Disclosure statement
The authors report no conflict of interest.
Additional information
Funding
Related Research Data
References
- Caitriona H. (2013). Cancer drug resistance: an evolving paradigm, Nature reviews. Cancer 13:714–26.
- Cang J, Guo K. (2016). A novel tetrandrine-loaded chitosan microsphere: characterization and in vivo evaluation. Drug Design Dev Ther 10:1291–8.
- Cao X, Luo J, Gong T, et al. (2015). Co-encapsulated doxorubicin and bromotetrandrine lipid nanoemulsions in reversing multidrug resistance in breast cancer in vitro and in vivo. Mol Pharm 12:274–86.
- Chen H-y, Chen X-y. (2013). Tetrandrine reversed the resistance of tamoxifen in human breast cancer MCF-7/TAM cells: an experimental research. Zhongguo Zhong Xi Yi Jie He Za Zhi 33:488–91.
- Cheng J, Cheng L, Chen B, et al. (2012). Effect of magnetic nanoparticles of Fe3O4 and wogonin on the reversal of multidrug resistance in K562/A02 cell line. Int J Nanomed 7:2843–52.
- Chen J, Wang W, Wang H, et al. (2014). Combination treatment of ligustrazine piperazine derivate DLJ14 and adriamycin inhibits progression of resistant breast cancer through inhibition of the EGFR/PI3K/Akt survival pathway and induction of apoptosis. Drug Discov Ther 8:33–41.
- Fan C, Li X, Zhou Y, et al. (2013). Enhanced topical delivery of tetrandrine by ethosomes for treatment of arthritis. BioMed Res Int 2013:161943.
- Gao W, Hu C-M, H Fang R, et al. (2013). Surface functionalization of gold nanoparticles with red blood cell membranes. Adv Mater Weinheim 25:3549–53.
- Guo L, Zhang H, Wang F, et al. (2015). Targeted multidrug-resistance reversal in tumor based on PEG-PLL-PLGA polymer nano drug delivery system. Int J Nanomed 10:4535–47.
- Hochmuth RM, Evans CA, Wiles HC, et al. (1983). Mechanical measurement of red cell membrane thickness. Science 220:101–2.
- Hongbo Fang R, Hu C-M, Zhang L. (2012). Nanoparticles disguised as red blood cells to evade the immune system. Exper Opin Biol Ther 12:385–9.
- Jia L, Li Z, Shen J, et al. (2015). Multifunctional mesoporous silica nanoparticles mediated co-delivery of paclitaxel and tetrandrine for overcoming multidrug resistance. Int J Pharm 489:318–30.
- Jiawei L. (2014). Preparation and evaluation of charged solid lipid nanoparticles of tetrandrine for ocular drug delivery system: pharmacokinetics, cytotoxicity and cellular uptake studies. Drug Dev Ind Pharm 40:980–7.
- K Makadia H, Siegel S. (2011). Poly lactic-co-glycolic acid (PLGA) as biodegradable controlled drug delivery carrier. Polymers 3:1377–97.
- Khan I, Gothwal A, Sharma A, et al. (2016). PLGA nanoparticles and their versatile role in anticancer drug delivery. Crit Rev Ther Drug Carrier Syst 33:159–93.
- Li X, Lu X, Xu H, et al. (2012). Paclitaxel/tetrandrine coloaded nanoparticles effectively promote the apoptosis of gastric cancer cells based on “oxidation therapy”. Mol Pharm 9:222–9.
- Lien J-C, Lin M-W, Chang S-J, et al. (2017). Tetrandrine induces programmed cell death in human oral cancer CAL 27 cells through the reactive oxygen species production and caspase-dependent pathways and associated with beclin-1-induced cell autophagy. Environ Toxicol 32:329–43.
- Liu W, Kou B, Ma Z-K, et al. (2015). Tetrandrine suppresses proliferation, induces apoptosis, and inhibits migration and invasion in human prostate cancer cells. Asian J Androl 17:850–3.
- Liu T, Liu X, Li W. (2016). Tetrandrine, a Chinese plant-derived alkaloid, is a potential candidate for cancer chemotherapy. Oncotarget 7:40800–15.
- Lu M, Fei Z, Zhang G. (2017). Synergistic anticancer activity of 20(S)-Ginsenoside Rg3 and Sorafenib in hepatocellular carcinoma by modulating PTEN/Akt signaling pathway. Biomed Pharmacother 97:1282–8.
- Lu Y, Li F, Xu T, Sun J. (2017). Tetrandrine prevents multidrug resistance in the osteosarcoma cell line, U-2OS, by preventing Pgp overexpression through the inhibition of NF-κB signaling. Int J Mol Med 39:993–1000.
- Mayur Y, Jagadeesh S, N Thimmaiah K. (2007). Targeting calmodulin in reversing multi drug resistance in cancer cells. Mrmc 6:1383–9.
- Oldenborg P-A, Zheleznyak A, Fang YY-F, et al. (2000). Role of CD47 as a Marker of Self on Red Blood Cells. Science 288:2051–4.
- Ren Y, Zhang H, Chen B, et al. (2012). Multifunctional magnetic Fe3O4 nanoparticles combined with chemotherapy and hyperthermia to overcome multidrug resistance. Int J Nanomed 7:2261–9.
- Shi C, Meng R, Li K. (2016). Preparation and in vitro evaluation of tetrandrine-loaded composite microspheres embedded with PLGA nanoparticles. Chin J Chin Materia Medica 41:838–44.
- Si M, Zhao J, Li X, et al. (2013). Reversion effects of curcumin on multidrug resistance of MNNG/HOS human osteosarcoma cells in vitro and in vivo through regulation of P-glycoprotein. Chin Med J 126:4116–23.
- Siegel RL, Miller KD, Jemal A. (2018). Cancer statistics, 2018. CA 68:7–30.
- Singh K, Dong Q, S TimiriShanmugam P, et al. (2018). Tetrandrine inhibits deregulated cell cycle in pancreatic cancer cells: differential regulation of p21 Cip1/Waf1, p27 Kip1 and cyclin D1. Cancer Lett 425:164–73.
- Slichenmyer WJ, Hoff DD. (1990). New natural products in cancer chemotherapy. J Clin Pharm 30:770–88.
- Sun Y, Su J, Liu G, et al. (2017). Advances of blood cell-based drug delivery systems. Eur J Pharm Sci 96:115–28.
- T Palayoor S, M Stein J, N Hait W. (1987). Inhibition of protein kinase C by antineoplastic agents: implications for drug resistance. Biochem Biophys Res Commun 148:718–25.
- Tan S, Wu T, Zhang D, Zhang Z. (2015). Cell or cell membrane-based drug delivery systems. Theranostics 5:863–81.
- Tsuruo T, Kawabata H, Nagumo N, et al. (1985). Potentiation of antitumor agents by calcium channel blockers with special reference to cross-resistance patterns. Cancer Chemother Pharm 15:16–9.
- Wang K, Ma L, Bu G. (2017). Tetrandrine reverses the drug resistance of colon cancer to 5-fluorouracil. Biomed Res 28:4843–8.
- Wen X, Zhang H-D, Zhao L, et al. (2015). Ginsenoside Rh2 differentially mediates microRNA expression to prevent chemoresistance of breast cancer. Asian Pac J Cancer Preven 16:1105–9.
- Ye L-Y, Hu S, Xu H-E, et al. (2017). The effect of tetrandrine combined with cisplatin on proliferation and apoptosis of A549/DDP cells and A549 cells. Cancer Cell Int 17:40.
- Ye M-X, Zhao Y-L, Li Y, et al. (2012). Curcumin reverses cis-platin resistance and promotes human lung adenocarcinoma A549/DDP cell apoptosis through HIF-1α and caspase-3 mechanisms. Phytomedicine 19:779–87.
- Yu WV, Shing Ho W. (2013). Tetrandrine inhibits hepatocellular carcinoma cell growth through the caspase pathway and G(2)/M phase. Oncol Rep 29:2205–10.
- Zhang Y, Liu X, Zuo T, et al. (2012). Tetramethylpyrazine reverses multidrug resistance in breast cancer cells through regulating the expression and function of P-glycoprotein. Med Oncol 29:534–8.