
 ?Mathematical formulae have been encoded as MathML and are displayed in this HTML version using MathJax in order to improve their display. Uncheck the box to turn MathJax off. This feature requires Javascript. Click on a formula to zoom.
Abstract
Febuxostat (FXS) is a potent antigout drug with poor water solubility and relative high first-pass effect leading to moderate oral bioavailability (<49%). This study aimed to increase FXS solubility and bioavailability by optimizing sublingual fast-dissolving films (SFs) containing a selected FXS self-nano-emulsifying system (s-SNES) previously prepared by our team. The s-SNES was loaded into SFs by solvent casting technique. A full factorial design (32) was applied to study the effects of polymer and plasticizer types on mechanical characteristics and the dissolution profile of FXS from the SFs. Numerical optimization was performed to select the SF having highest desirability according to predetermined characteristics. The optimized SF (O-SF) contained 1 g of s-SNES, polyvinylpyrrolidone K30 (6%w/v), polyethylene glycol 300 (20%w/w of polymer wt.), and Avicel PH101 (0.5%w/v). O-SF showed good permeation of FXS through sheep sublingual tissue. Storage of O-SF for three months showed no significant change in the FXS dissolution profile. In-vivo performance of O-SF in rabbits was compared to that of oral marketed tablets (Staturic® 80 mg). A cross-over design was applied and pharmacokinetic parameters were calculated after ensuring absence of sequence effect. Statistical analysis revealed better performance for O-SF with significantly higher C max, AUC0–24, AUC0–∞, apparent t 1/2 together with lower t max, and apparent kel than marketed tablets. Relative bioavailability of O-SF compared to the marketed tablet was found to be 240.6%. This confirms the achievement of the study aims of improving dissolution rate and bioavailability of FXS using a patient-wise convenient formula.
1. Introduction
Self-nano-emulsifying systems (SNES) are an important type of lipid-based formulae for increasing bioavailability of many hydrophobic drugs. These systems are isotropic transparent mixtures of oil, surfactant, co-surfactant, and a drug. The main principle of these systems is spontaneous emulsification in aqueous medium to form fine oil-in-water (o/w) nano-emulsions. The nano-emulsion that is spontaneously formed in the gastrointestinal tract (for example) presents the drug in a solubilized form (Khattab et al., Citation2020). The globules size of the formed nano-emulsion from SNES is less than 100 nm (Pouton & Porter, Citation2008). This small size of the formed droplets affords a large interfacial surface area for their absorption. In addition, SNES are thermodynamically stable systems (long shelf-life), formed spontaneously (zero energy input), manufactured easily, and have a self-preserving nature (Mahmoud et al., Citation2014). However, it is preferable to solidify them to improve their physical stability and keep the increased solubility of incorporated drug (Inugala et al., Citation2015). So, direct casting of a SNES mixed with polymer solution to form films may be a valuable and economical technique to solidify these systems.
The main advantage of the sublingual films is fastening the onset of action of incorporated drugs, increasing their bioavailability due to partial bypassing of GIT and hepatic first-pass metabolism by the increased permeability of drug directly to systematic circulation from sublingual area which is rich in blood supply and from which the drainage of the blood flow occurs directly into the general circulation (Londhe & Shirsat, Citation2018).
Sublingual films are advantageous as they are designed to dissolve within few seconds upon contact with the tongue without the need for liquid intake or measuring devices beside dose accuracy, pain avoidance, ease of handling, and simple storing (Abdelbary et al., Citation2014).
Febuxostat (FXS) is a potent, non-purine, selective xanthine oxidase inhibitor. Xanthine oxidase is needed to sequentially oxidize both hypoxanthine and xanthine (purines) to uric acid. Thereby the production of uric acid by the body through the metabolization of purines is reduced by FXS, thus it is used in the treatment of gout, chronic hyperuricemia and major complications of chronic kidney disease (Younes et al., Citation2016). FXS was found to be preferable than allopurinol in reducing the serum uric acid levels (Alhakamy et al., Citation2020). Its empirical formula is C16H16N2O3S with a molecular weight of 316.37. It is a weak acid (pKa = 3.42), insoluble in water (aqueous solubility is 12.9 μg/ml) and considered to be a BCS class II compound (Yin et al., Citation2018). Its oral bioavailability is moderate (<49%) due to its low aqueous solubility and its exposure to enzymatic degradation in both intestine and liver. Moreover, the presence of food decreases the maximum concentration of FXS in plasma after oral dosing (C max) by 38–49% (Yin et al., Citation2018; Alhakamy et al., Citation2020). Yet, the marketed dosage forms of FXS are confined only to oral tablets of different doses (40, 80, and 120 mg) (Gaffo & Saag, Citation2009). Trials have been made to formulate other dosage forms of FXS; such as: transdermal ethosomes (El-Shenawy et al., Citation2020), self-nano-emulsified loaded transdermal films (Alhakamy et al., Citation2020), and sublingual tablets (Bhide et al., Citation2019).
The objective of this work was to increase the bioavailability of FXS from a patient-wise convenient dosage form. To achieve this, fast-dissolving films of a s-SNES were formulated and in-vitro characterized. The optimized film chosen using numerical optimization was ex-vivo tested against drug suspension and in-vivo tested against marketed tablets.
2. Materials and methods
2.1. Materials
FXS powder and Staturic® 80 mg oral tablets were provided by Mash Premier Pharmaceutical Co. (Cairo, Egypt). Cremophor EL, dibutylPhthalate (DBP) and polyethylene glycol 300 (PEG) were purchased from Sigma-Aldrich Chemical Co. (St. Louis, MO). Triacetin (glyceryl triacetate) and hydroxyethyl cellulose (HEC) (medium viscosity) were acquired from Fluka BioChemika (Buchs, Switzerland). Transcutol HP (diethylene glycol monoethyl ether), ammonium acetate, acetonitrile and methanol (HPLC grade) were obtained from Fisher Scientific Co. (Pittsburgh, PA). Hydroxy propyl methyl cellulose-E15 (HPMC-E15), HPMC-E5, HPMC-K4, and propylene glycol (PG) were obtained from Loba Chemie (Mumbai, India). Avicel PH 101 (Avicel) was purchased from Serva Feinbiochemica (Heidelberg, Germany). Polyvinyl pyrrolidone K30 (PVP) was purchased from MP Biomedicals (Illkirch, France). Water of HPLC-grade was obtained by Milli-Q Water system (Millipore GmbH, Darmstadt, Germany).
2.2. Preparation of selected FXS-loaded SNES (s-SNES)
In a previous work by our team (under publication) different SNESs of FXS were prepared, characterized and a formula was selected that best fits our prerequisites (s-SNES). The s-SNES oily phase composition is 10% Triacetin (oil), 60% Cremophor EL (surfactant) and 30% Transcutol (co-surfactant). Specific amount of FXS was incorporated in enough amount of oily phase then mixed by vortex (Snijders Scientific, Holland, Netherlands) for 15 min till a clear solution was obtained that contains 40 mg of FXS in 5 g of s-SNES. The formula was kept at 37 °C for 24 h before incorporation into the film (Khattab et al., Citation2020).
2.3. Preparation of s-SNES sublingual films (SFs); preparation technique and statistical design
Preliminary trials were performed for the preparation of sublingual films firstly plain then containing the s-SNES. Different film-forming polymers HPMC, HPMC-E5, HPMC-K4, PVP, and HEC, in different concentrations (1, 2, 3, 4, 5, and 6% of total mixture) with or without PG (10 and 20% of polymer weight) were used for formulating these films. Also, trials were done to find the minimum suitable concentration of Avicel as an adsorbent for the lipid-based formula (Balata, Citation2018). The prepared preliminary films were evaluated visually for surface homogeneity, stickiness, and peel ability (ability to be separated from mold without rupturing or cracking).
Solvent casting method was used for films preparation. The whole procedure was performed under magnetic stirring at 800 rpm using magnetic stirrer (Jenway 1000, Staffordshire, UK). First, the polymeric solution was prepared by dissolving the polymer in water to give an overall concentration of 6% w/v then adding the plasticizer dropwise (20%w/w of polymer wt.). Avicel in a concentration of 0.5% w/v was then added. One gram of s-SNES was added portion-wise to the polymeric solution then the volume was completed with water to 5 ml.
After adding all the constituents stirring was kept for an extra half an hour until a homogeneous mixture was obtained. The mixture was degassed in a sonicator (Crest Ultrasonics, New York, NY) to remove air bubbles then poured into a rubber flat mold of size 3.5 × 2 cm and dried in an oven at 40 °C for 24 h. After drying, the films were removed from the molds and checked for any imperfections. The obtained films were taken in the form of rectangular strips of 3.5 × 2 cm2 size which contain 8 mg drug. They were stored – wrapped in aluminum foil – at ambient temperature and 60% relative humidity (RH) in a laboratory desiccator till further investigation (Allam & Fetih, Citation2016). Sublingual films were inspected visually for any defects, color, and transparency. The weight of each film was found using electric balance (Sartorius C224, Göttingen, Germany) (Alsofany et al., Citation2018).
Based on the results of the preliminary trials, constant and studied factors with their respective levels were determined. A 32 full factorial design was used for investigating two factors at three levels each. The first factor (A) was polymer type whose levels were HEC, HPMC, and PVP. The second factor (B) was plasticizer type whose levels were PG, DBP, and PEG. The responses studied were % elongation, folding endurance, elastic modulus, % FXS dissolved after 5 min (Q5), and % FXS dissolved after 15 min (Q15). Factors studied with their levels and responses studied are shown in . Different formulae prepared accordingly are shown in . Each formula was prepared three times on different occasions, to ensure reproducibility of the formed films through the measured responses. Design-Expert version 7 (Stat-Ease Inc., Minneapolis, MN) was used to find the best model representing each response with highest prediction R 2. SPSS version 17 (SPSS Inc., Chicago, IL) was used for applying Duncan post-hoc test to find where significance lies within each factor.
Table 1. a) 32 factorial design for Sublingual films preparation with their measured responses and their required constraints, b) design points prepared accordingly with respective factors and responses. a)
2.4. Characterization of SFs
2.4.1. Film thickness
The thickness was measured using Vernier caliper micrometer (Shanghai, China) at five different locations (four corners and one at center) for each film and the average of five readings for each film was taken (Farid et al., Citation2016).
2.4.2. Moisture uptake
Films were weighed, then exposed to 75% RH at
25 ± 2 °C for one week by putting
them in adjusted desiccators and reweighed. Moisture uptake was calculated
as follows (Fahmy & Badr-Eldin, Citation2014): (1)
(1)
2.4.3. Drug content and uniformity of dosage units
Each film was dissolved in 10 ml methanol after being cut into small pieces. An aliquot of 1 ml was taken and diluted with methanol till 50 ml. The absorbance of the solution was measured spectrophotometrically at 316 nm using UV spectrophotometer (Shimadzu, Kyoto, Japan) with methanol as blank for calculation of drug content and uniformity of dosage units (Sallam et al., Citation2016).
2.4.4. Mechanical properties
The mechanical properties give an indication of the film strength and elasticity, which are reflected by several parameters. A motorized texture analyzer (Qualitest® force test stand EMS301, Qualitest International Inc., Fort Lauderdale, FL) was used to measure some mechanical properties of the prepared films. In this apparatus, each sublingual film was fixed vertically between the two clamps of the tensile tester; the lower clamp was fixed while the upper one was movable. The film was pulled apart by the clamps at a rate of 32 mm/min until breakage. The force and elongation at the point of its break were computed (Alsofany et al., Citation2018).
Each parameter of mechanical properties whether measured by texture analyzer or manually was tested in triplicate on three different films and results were represented as mean ± SD.
2.4.4.1. Percent elongation
The elongation-to-break is the deformation of the film before it gets
broken due to stress (strain) and it indicates the
stretch-ability prior to breakage (ductility)
(Londhe & Shirsat, Citation2018). (2)
(2) where L
0 is the original length and Ls
is the length after elongation just before breakage.
2.4.4.2. Folding endurance (flexibility value)
The folding endurance value is the number of times the film is folded repetitively in the same place without cracking or breaking (Chonkar et al., Citation2016).
2.4.4.3 Elastic modulus
The elastic modulus (Young’s modulus) is the
mathematical description of a material’s tendency to be
distorted elastically when a force is applied to it, and is
considered as an index for elasticity of the film (Fahmy
& Badr-Eldin, Citation2014). (3)
(3) where EM is the elastic modulus, F is the force at
breaking, A is the cross-sectional area of the film,
L
0 is the original length, and Ls
is the length after elongation.
2.4.5. In-vitro dissolution study
USP dissolution apparatus I (Hanson Research, SR 8 Plus
model, Chatsworth, CA) was used for performing the
dissolution study. Receptor medium was 500 ml
(Talekar et al., Citation2019) of simulated salivary fluid (SSF
pH 6.8) containing 0.1% v/v Tween 80
(Sikarra et al., Citation2012). The stirring rate of the receptor medium
was 50 rpm and it was kept at
37 ± 0.5 °C. Each prepared
SF of area 7 cm2 and drug content of 8 mg
was placed in the basket of the dissolution apparatus
(Talekar et al., Citation2019). Filtered samples of 3 ml were
withdrawn at definite time intervals (5, 10, 15, 20, 25, 30,
and 45 min). The withdrawn samples were immediately
replaced by the same volume of fresh dissolution medium to keep the
volume of the dissolution medium constant throughout the dissolution
process. Cumulative percent released of FXS was calculated and
analyzed by measuring the absorbance spectrophotometrically at
316 nm using plain dissolution medium as blank. The
dissolution test was performed on three films from each film formula
prepared on different occasions and results were represented as
mean ± SD. Release mechanism of FXS was
determined by fitting FXS release data from each formula to
different kinetic models; zero-order, first-order, Higuchi, and
Korsmeyer–Peppas according to the following equations,
respectively (Costa & Lobo, Citation2001). (4)
(4)
(5)
(5)
(6)
(6)
(7)
(7) where Rel%
t
is the % drug released at time t
(min) and k is the dissolution rate
constant of the related kinetics. Goodness of fit was determined by
calculation of regression coefficient, R
2, model chosen was the one with the highest
R
2 (Low et al., Citation2013).
In Korsmeyer–Peppas equation (1985) Mt represents amount of drug released at time t, M∞ is total amount of drug released after an infinite time, K is diffusional (kinetic) constant of drug-polymer-lipid system and n is the release exponent that determines mechanism of drug release from drug delivery system. If n < 0.5, mechanism is Quasi Fickian diffusion, n = 0.5 then drug release mechanism is Fickian diffusion, if n > 0.5 then it is non-Fickian diffusion (Costa & Lobo, Citation2001).
2.5. Statistical optimization
Design-Expert® Software version 7 (Stat-Ease Inc.,
Minneapolis, MN) was used to choose a multi-response optimized
sublingual film (O-SF) according to the predetermined
constraints in . Desirability value of each formula was
calculated based on the response surface analysis of the obtained data resulting
in an elucidated mathematical model representing each response. The formula
having highest desirability (D) will be selected as an O-SF.
This D is calculated using the desirability function proposed by Derringer and
Suich (Citation1980) where
D is calculated based on the individual desirability
(dm
) of each response (Ym
). dm
ranges from 0 to 1. (8)
(8) where D is the desirability of the formula
ranging from 0 to 1, dm
is the individual desirability of each response, m is
the number of responses to be optimized (Habib & AbouGhaly,
Citation2016).
The actual values of responses for O-SF will be tested for lying within the
95% prediction interval range. Percent deviations of these actual values
from the predicted ones obtained from elucidated models were calculated
according to the following equation (Fouda et al., Citation2018): (9)
(9)
2.6. Differential scanning calorimetry (DSC)
The compatibility of FXS with the different additives used in the preparation of O-SF was investigated using DSC. The DSC thermograms of pure FXS, PVP, Avicel, O-SF and the physical mixture of FXS, PVP, and Avicel in equal proportions were recorded using Shimadzu differential scanning calorimeter (Model DSC- 50, Kyoto, Japan). Nearly samples of 2 mg of each specimen were heated in an aluminum pan at a scanning rate of 10 °C/min in the range of 25–300 °C. Indium was used in the reference pan and the atmosphere was of nitrogen gas (25 ml/min) (Shamma et al., Citation2019).
2.7. HPLC quantification of FXS
The HPLC system comprised an Agilent pump with different flow rates (model 1100 series, Agilent Technologies, Inc., Santa Clara, CA), using analytical column ZORBAX XDB-C18 (5 µm; 250 mm × 4.6 mm) (Agilent Technologies, Inc., Santa Clara, CA). The mobile phase consisted of 44:56 (% v/v) acetonitrile and ammonium acetate buffer (15 mM, pH 6.0), kept at a flow rate of 1 ml/min. A UV detector was used for quantification of FXS at 316 nm (Ahuja et al., Citation2015).
2.8. Ex-vivo permeation study
O-SF compared to drug suspension in buffer were tested for FXS permeation using sheep sublingual tissue (Fathei et al., Citation2019). The sublingual mucosa of Rahmani sheep having average age of 6 months and weight of about 32 kg were obtained from a local slaughterhouse. The sublingual mucosa was carefully removed from heads of Rahmani sheep and soaked in phosphate buffer saline (PBS) pH 6.8 and instantly frozen at −80 °C until being used. Directly before the experiment, the mucosa was thawed and suspended in PBS (pH 6.8) for 30 min to equilibrate (Sallam et al., Citation2020). Using modified dissolution apparatus (Hanson Research dissolution apparatus, Frankfurt, Germany) in which buccal mucosa was cut and mounted on the bottom of a cylindrical plastic support (of area 1.766 cm2) connected to the drive shaft of the dissolution apparatus. It was held to the support by a plastic ring (Gavini et al., Citation2005). The drug suspension or O-SF moistened with 1 ml of PBS (Talekar et al., Citation2019) (each containing 8 mg of drug) were placed on the epithelial smooth surface of sheep mucosa (Fathei et al., Citation2019). In case of O-SF, it was folded to fit over the circular area of the membrane. The system was then inserted into the vessel containing 100 ml of PBS which is the receptor medium stirred at 50 rpm and kept at 37 ± 0.5 °C. The mucosa was kept in contact with just the surface of the liquid (Gavini et al., Citation2005). Samples (1 ml) were withdrawn at predetermined time intervals up to 30 min and immediately replaced by fresh receptor medium. The amount of drug permeated was measured using HPLC as previously mentioned. Permeation profiles were formed by plotting both percent permeated of FXS and cumulative amount of FXS permeated through the sheep mucosa per unit surface area (μg/cm2) against time. Data were represented as mean of three triplicate measurements ± SD.
2.9. Effect of storage on FXS release from O-SF
O-SF was stored wrapped with double layers of butter paper and aluminum foil at
40 ± 2 °C and
75 ± 5% RH in a thermostatically controlled oven
(MELAG, Berlin, Germany) for 3 months (Abdelbary
et al., Citation2014). At the end of
the storage period, the dissolution profiles of the films were evaluated. The
in-vitro dissolution profile of the stored O-SF was
compared with the freshly prepared one using similarity factor (Fouda et
al., Citation2018). (10)
(10)
The f 2 is a logarithmic transformation of the sum squared error of differences between the testing drug release Tt and the ideal release Rt over all time points (n). The f2 fits the results between 0 and 100. When f 2 is larger than 50, the mean deviation over all time points is less than 10%, thus the testing profile (Tt ) is believed to be similar to the reference profile (Rt ) (Liu & Wang, Citation2008). Moreover, Q5 and Q15 were compared before and after storage by one-way ANOVA test using SPSS version 17 software (SPSS Inc., Chicago, IL).
2.10. In-vivo pharmacokinetic study
2.10.1. Animals and dosing
Institutional Ethical Committee (Faculty of Pharmacy, Cairo University) revised and approved the animal study protocol under the number (S. No. PI1081). Six male rabbits (weighing 2 ± 0.2 kg) were used in this study. All the rabbits showed good health during the experimental period. Before administration of O-SF or marketed FXS tablets (Staturic® 80 mg), the rabbits were fasted overnight and continued fasting 2 h post dose, but only water was allowed.
For calculation of equivalent drug dose for rabbits, surface area ratio
method was used, where a special table for surface area ratios of some
common laboratory species and man is used to find a certain factor by which
the therapeutic dose of man is multiplied. The following equation was used
(Allam & Fetih, Citation2016): (11)
(11) where Dr
is the rabbit dose, Dh
the human dose, Wr
the rabbit weight, and Wh
the human weight.
2.10.2. Study design
In this research, a cross-over design (COD) study protocol
was adopted. This study protocol consisted of two periods. The rabbits were
randomly assigned to two groups of three rabbits each. Before each period,
Ketamine in a dose of 15 mg/kg (Grint & Murison,
Citation2008) administered
intravenously was used to put the rabbits under anesthesia. Rabbits were put
under anesthesia to be sure that in case of O-SF administration, the film is
kept under the rabbit’s tongue without being swallowed to the
gastrointestinal tract. The second group of rabbits was also anesthetized to
ensure the same conditions among all rabbits. The rabbits were then laid on
a table with supporting their lower jaw in a horizontal position. In the
first period, first group took O-SF containing 8 mg of FXS carefully
placed under the rabbit’s tongue. The second group received the same
drug dose (8 mg) of the marketed tablets
(Staturic® 80 mg) after
grinding them and making suspension of them in distilled water, then each
rabbit was administered its dose via gastric gavage
(El-Setouhy & El-Malak, Citation2010). The wash out period was set at one week to exceed
the recommendation of 5 times the half-life of drug – FXS documented
half-life time is 5–8 h (C.Sweetman, Citation2011). After the wash out
period, the second period of the study was performed in the same manner with
the only difference that the rabbits that received O-SF now received
marketed tablets and vice versa. Blood samples were taken from the
retro-orbital plexus into sterile heparinized tubes
(40 IU/ml blood). Control blood samples were taken
from the rabbits immediately before drug administration. Other
post-administration samples were taken at 0.25, 0.5, 1, 2, 4, 6, 8, 12, and
24 h time points. Centrifugation of blood samples at
3500 rpm for 10 min at 4 °C was then
performed to separate plasma (Hettich Centrifuge, Tuttlingen,
Germany). Plasma samples were then stored at
−20 °C till analysis (El-Setouhy &
El-Malak, Citation2010). Before
proceeding with data analysis, Grizzle analysis was performed on AUC
0–∞ to test for absence of sequence
(differential carryover) effect. F-test was used to test the
significance of sequence effect as follows (Bolton, Citation2006): (12)
(12)
2.10.3. Quantification of FXS in plasma samples
HPLC was used for FXS quantification as previously mentioned. For construction of the calibration curve, plasma was spiked with FXS. Each aliquot of 0.5 ml plain plasma, 0.5 ml of acetonitrile (protein precipitating agent), and 0.5 ml of the working FXS solutions were mixed using a vortex mixer (Snijders Scientific, Holland, Netherlands) for 5 min. The mixture was centrifuged (Hettich centrifuge, Tuttlingen, Germany) at 12,000 rpm for 10 min then the supernatant was filtered through membrane filter of 0.45 μm pore size. Samples of 50 μl of each prepared solution were injected, in triplicates, to the HPLC column and the peak areas at λ = 316 nm were plotted against the corresponding equivalent concentrations of FXS. The equation governing the relation between FXS concentration and peak area was derived using the least square linear regression analysis. The regression coefficient (R 2) was also determined.
2.10.4. Pharmacokinetic data analysis
Plasma concentration–time curves of FXS were plotted for each rabbit
receiving either O-SF or marketed formula. Maximum concentration of FXS in
plasma (C
max) (ng/ml) and time to reach maximum
concentration (tmax) (h) were
obtained directly from plasma concentration–time curve. One
compartment pharmacokinetic analysis was applied using Kinetica software
version 5.0 (Thermo Fisher Scientific Inc., Waltham, MA) to
derive the values of other pharmacokinetic parameters. Linear trapezoidal
rule was the basis for calculation of the area under the plasma
concentration–time curve from time zero to time 24 h
(AUC0–24) (ng.h/ml).
The area under the plasma concentration–time curve from zero to
infinity AUC0–∞ (ng.h/ml) was
calculated based on: AUC0–∞ =
AUC0–24 + C24/kel.,
where C24 is the last measured concentration at the time
24 h, and kel is the terminal elimination rate constant.
Elimination half-life t
1/2 (h) was 0.693/kel
(El-Shenawy et al., Citation2020). The relative bioavailability of the O-SF to the
marketed tablets was calculated by the following equation (Abdelbary
et al., Citation2014).
(13)
(13)
Means of data were used to compare C max, AUC0–24, AUC0–∞, kel, and t 1/2 as they are all considered as parametric data. tmax is considered from non-parametric data, thus medians were used to compare its results. As for relative bioavailability, it is calculated from average values of AUC0–∞ obtained for O-SF and the marketed tablets, thus percentage relative bioavailability was used for the comparison.
2.10.5. Statistical analysis
First, the validity of period 2 data was tested by determining if a sequence effect existed (Bolton, Citation2006). Crossover analysis of variance (ANOVA) was then applied for C max, AUC0–24, AUC0–∞, kel, and t 1/2 in order to statistically evaluate the differences in responses. Alpha level was set at 0.05. Nonparametric Wilcoxon signed-rank test was employed to compare the medians of the t max for both treatments. The crossover ANOVA and the Wilcoxon signed-rank test were carried out using the software SPSS version 17.0® (Fouda et al., Citation2018).
3. Results and discussion
3.1. Prepared s-SNES
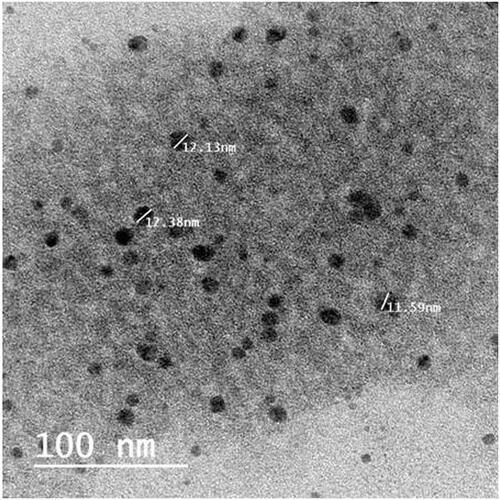
The s-SNES was successfully prepared as a clear solution and its stability was checked by being clear with no phase separation after dilution with water in a ratio of (1:200). Globule size and PDI were 12.38 ± 0.43 nm and 0.0461 ± 0.0371, respectively, which indicate the presence of drug as nano-emulsion globules (<100 nm.) and reflects the uniform distribution of these globules (Khattab et al., Citation2020). Zeta potential was −33.5 ± 1.7 mv which confirms the stability of the prepared s-SNES by preventing globule coalescence (Khattab et al., Citation2020). Discrete spherical and non-agglomerated globules of comparable size to that found by zetasizer were shown under TEM ().
Figure 1. Transmission electron micrograph (TEM) of FXS-SNES.FXS-SNES: febuxostat self-nano-emulsifying system.
3.2. Preparation of s-SNES sublingual films (SFs)
Preliminary trials showed that suitable films would be formed by fixing the following factors at certain levels: polymer 6% of total mixture volume, plasticizer 20% of polymer weight, Avicel 0.5% of total mixture volume, and s-SNES 1 g. Total mixture was completed to 5 ml with water. Fixing these factors at these specified levels resulted in films which have good surface homogeneity, are non-sticky and are easily peel-able.
Plasticizer has a role in increasing the flexibility of formed films. This is due to the fact that the plasticizer reduces the polymer’s glass transition temperature leading to the solidification of the polymer in a rubbery soft film rather than into a hard glassy one (Alsofany et al., Citation2018). Avicel was needed due to its high adsorption capacity as it adsorbs the oily components of the s-SNES after film drying (Balata, Citation2018).
The proposed statistical design aimed at selecting both polymer and plasticizer types that will together give the highest overall desirability of studied responses.
3.3. Characterization of SFs prepared according to the statistical design
3.3.1. Physical appearance, average weight, and film thickness
Visual inspection of different films revealed that all of them were smooth, free of apparent defects, durable, flexible, and withstood normal handling without any cracks. HPMC and PVP-based films were transparent and colorless. HEC-based films were yellow in color and opaque. The weight of the prepared SFs ranged from 404.867 ± 1.206 mg for F9 to 486.033 ± 2.401 mg for F5. The thickness of different films ranged from 0.104 ± 0.078 mm for F3 to 0.174 ± 0.002 mm for F5 which is a suitable range of thickness for placement sublingually without patient inconvenience. The uniformity of film thickness at different locations indicates uniformity of drug distribution which confirms the reproducibility of the method used (Sallam et al., Citation2016).
3.3.2. Moisture uptake
The presence of moisture imparts flexibility and elasticity to the films so prevents their dryness and brittleness as water has a plasticizing effect. Moisture uptake indicates the hygroscopicity of the film and the necessity of specific packaging and storage conditions (El-Bary et al., Citation2019). Dry conditions lead to loss of water from polymeric films while they absorb moisture in conditions of RH above 60% (Fahmy & Badr-Eldin, Citation2014). The highest moisture uptake – after exposure to 75% RH at 25 °C for one week – was for F9 containing PVP and PEG (4.99 ± 0.15%) while the lowest moisture uptake was for F5 containing HPMC and DBP (1.58 ± 0.03%).
3.3.3. Drug content and uniformity of dosage units
Drug content of the films was between 89.5 ± 0.2 and 99.7 ± 0.1% for F5 and F9, respectively. It was observed that the drug content of all formulae was within the acceptable range between 85% and 115% and the relative standard deviation was less than or equal to 6.0% according to USP27 (Shen et al., Citation2013).
3.4. Kinetic analysis of release data
The kinetic analysis of all the release profiles showed that the release data fitted best to Korsmeyer–Peppas model, with a regression coefficient (R 2) values ranging from 0.94 to 1. The value of diffusional exponent (n) ranged from 0.6 to 1.578 indicating a non-Fickian transport. Combined diffusion and erosion of film matrix characterize this type of release (Hammad et al., Citation2018).
3.5. Factorial design statistical analysis
The importance of multifactor statistical designs of which factorial designs is considered the parent comes from concurrent analysis of the effects of different factors and interactions between them on different properties of the drug delivery system (Sayed et al., Citation2018). ANOVA-factorial was used to specify the significance of different factors and interaction between them. Adequate precision measures the signal-to-noise ratio. This ratio is required to be higher than 4 to confirm appropriate models. Predicted R 2 values and adjusted R 2 ones should be in reasonable agreement with each other. Elucidated models – whether full or reduced – were chosen based on the highest possible prediction R 2 for each response. The higher the prediction R 2, the higher the ability of the model to predict values of different responses is. Elucidated models are shown in . Duncan post-hoc test was used to find where significance lies between the levels of a certain factor. If a significant interaction is present in the model of a certain response, main effect graphs will not be appropriated for response representation. So, main effect plots will be used in case of interaction absence, while interaction plots will be used in case of presence significant interaction.
Table 2. a) Significance level of different model terms appearing in the final model for each response, together with models evaluation, b) pharmacokinetic parameters of FXS after administration of sublingual O-SF and oral Staturic® to rabbits (FXS dose was fixed at 8 mg). a)
3.6. Effect of studied factors on mechanical properties of SF
Both factors; polymer type and plasticizer type significantly affected the studied mechanical properties, namely: percent elongation, folding endurance, and elastic modulus (). Changing polymer type had higher significant effect on the three responses than changing plasticizer type (,b,e,f)). This may be due to polymers being present in higher concentration relative to plasticizers in any prepared formula.
Figure 2. (a–d) Interaction plots of polymer type and plasticizer type on: a) % elongation, b) elastic modulus, c) Q5 (% dissolved after 5 min), and d) Q15 (% dissolved after 15 min), (e,f) effect plots of studied factors on folding endurance: e) polymer type and f) plasticizer type. HEC: hydroxyethylcellulose; HPMC: hydroxypropylmethylcellulose E15; PVP: polyvinylpyrrolidone K30; PG: propyleneglycol; DBP: dibutylphthalate; PEG: polyethyleneglycol 300.
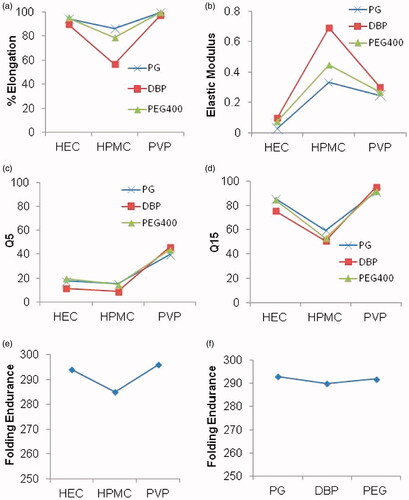
The higher the percent elongation and folding endurance are the more elastic the film will be. Both responses increased significantly with different polymers in this order: HPMC < HEC < PVP (). This could be due to the hydrophilicity of PVP which increases the wettability of the surface with consequent water penetration into the matrix. This increases elasticity of films and improves their mechanical properties (Patel et al., Citation2006). HEC is more hydrophilic and possesses higher erosion rate relative to HPMC so it allows more water permeation into the film increasing its elasticity (El-Setouhy & El-Malak, Citation2010). As for the Elastic modulus, hydrophilicity seemed to be governing too. Since elastic modulus indicates the stiffness of film, lower elastic modulus is better indicating higher elasticity (Rezaee & Ganji, Citation2018). HEC showed the significantly lowest elastic modulus among three polymers followed by PVP then HPMC (El-Setouhy & El-Malak, Citation2010). ().
Generally, plasticizers improve the elasticity by decreasing film stiffness. PG had the best plasticizing effect confirmed by having the significantly highest percent elongation and lowest elastic modulus though equivalent folding endurance to PEG (both in higher Duncan’s group) (,b,e,f)) This could be attributed to PG having the lowest molecular weight of 42.08 g/mol. compared to 278.34 g/mol. for DBP and 300 g/mol. for PEG. Its smaller size allows it to be inserted easily within the polymer chains altering their densely packed structure (Tayel et al., Citation2016). Comparable findings were observed by Bourtoom T., who found that plasticizers with small molecular weights as glycerol and PEG can be easily inserted between the polymer chains in biodegradable blend films from rice starch-chitosan, and eventually have more influence on the mechanical properties than plasticizers with bigger molecules as sorbitol (Bourtoom, Citation2008). Despite lower molecular weight of DBP with respect to PEG 300, it had the least plasticizing effect. It resulted in the significantly lowest percent elongation and folding endurance and highest elastic modulus (). This was in accordance with the findings of Mahmood et al. who made an optimization and evaluation of chlorpheniramine maleate oral strip for pediatric use (Mahmood et al., Citation2018).
For both percent elongation and elastic modulus a significant interaction occurred between the two studied factors, where the undesirable interaction between HPMC and DBP (negative in case of elongation percent and positive for elastic modulus) is the most apparent (). This interaction is due to the hydrophobic nature of DBP that hinders water absorbance thus increases physical strength of the polymeric structure and imparts stiffness to the film relative to the other used plasticizers. This effect is enhanced with HPMC polymer due to its high viscosity. This higher viscosity may lead to blockade of capillary pores upon hydration, this prevents the entry of fluid into the film (Allam & Fetih, Citation2016). As for folding endurance, no significant interaction occurred between the two factors. That is why folding endurance was represented by main effects plots () unlike percent elongation and elastic modulus which were demonstrated using interaction plots ().
3.7. Effect of studied factors on cumulative %FXS dissolved after 5 min (Q5) and 15 min (Q15)
For sublingual fast dissolving films (SFs), the drug should be dissolved within few minutes. Despite the poor solubility of FXS, it had very high dissolution rate from all the prepared films (). This can be attributed to the presence of FXS in a s-SNES which leads to the presence of drug in an amorphous structure after film drying and its self-nano-emulsification performance after hydration which increases the dissolution rate and solubility of drug. Also, the nature of polymers and plasticizers used led to proper hydration and release of this nano-emulsion. Comparable results were also reported by L. Xiao et al. working on Indomethacin self microemulsifying mouth dissolving films (Xiao et al., Citation2013) and Shimoda et al. working on dexamethasone fast dissolving films who observed that 90% of dexamethasone was released from the oral fast-dissolving film within 5 min (Shimoda et al., Citation2009).
To ensure the selection of an optimized formula with a high onset of dissolution and also highest overall dissolution, Q5 and Q15 were taken as two of the responses to be maximized. Both factors; polymer type and plasticizer type significantly affected Q5 and Q15 (). Changing polymer type had higher significant effect on the two responses than changing plasticizer type (). This may be due to presence of high concentration of polymers with respect to plasticizers in the prepared formulae.
PVP-based formulae showed the highest Q5 and Q15 (). This may be due to PVP low molecular weight and superior effect as an anti-nucleating agent that inhibits crystallization of several drugs by easily diffusing to drug surface, keeping the drug in amorphous form, thus increasing wettability and dissolution of drug (Tayel et al., Citation2016). This is in accordance with previous work done by S.A. Tayel et al. who studied PVP ability to diffuse from bulk solution to the drug surface preventing crystallization of sumatriptan succinate (Tayel et al., Citation2016), films prepared using HEC showed higher Q5 and Q15 when compared with those prepared using HPMC (). This may be explained in the light of higher hydrophilicity and faster dissolution of HEC compared to HPMC. These results in higher film porosity and easier diffusion of external solvent into the film, causing higher erosion rate and accelerating drug dissolution when compared with HPMC (El-Setouhy & El-Malak, Citation2010; Allam & Fetih, Citation2016). These results are in accordance with Nafee et al. who incorporated miconazole nitrate in various mucoadhesive buccal patches and found that HEC patches led to higher release of miconazole nitrate than HPMC counterparts (Nafee et al., Citation2003). The lowest Q5 and Q15 were recorded by HPMC-based films which may be due to the highest viscosity of these films after hydration and dispersion in comparison with other polymer-based films used (Allam & Fetih, Citation2016).
DBP-based formulae showed the least Q5 and Q15 (). This could be due to hydrophobicity of DBP so it does not undergo leaching from the film in contrast to the other two hydrophilic counterparts PG and PEG. PG and PEG are water soluble and diffuse out from the films in watery media creating voids in the film through which distribution of liquid happens to enable film breaking down leading to faster dissolution of drug (Mahmood et al., Citation2018). Films containing PEG had significantly higher Q5 and significantly lower Q15 than those contain PG (). This might be due to the high hydrophilicity of PEG which quickly undergoes leaching from the film forming more void spaces that increases the permeability of membrane and thus initially increases the release rate more than PG resulting in higher Q5 (Lu et al., Citation2003). With time (after 15 min) large amount of water diffuses into the film causing swelling of polymer, and the increased viscosity of PEG containing film causes slight retardation of release of drug than films containing PG resulting in lower Q15 for PEG films.
A significant interaction was observed between polymer type and plasticizer type for both Q5 and Q15. The positive interaction between PVP and DBP was the most apparent. This may be due to the highest hydrophilicity of PVP making it the only suitable polymer which surmounts the hydrophobicity of DBP by increasing water uptake by the film thus increasing the wettability and surface area of the drug, which in turn increases drug release from the film matrix to the external media (Kumar et al., Citation2014).
3.8. Optimum formula selection
Design-Expert® software was implemented to identify the optimum formula according to the predetermined constraints (). It is impossible to achieve all the desired responses to an extent of 100% simultaneously because interference might occur (Alsofany et al., Citation2018). The condition achieving one response by 100% may show a reverse effect on another response. Fortunately, Design-Expert® has the ability to calculate the desirability function for each formula and choose the formula with the highest desirability. Thus it predicts the optimum levels for the studied factors achieving highest desirability. The criteria set for the optimum formula are shown in (). The formula showing the highest desirability value of 0.869 was F9 prepared with 6% w/v PVP and plasticized with PEG. This formula: O-SF showed %elongation of 99.4 ± 0.6%, folding endurance of 296 ± 1, elastic modulus of 0.269 ± 0.011 Kgf/mm2, and 44.0 ± 1.3% and 91.8 ± 1.1% Q5 and Q15, respectively. The individual desirability achieved with this formula for each response (parameters of optimization) was 0.975, 0.664, 0.889, 0.933, and 0.922 for %elongation, folding endurance, elastic modulus, Q5 and Q15, respectively. Percent deviation of the actual values – of responses for the three replicate preparations of O-SF – from predicted values ranged from <0.005 to 4.55% indicating high similarity between the actual and predicted values. Also, all actual values proved to be within the 95% prediction intervals. This ensures the validity of the elucidated models.
3.9. Differential scanning calorimetry (DSC)
The DSC thermograms of FXS, PVP, Avicel, physical mixture, and O-SF were conducted using GraphPad Prism version 5 (GraphPad Software, Inc., San Diego, CA) as shown in (). Pure FXS exhibited a sharp endotherm at 208.29 °C corresponding to its melting temperature attributed to its crystalline nature. PVP showed an endothermic peak at 135.46 °C corresponding to its melting point. The thermogram of Avicel showed a broad peak at 86.5° this low transition temperature permits the formation of flexible films at low temperatures (Fahmy & Badr-Eldin, Citation2014).
Figure 3. a) DSC thermograms of pure FXS, PVP, Avicel, physical mixture of three substances and O-SF, b) Ex-vivo permeation profile of O-SF and drug suspension, and c) release profiles of O-SF freshly prepared and after 3 months of storage. FXS: febuxostat; PVP: polyvinylpyrrolidone K30; O-SF: optimized sublingual film.
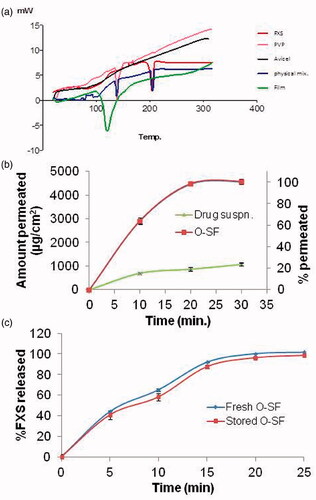
The retained melting peak of FXS in the physical mixture indicates the absence of physical interaction between the drug and the selected excipients (Ahuja et al., Citation2015). A slight early onset of endotherm was observed in O-SF at 109.14 °C indicating a complete overlap of the polymer peak with the drug peak (Fathei et al., Citation2019). This might be due to the miscibility of drug with excipients (Ahuja et al., Citation2015). Or it might be due to the presence of PVP in large concentration in the formula which masks the properties of the drug molecule (Kumar et al., Citation2014).
3.10. Ex-vivo permeation study
The ex-vivo permeation of FXS across sheep nasal mucosa was carried out for O-SF and drug suspension. The percent permeated and cumulative amount of FXS permeated per unit area (as mean ± SD, n = 3) were illustrated graphically as shown in (). At 30 min, the % permeated and cumulative amount permeated per unit area were 100 ± 2% and 4560 ± 92 µg/cm2, respectively, for O-SF compared to 23.7 ± 1.3% and 1071.5 ± 61.1 µg/cm2 respectively for drug suspension. One way ANOVA showed that % permeated of drug and cumulative amount permeated per unit area from O-SF at 30 min were significantly higher than those of drug suspension. Results clearly prove that the presence of FXS in O-SF highly improves its permeation. This could be due to the presence of FXS in a SNES form which is further incorporated in a plasticized polymeric film. The presence of FXS in an amorphous readily nano-globules producing form after hydration together with the permeation enhancing actions of transcutol and PEG led to good permeation (Londhe & Shirsat, Citation2018). Also, PVP was proved to enhance permeation of drug across buccal mucosa and skin due to its antinucleating effect which prevent drug precipitation from SNES, if it might occur, converted the crystalline drug into amorphous state which will have a high-energy state with improved solubility. Increasing solubility of drug increases thermodynamic activity that enhances the permeation rate of drug (El Nabarawi et al., Citation2013; Franco & De Marco, Citation2020).
3.11. Effect of storage on FXS release from O-SF
Release profiles of FXS before and after storage for 3 months under accelerated conditions are shown in (). The f2 was calculated to be 60.33, thus the dissolution profiles are considered similar. Also, no significant changes were recorded regarding Q5 and Q15. This confirms that the release of FXS from O-SF did not change during storage.
3.12. In-vivo pharmacokinetic study
In pharmacokinetic studies, a parallel design (PD) is a common design in which subjects are allocated randomly to groups where each group receives a certain treatment. Another design in pharmacokinetic studies that is popular too is the cross over design (COD). In a COD, the trial is divided to a number of periods where in each period; every subject receives a different treatment. The CODs in clinical trials are usually more preferred-if possible to implement- than PDs. The nature of CODs in which each subject receives both treatments results in more precise results as within subject variability is of course less than between subject variability. Thus, a COD achieves the same level of statistical power and precision as a counterpart PD with a smaller sample size (Senn, Citation2002). Yet, a problem arises with CODs which is the carryover effect that may occur altering the results of the periods other than period I. A common approach to eliminate carry over effect is that suitable wash-out period (at least 5 times the half-life of the drug with the maximum half-life in the study) is left between periods so that the body has completely eliminated drug given in the previous period (Evans, Citation2010). However, it can never be proven that giving a certain treatment in a period has not altered the response of the body to the subsequent one. If, for example, a COD contains two treatments A and B, if the carryover effects for A and B are equivalent then this carryover effect is not aliased with the tested treatment effect. On the other hand, if the carryover effects for A and B are nonequivalent, this difference may be aliased with the treatment effect causing problems in the interpretation of trial results. Differential carryover effect can be called a sequence effect, where in case of two treatments study we have two sequences: AB sequence and BA sequence. A statistical test was derived by Grizzle (Citation1965) to check for the absence of differential carryover or sequence effect. The consequences of this test are that if there is a significant sequence effect, only period I data can be included in the analysis, and if the sequence effect was found to be non-significant, the validity of data of periods other than period I is proven and the vigor of crossover design is proved.
In this study, the validity of second-period data was proved by absence of sequence effect. Sequence sum of squares was calculated to be 119,006 with 1 degree of freedom (df). The proper error term to test the sequence effect (within sequence mean square) was 806,854 with 4 df (2 from each sequence). F calculated was 0.59, smaller than F tabulated-(1,4) which is 7.71 indicating non-significant sequence effect and validity of period 2 data.
illustrates the mean plasma concentration–time profiles of FXS following the administration of O-SF and marketed tablets. The estimates of the mean pharmacokinetic parameters obtained by one-compartmental model analysis of the concentration–time data of the two treatments together with the significant differences if present between the two tested formulae are shown in ().
Figure 4. Mean plasma conc. of FXS after sublingual O-SF and marketed drug administration. FXS: febuxostat; O-SF: optimized sublingual film.
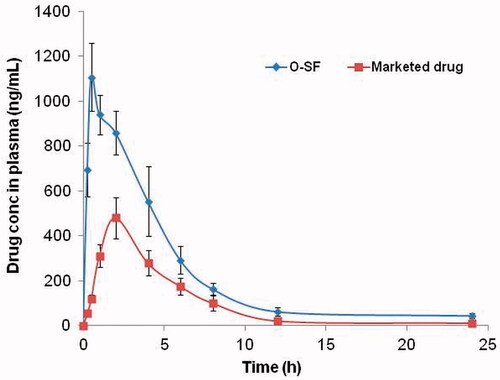
Wilcoxon signed-rank test showed that t max of O-SF is shorter than that of the marketed tablets. Cross-over ANOVA revealed that the C max, AUC0–24, and AUC0-∞ of O-SF were significantly higher than those of the marketed tablets (p < 0.05). This decreased t max and increased C max and bioavailability of O-SF (higher AUC0–24 and AUC0-∞) can be attributed to the fast dissolution of drug and high amount of the drug that is permeated through the sublingual mucosa reaching directly the systemic circulation avoiding the first-pass metabolism thus improving the bioavailability of the drug (Mura et al., Citation2000; Xiao et al., Citation2013). O-SF offers high amounts of drug to be permeated directly through the sublingual mucosa. This is due to the fast film hydration leading to liberation of drug nano-globules. The high mucosal permeability of the formed nano-globules further enhanced by the permeation enhancement effect of transcutol and PEG together with the high drug dissolution rate enables absorbance of a large amount of drug from sublingual area (Rezaee & Ganji, Citation2018). Relative bioavailability of sublingual film compared to the marketed tablet was calculated and found to be 240.64%.
As shown in , there is a significant increase in apparent t 1/2 and decrease in kel of O-SF as compared with that of marketed tablet which might be due to partial avoidance of first-pass metabolism due to partial sublingual absorption of drug from O-SF. The longer apparent half-life (10.2 ± 2.1 h) of O-SF compared with that after oral administration (5.3 ± 1.3 h) could be beneficial in eliminating the need of frequent dosing of the drug. This is in accordance with the results obtained by Allam and Fetih who studied the pharmacokinetics and bioavailability of metoprolol tartrate sublingual fast-dissolving niosomal film and marketed tablet and observed that t 1/2 of drug from sublingual film was significantly higher than that from marketed tablet (Allam & Fetih, Citation2016).
From these results, we may deduce that incorporation of the selected SNES of FXS in the O-SF enabled higher dissolution, absorption, and bioavailability of FXS.
Conclusion
The optimized FXS self-nano-emulsifying sublingual fast dissolving films (O-SF) showed acceptable mechanical properties and high drug dissolution rate. They introduced the drug in a fast hydrated formula that liberates nano-sized globules. The high permeation across sublingual mucosa of these nano-sized globules – together with the high surface area of drug exposure they offer – lead to increased rate and extent of drug absorption. This was in-vivo justified by O-SF having relative bioavailability of 240.64% compared to marketed Staturic® tablets with higher C max, AUC0–24, and AUC0-∞, faster onset of action (t max 0.5 h) and longer apparent t 1/2. This proposed formula can be promising as an alternative for patients suffering from difficulty in swallowing, pediatrics, geriatrics, etc. thus increasing patient compliance.
Disclosure statement
No declaration of interest is reported by the authors.
References
- Abdelbary A , Bendas ER , Ramadan AA , Mostafa DA. (2014). Pharmaceutical and pharmacokinetic evaluation of a novel fast dissolving film formulation of flupentixol dihydrochloride.AAPS PharmSciTech 15:1603–10.
- Ahuja BK , Jena SK , Paidi SK ,et al. (2015). Formulation, optimization and in vitro-in vivo evaluation of febuxostat nanosuspension.Int J Pharm 478:540–52.
- Alhakamy NA , Fahmy UA , Ahmed OAA ,et al. (2020). Development of an optimized febuxostat self-nanoemulsified loaded transdermal film: in-vitro, ex-vivo and in-vivo evaluation.Pharm Dev Technol 25:326–31.
- Allam A , Fetih G. (2016). Sublingual fast dissolving niosomal films for enhanced bioavailability and prolonged effect of metoprolol tartrate.Drug Des Devel Ther 10:2421–33.
- Alsofany JM , Hamza MY , Abdelbary AA. (2018). Fabrication of nanosuspension directly loaded fast-dissolving films for enhanced oral bioavailability of olmesartan medoxomil: in vitro characterization and pharmacokinetic evaluation in healthy human volunteers.AAPS PharmSciTech 19:2118–32.
- Balata GF. (2018). Formulation and evaluation of gliclazide in vegetable oil-based self emulsifying delivery system.J Appl Pharm Sci 8:23–33.
- Bhide P , Cunha JD , Andes NF. (2019). Development and evaluation of febuxostat sublingual tablet formulation development and evaluation of febuxostat sublingual tablet formulation.Int J Pharm Res 10.
- Bolton S. 2006.Statistics. In: Troy DB , ed. Remington: the science and practice of pharmacy.Baltimore, MD:Lippincott Williams & Wilkins,122–161.
- Bourtoom T. (2008). Plasticizer effect on the properties of biodegradable blend from rice starch-chitosan.Songklanakarin J Sci Technol 30:149–55.
- C.Sweetman, S.P.P.L. (2011). Martindale: The Complete Drug Reference 37th ed. London, UK: Pharmaceutical Press.
- Chonkar AD , Rao JV , Managuli RS ,et al. (2016). Development of fast dissolving oral films containing lercanidipine HCl nanoparticles in semicrystalline polymeric matrix for enhanced dissolution and ex vivo permeation.Eur J Pharm Biopharm 103:179–91.
- Costa P , Lobo JMS. (2001). Modeling and comparison of dissolution profiles.Eur J Pharm Sci 13:123–33.
- Derringer G , Suich R. (1980). Simultaneous optimization of several response variables.J Qual Technol 12:214–9.
- El-Bary AA , Al Sharabi I , Haza’a BS. (2019). Effect of casting solvent, film-forming agent and solubilizer on orodispersible films of a polymorphic poorly soluble drug: an in vitro/in silico study.Drug Dev Ind Pharm 45:1751–69.
- El Nabarawi MA , Shaker DS , Attia DA , Hamed SA. (2013). In-vitro skin permeation and biological evaluation of lornoxicam monolithic transdermal patches.Int J Pharm Pharm Sci 5:242–8.
- El-Setouhy DA , El-Malak NSA. (2010). Formulation of a novel tianeptine sodium orodispersible film.AAPS PharmSciTech 11:1018–25.
- El-Shenawy AA , Abdelhafez WA , Ismail A , Kassem AA. (2020). Formulation and characterization of nanosized ethosomal formulations of antigout model drug (Febuxostat) prepared by cold method: in vitro/ex vivo and in vivo assessment.AAPS PharmSciTech 21:1–13.
- Evans SR. (2010). Clinical trial structures.J Exp Stroke Trans Med 3:8–18.
- Fahmy RH , Badr-Eldin SM. (2014). Novel delivery approach for ketotifen fumarate: dissofilms formulation using 32 experimental design: in vitro/in vivo evaluation.Pharm Dev Technol 19:521–30.
- Farid M , El-Setouhy DA , El-Nabarawi MA , El-Bayomi T. (2016). Particle engineering/different film approaches for earlier absorption of meloxicam.Drug Deliv 23:2309–17.
- Fathei M , Alami-milani M , Salatin S ,et al. (2019). Fast dissolving sublingual strips: a novel approach for the delivery of isosorbide dinitrate.Pharm Sci 25:311–8.
- Fouda NH , Abdelrehim RT , Hegazy DA , Habib BA. (2018). Sustained ocular delivery of Dorzolamide-HCl via proniosomal gel formulation: in-vitro characterization, statistical optimization, and in-vivo pharmacodynamic evaluation in rabbits.Drug Deliv 25:1340–9.
- Franco P , De Marco I. (2020). The use of poly(N-vinyl pyrrolidone) in the delivery of drugs: a review.Polymers (Basel). 12:1114.
- Gaffo AL , Saag KG. (2009). Febuxostat: the evidence for its use in the treatment of hyperuricemia and gout.Core Evid 4:25–36.
- Gavini E , Rassu G , Sanna V ,et al. (2005). Mucoadhesive microspheres for nasal administration of an antiemetic drug, metoclopramide: in-vitro/ex-vivo studies.J Pharm Pharmacol 57:287–94.
- Grint NJ , Murison PJ. (2008). A comparison of ketamine-midazolam and ketamine-medetomidine combinations for induction of anaesthesia in rabbits.Vet Anaesth Analg 35:113–21.
- Grizzle JE. (1965). The two-period change-over design and its use in clinical.Biometrics 21:467–80.http://www.jstor.org/stable/2528104.
- Habib BA , AbouGhaly MHH. (2016). Combined mixture-process variable approach: a suitable statistical tool for nanovesicular systems optimization.Expert Opin Drug Deliv 13:777–88.
- Hammad RW , Sanad RAB , Abdelmalk NS ,et al. (2018). Intranasal surface-modified mosapride citrate-loaded nanostructured lipid carriers (MOS-SMNLCs) for treatment of reflux diseases: in vitro optimization, pharmacodynamics, and pharmacokinetic studies.AAPS PharmSciTech 19:3791–808.
- Inugala S , Eedara BB , Sunkavalli S ,et al. (2015). Solid self-nanoemulsifying drug delivery system (S-SNEDDS) of darunavir for improved dissolution and oral bioavailability: in vitro and in vivo evaluation.Eur J Pharm Sci 74:1–10.
- Khattab A , Mohamed M , Basalious EB. (2020). Journal of drug delivery science and technology design of self-nanoemulsifying system to enhance absorption and bioavailability of poorly permeable Aliskiren hemi-fumarate.J Drug Deliv Sci Technol 57:101646.
- Kumar GP , Phani AR , Prasad RGSV ,et al. (2014). Polyvinylpyrrolidone oral films of enrofloxacin: film characterization and drug release.Int J Pharm 471:146–52.
- Liu L , Wang X. (2008). Solubility-modulated monolithic osmotic pump tablet for atenolol delivery.Eur J Pharm Biopharm 68:298–302.
- Londhe V , Shirsat R. (2018). Formulation and characterization of fast-dissolving sublingual film of iloperidone using box–behnken design for enhancement of oral bioavailability.AAPS PharmSciTech 19:1392–400.
- Low AQJ , Parmentier J , Khong YM ,et al. (2013). Effect of type and ratio of solubilising polymer on characteristics of hot-melt extruded orodispersible films.Int J Pharm 455:138–47.
- Lu EX , Jiang ZQ , Zhang QZ , Jiang XG. (2003). A water-insoluble drug monolithic osmotic tablet system utilizing gum arabic as an osmotic, suspending and expanding agent.J Control Release 92:375–82.
- Mahmood SZ , Sabry HS , Yousif NZ , Salman ZD. (2018). Optimization and evaluation of chlorpheniramine maleate oral strip for pediatric use.Asian J Pharm Clin Res 11:548–54.
- Mahmoud DB , Shukr MH , Bendas ER. (2014). In vitro and in vivo evaluation of self-nanoemulsifying drug delivery systems of cilostazol for oral and parenteral administration.Int J Pharm 476:60–9.
- Mura P , Faucci MT , Bramanti G , Corti P. (2000). Evaluation of transcutol as a clonazepam transdermal permeation enhancer from hydrophilic gel formulations.Eur J Pharm Sci 9:365–72.
- Nafee NA , Ismail FA , Boraie NA , Mortada LM. (2003). Mucoadhesive buccal patches of miconazole nitrate: in vitro/in vivo performance and effect of ageing.Int J Pharm 264:1–14.
- Patel V , Prajapat B , Patel J , Patel M. (2006). Physicochemical characterization and evaluation of buccal adhesive patches containing propranolol hydrochloride.Curr Drug Deliv 3:325–31.
- Pouton CW , Porter CJH. (2008). Formulation of lipid-based delivery systems for oral administration: materials, methods and strategies.Adv Drug Deliv Rev 60:625–37.
- Rezaee F , Ganji F. (2018). Formulation, characterization, and optimization of captopril fast-dissolving oral films.AAPS PharmSciTech 19:2203–12.
- Sallam NM , Sanad RAB , Ahmed MM ,et al. (2020). Impact of the mucoadhesive lyophilized wafer loaded with novel carvedilol nano-spanlastics on biochemical markers in the heart of spontaneously hypertensive rat models.Drug Deliv Trans Res 11:1009–36.
- Sallam NM , Sanad RAB , kharshoom RM , Zeneldin MA. (2016). Development of salbutamol sulphate sublingual films in pullulan matrix for enhanced bioavailability & clinical efficacy.Curr Drug Deliv 14:503–15.
- Sayed S , Habib BA , Elsayed GM. (2018). Tri-block co-polymer nanocarriers for enhancement of oral delivery of felodipine: preparation, in vitro characterization and ex vivo permeation.J Liposome Res 28:182–92.
- Senn S. 2002.Cross-over trials in clinical research.2nd ed. Hoboken, NJ: Wiley.
- Shamma RN , Sayed S , Sabry NA , El-Samanoudy SI. (2019). Enhanced skin targeting of retinoic acid spanlastics: in vitro characterization and clinical evaluation in acne patients.J Liposome Res 29:283–90.
- Shen B , De Shen CY , Yuan XD ,et al. (2013). Development and characterization of an orodispersible film containing drug nanoparticles.Eur J Pharm Biopharm 85:1348–56.
- Shimoda H , Taniguchi K , Nishimura M ,et al. (2009). Preparation of a fast dissolving oral thin film containing dexamethasone: a possible application to antiemesis during cancer chemotherapy.Eur J Pharm Biopharm 73:361–5.
- Sikarra D , Shukla V , Kharia AA , Chatterjee DP. (2012). Techniques for solubility enhancement of poorly soluble drugs: an overview.J Med Pharm 01:1–22.www.jmpas.com
- Talekar SD , Haware RV , Dave RH. (2019). Evaluation of self-nanoemulsifying drug delivery systems using multivariate methods to optimize permeability of captopril oral films.Eur J Pharm Sci 130:215–24.
- Tayel SA , El Nabarawi MA , Amin MM , Abou Ghaly MH. (2016). Sumatriptan succinate sublingual fast dissolving thin films: formulation and in vitro/in vivo evaluation.Pharm Dev Technol 21:328–37.
- Xiao L , Yi T , Liu Y. (2013). A new self-microemulsifying mouth dissolving film to improve the oral bioavailability of poorly water soluble drugs.Drug Dev Ind Pharm 39:1284–90.
- Yin YF , Guo Y , Song WD ,et al. (2018). Improving solubility and oral bioavailability of febuxostat by polymer-coated nanomatrix.AAPS PharmSciTech 19:934–40.
- Younes KM , El-Kady EF , Elzanfaly ES. (2016). Determination of febuxostat in human plasma using RP-LC-UV method.J Chromatogr Sci 54:1022–7.