
 ?Mathematical formulae have been encoded as MathML and are displayed in this HTML version using MathJax in order to improve their display. Uncheck the box to turn MathJax off. This feature requires Javascript. Click on a formula to zoom.
Abstract
In this study, chitosan low molecular weight (LCH) and chitosan medium molecular weight (MCH) were employed to encapsulate a yarrow extract rich in chlorogenic acid and dicaffeoylquinic acids (DCQAs) that showed antiproliferative activity against colon adenocarcinoma cells. The design of CH micro/nanoparticles to increase the extract colon delivery was carried out by using two different techniques: ionic gelation and spray drying. Ionic gelation nanoparticles obtained were smaller and presented higher yields values than spray-drying microparticles, but spray-drying microparticles showed the best performance in terms of encapsulation efficiency (EE) (> 94%), also allowing the inclusion of a higher quantity of extract. Spray-drying microparticles designed using LCH with an LCH:extract ratio of 6:1 (1.25 mg/mL) showed a mean diameter of 1.31 ± 0.21 µm and EE values > 93%, for all phenolic compounds studied. The release profile of phenolic compounds included in this formulation, at gastrointestinal pHs (2 and 7.4), showed for most of them a small initial release, followed by an increase at 1 h, with a constant release up to 3 h. Chlorogenic acid presented the higher release values at 3 h (56.91% at pH 2; 44.45% at pH 7.4). DCQAs release at 3 h ranged between 9.01- 40.73%, being higher for 1,5- and 3,4-DCQAs. After gastrointestinal digestion, 67.65% of chlorogenic and most DCQAs remained encapsulated. Therefore, spray-drying microparticles can be proposed as a promising vehicle to increase the colon delivery of yarrow phenolics compounds (mainly chlorogenic acid and DCQAs) previously described as potential agents against colorectal cancer.
1. Introduction
Achillea millefolium L. (yarrow) is a flowering plant from the Asteraceae family traditionally used to treat digestive and hepatobiliary disorders, together with inflammation and diabetes (Akram, Citation2013). Aqueous and alcoholic yarrow extracts have been reported to present antioxidant, anti-inflammatory and antitumoral activities (Mohammadhosseini et al., Citation2017; Hussein et al., Citation2019). These biological activities have been frequently related to the presence of phenolic compounds, mainly caffeoylquinic acids (CQAs), dicaffeoylquinic acids (DCQAs) and flavones (Dias et al., Citation2013).
Yarrow phenolic compounds have been also indicated as potential agents against colorectal cancer. Thus, Pereira et al. (Citation2018) reported that an Achillea millefolium hydroethanolic extract rich in 3,5-DCQA, 5-CQA, luteolin-O-acetylhexoside and apigenin-O-acetylhexoside caused alterations in the cell cycle and increased apoptosis levels in HCT-15 cells (human colorectal adenocarcinoma cell line). Besides, Gupta et al. (Citation2022) indicated that chlorogenic acid (5-CQA) has been documented as an effective natural anticancer drug and was approved by the China Food & Drug Administration. Regarding colorectal cancer, these authors reported that chlorogenic acid induced growth inhibition, cell cycle arrest and apoptosis in several colon cancer cells lines. Caffeic acid and 5-CQA were also shown to be uptaked and metabolized by human colon adenocarcinoma cells (HT-29), inhibiting cellular viability, and increasing cell apoptosis (Murad et al., Citation2015).
However, after oral consumption, the stability of phenolic compounds is strongly influenced by the gastrointestinal digestion process, since phenolics are sensitive to pH variations and the digestive enzymes activity (Goulas & Hadjisolomou, Citation2019). Regarding DCQAs, Villalva et al. (Citation2020) detected an isomerization effect after gastrointestinal digestion among different DCQAs found in a yarrow extract. These authors reported that 3,5-DCQA concentration was highly reduced after gastrointestinal digestion while 3,4-DCQA and 4,5-DCQA increased. Herrera-Balandrano et al. (Citation2021) also reported that 5-CQA decrease after in vitro digestion. Thus, 5-CQA can be converted into 3- and 4- CQA after incubation at pH 7.4 (Vilas-Boas et al., Citation2020).
In this context, the encapsulation of extracts containing these phenolic compounds using polymers preventing their release in the upper gastro-intestinal tract, but allowing their release when arrive to the colon, has become an important research area. Among these polymers, chitosan-based micro/nanoparticles have been widely applied for colonic drug delivery (Kurakula et al., Citation2021). Chitosan (CH) is a cationic polysaccharide that maintains its integrity in the upper gastrointestinal tract, being degraded in the colon by the action of enzymes produced by colonic microorganisms. Moreover, this polymer presents mucoadhesive properties due to an electrostatic interaction between its positively charged amino groups and the negative charges from sialic acid in the mucus surface, increasing CH residence time within colon epithelia (Arévalo-Pérez et al., Citation2020).
Formulations using CH, along or in combination with other polymers, have been reported as colon-specific drug vehicles for phenolic compounds (Di Santo et al., Citation2021). Liu et al. (Citation2022) proposed the incorporation of chitosan in alginate-based microspheres for targeted delivery of quercetin to the colon. In addition, Sabra et al. (Citation2018) reported chitosan-pectinate nanoparticles prepared by ionic gelation containing curcumin, as an oral deliverable colon cancer formulation. Siles-Sánchez et al. (Citation2022) also indicated CH formulations as suitable vehicles for colon delivery of a marjoram extract.
The aim of this work is the encapsulation of a yarrow extract rich in CQAs and DCQAs that show antiproliferative activity against adenocarcinoma colon cells. The design of CH micro/nanoparticles to increase the extract colon delivery was carried out by using two different technological processes: ionic gelation and spray drying. In vitro release studies of individual yarrow phenolic compounds at gastrointestinal pHs (pH 2 and 7.4) were performed to elucidate the ability of the developed formulations to avoid the release of these phenolic compounds during the digestion steps. Besides, an in vitro gastrointestinal digestion was also carried out to study the combined effect on the designed formulations of pH and gastrointestinal enzymes.
2. Materials and methods
2.1. Reagents
Medium molecular weight chitosan (MCH, viscosity 407 cP, 1% in 1% acetic acid, deacetylation degree 75%), Low molecular weight chitosan (LCH, viscosity 108 cP, 1% in 1% acetic acid, deacetylation degree 83%) and TPP (pentasodium tripolyphosphate) were purchased from Sigma-Aldrich (St. Louis, MO, USA).
Ethanol was obtained from Scharlau (Barcelona, Spain). Formic acid (99%) was from Acros Organics (Madrid, Spain) and acetonitrile HPLC grade from Macron Fine Chemicals (Madrid, Spain). Phenolic compounds standards (HPLC purity ≥ 95%) such as chlorogenic acid was from Sigma-Aldrich (Madrid, Spain). Neochlorogenic acid, caftaric acid, cryptochlorogenic acid, orientin, luteolin, 3,4-Dicaffeoylquinic acid, 1,5-Dicaffeoylquinic acid, 3,5-Dicaffeoylquinic acid, 4,5-Dicaffeoylquinic acid, apigenin, rutin and vicenin II were from Phytolab (Madrid, Spain). Ethyl gallate, apigenin 7-O-glucoside, caffeic acid and luteolin 7-O-glucoside, luteolin 7-O-glucuronide were obtained from Extrasynthese S.A. (Genay, France).
2.2. UAE (ultrasound assisted extraction) yarrow extract
Inflorescences and upper dried leaves of Achillea millefolium L. (yarrow) were supplied by a Spanish company specialized in plant material supplies (Murciana Herboristería, Murcia, Spain). The sample was ground in a knife mill (Grindomix GM 200, Retsch, Llanera, Spain) and the particle size was reduced to < 500 µm.
UAE was carried out following the method described in Villalva et al. (Citation2021). Briefly, a Branson 250 digital device (Branson Ultrasonic, Danbury, USA) with an electric power of 200 W and frequency of 60 Hz was employed. Grounded plant material (20 g) was extracted with ethanol (ratio of 1:10, plant:solvent), for 20 min and 60% amplitude using a probe of ½’ diameter. Next, samples were filtered, and ethanol was removed under rotary vacuum evaporation at 308.15 K (IKA RV 10, Madrid, Spain).
2.3. Determination of the antiproliferative activity
DLD-1 cells (human colorectal adenocarcinoma cell line) were obtained from the ATCC (Manassas, VA, USA) and cultured in RPMI 1640 media supplemented with 10% fetal bovine serum (FBS), 100 mg/mL streptomycin, 2 mM L-glutamine and 100 U/mL penicillin (Gibco, Paisley, UK), at 310.15 K in 95% humidified air containing 5% CO2.
The cytotoxic and antiproliferative activities of the extract in DLD-1 cell line were determined by the MTT assay. Briefly, cells in the exponential growth phase were seeded in 96-multiwell plates and grown for 24 h. Then, media was replaced with 200 µL media containing serial concentrations of yarrow extract (dissolved in DMSO) for 48 h. The number of viable cells was determined at time zero (control growth wells) and after treatments. To determine the number of viable cells, tetrazolium MTT salt solution (Sigma-Aldrich, St. Louis, MO, USA) was added for 3 h and the formazan produced was solubilized by adding DMSO and measured using a spectrophotometer (λ = 560 nm) (Biochrom Asys UVM 340 Microplate Reader; ISOGEN, De Meern, The Netherlands). Parameters for 50% of cell viability inhibition (IC50) were calculated accordingly to NIH definitions using a logistic regression (Monks et al., Citation1991).
2.4. CH particles containing UAE yarrow extract
2.4.1. Ionic gelation
CH particles by ionic gelation were obtained following the method described by Da Silva et al. (Citation2013) with adaptations. Once MCH or LCH (1% w/v) were dissolved in the acetic acid solution (1% v/v), the yarrow extract (2, 1 and 0.5 mg/mL) was added, and pH value was adjusted to 5.8 with 1 M sodium hydroxide. Then, TPP was dissolved in milli-Q water at 0.1% (w/v) and different volumes of TPP solution were added to chitosan solution under magnetic stirring at room temperature for 20 min. The ratios chitosan: TPP essayed were 4:1, 5:1 and 6:1. Next, the suspension was centrifugated (26000 g, 45 min, 298.15 K) and the supernatant discarded to obtain the particles. The particles were frozen and then freeze-dried (LyoBeta 15, Telstar, Spain) and stored at 277.15 K until analysis were performed.
2.4.2. Spray-drying
MCH or LCH microparticles containing yarrow extract were prepared by spray-drying according to Cabral et al. (Citation2018) with adaptations. Chitosan (0.75% w/v) was dissolved in acetic acid (0.4% v/v). Then, different yarrow ethanolic extract concentrations were added and mixed for 2 h. The mass ratios studied of chitosan:extract were 4:1 and 6:1 (w/w).
All solutions were submitted to the spray dryer equipment (Mini büchi B-191, Switzerland) at a feed rate of 4 mL/min. Inlet and outlet air temperature and aspiration rate were set to 443.15 K, ≈343.15 K, and 60%, respectively. The microparticles obtained were stored at 277.15 K until experiments were carried out.
2.5. Analysis of phenolic composition and quantification by HPLC-PAD
Chromatographic analyses were performance using an Agilent HPLC 1260 Infinity series system with a PAD system (Agilent Technologies Inc., Santa Clara, CA, USA) as described in Villalva et al. (Citation2018). Summarily, the system was equipped with an ACE Excell 3 Super C18 column (150 mm × 4.6 mm, 3 μm particle size) protected by a guard column ACE Excell 3 C18 (10 mm × 3 mm) at 308.15 K.
The mobile phase consisted of milli Q water:formic acid 0.1% (v/v) (solvent A) and acetonitrile (solvent B) keeping a constant flow rate of 0.5 mL/min. The gradient elution was carried out as follows: 0 min, 0% B; 1 min, 0% B; 6 min, 15% B; 21 min, 25% B; 26 min, 35% B; 36 min, 50% B; 41 min, 50% B; 43 min, 100% B; 53 min, 100% B; 55 min, 0% B; 60 min, 0% B. Samples were centrifuged and filtered by a 0.45 μm PVDF filter prior their injection (20 µL). Data were acquired at 280, 320, 340 and 360 nm. The identification of phenolic compounds was done on the basis of its retention time and UV-Vis spectrum in comparison with authentic standards and/or previous HPLC-PAD-ESI-QTOF analysis (Villalva et al., Citation2022). 320, 340 or 360 nm were used as specific wavelengths for the quantification of hydroxycinnamic acids, flavones or flavanols, respectively. Moreover, quantification of the targeted compounds was conducted using calibration curves of pure analytical standards. In the case of phenolic compounds with unavailable commercial standard, calibration curves of compounds with chemical similarity were employed, e.g. apigenin 7-O-glucoside for apigenin derivatives, and luteolin 7-O-glucoside curve for luteolin derivative. Ethyl gallate was used as internal standard.
2.6. Characterization of the chitosan particles containing yarrow extract
2.6.1. Determination of yield, particle size, zeta potential and polydispersity index (PDI)
The yield values for all formulations were calculated as follows (EquationEq. 1(1)
(1) ):
(1)
(1)
The mean particle diameter, zeta potential and polydispersity index were determined using a Zeta-sizer Ultra (Malvern Instruments Ltd, Malvern, UK). Previously, the particles were dispersed in milli-Q water.
2.6.2. Determination of encapsulation efficiency (EE)
The encapsulation efficiency (EE) of yarrow phenolic compounds in the particles obtained by ionic gelation was determined in the recovered supernatant after centrifugation of the particles (26000 g, 45 min at room temperature). The supernatants were collected and centrifuged again (16000 g, 45 min, room temperature) using the Amicon 3K filter (VWR, USA) before HPLC analysis. Therefore, the non-encapsulated compounds were measured and the EE % was calculated using EquationEq. 2(2)
(2) . The encapsulation efficiency of the individual phenolic compounds (individual EE %) was also calculated in the supernatant using EquationEq. 3
(3)
(3) .
(2)
(2)
(3)
(3)
To obtain the encapsulation efficiency of yarrow phenolic compounds in particles achieved by spray-drying, 45 mg of the particles were dispersed in 5 mL of water and shaken for 10 minutes. Then, 500 µL of the supernatant (non-encapsulated compounds) were centrifuged for 16000 g x 45 min at room temperature using Amicon filter 3K (VWR, USA) and analyzed by HPLC-PAD. The total and individual EE (%) were calculated according to EquationEqs. 2(2)
(2) and Equation3
(3)
(3) .
2.7. Release of phenolic compounds from yarrow particles at pH 2 and 7.4
The release of phenolic compounds from the particles was studied in two different media: phosphate buffered saline (PBS) pH 2 and 7.4. For this purpose, 45 mg of particles were suspended in 5 mL of each PBS solution. The suspensions were placed in a water bath at 310.15 K under agitation. At 5 min, 1, 2 and 3 h, 350 µL of the solution was collected from each tube and centrifuged with Amicon filter 3K (VWR, USA) for 16000 g 45 min at room temperature. The supernatants were then analyzed by HPLC-PAD and the amount of phenolic compounds released at each time was calculated.
2.8. In vitro simulated gastrointestinal digestion
The in vitro digestion was carried out simulating the oral, gastric and intestinal phases employing a titrator Titrino Plus 877 (Methrom AG, Herisau, Switzerland). For this purpose, the method described by Villalva et al. (Citation2018) with some modifications was followed. Briefly, the oral phase consisted of 100 mg of particles mixed with 5 mL of milli-Q water and 100 µL of α-amylase from human saliva type XIIIA (Sigma-Aldrich, St. Louis, MO, USA) for 2 min at 310.15 K. Next, 25 mL of acidic water (pH 2), 127 mg of porcine mucosal pepsin (536 U/mg) (Sigma-Aldrich, St. Louis, MO, USA) was added and the pH was adjusted to 2 with 0.1 M HCl and shaked for 1 h at 310.15 K in darkness. After gastric digestion, intestinal digestion was initiated by adjusting the pH to 7.5 with 1 M NaOH. Then, 0.463 mL of 325 mM CaCl2 (Sigma-Aldrich, Madrid, Spain) and 1.389 mL of 3.25 M NaCl (Sigma-Aldrich, Madrid, Spain) were added. Subsequently, a bile pancreatic extract consisting of 115.7 mg of bile salts (Sigma-Aldrich, St. Louis, MO, USA) was added in 2.8 mL of 3.32 mg/mL pancreatin (Sigma-Aldrich, St. Louis, MO, USA) dissolved in 10 mM trizma-maleate buffer and incubated for 2 h at 310.15 K in the dark, controlling the pH value to 7.5. After 2 h, the sample was cooled to inactivate the enzymes and centrifuged at 11000 rpm for 15 min. The supernatant obtained was freeze-dried, then dissolved in DMSO and centrifuged for 40 min at 16000 g through Amicon filter 3K (VWR, USA) to remove any remaining chitosan, filtered through a 0.45 µm PVDF filter and analyzed by HPLC-PAD.
2.9. Statistical analysis
The statistical analysis was performance by Statgraphics v. Centurion XVI software for Windows (Statpoint Inc., Warranton, VA). The one-way analysis of variance (ANOVA) was used following Fisher’s least significant difference test (LSD) with a p ≤ 0.05.
All assays were carried out in triplicate.
3. Results and discussion
3.1. Phenolic characterization of UAE yarrow extract and antiproliferative activity
UAE yarrow extract was carried out using ethanol in a ratio of 1:10 (plant: solvent) and submitted to ultrasounds for 20 min. These extraction conditions were supported by previous studies (data not shown) in order to obtain an extract with a high content in phenolic compounds, mainly CQAs and DCQAs, since these compounds were reported to possess anticancer activity.
The extract phenolic compounds characterization was performed by HPLC-PAD (). As shown in , 20 compounds were identified, highlighting chlorogenic acid, together with 1,5- and 3,5-DCQAs as the main compounds. 4,5-DCQA was also detected, although in a lesser extent. Besides, the presence of luteolin, apigenin and its derivatives presented in the extract was also remarkable.
Figure 1. Chromatogram of phenolic compounds of UAE yarrow extract (λ = 280 nm). The numbers of the peaks correspond to the compounds listed in . I.S.: internal standard (Ethyl gallate).
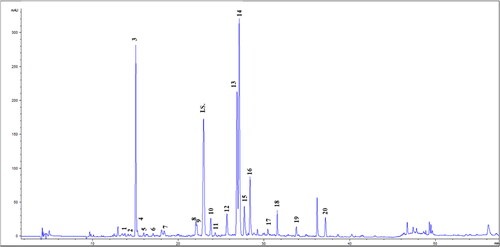
Table 1. Phenolic composition of UAE yarrow extract (mg compounds/g extract).
The determination of antiproliferative activity of this extract was carried out using DLD-1 cells (human colorectal adenocarcinoma cell line). IC50 values after 48 h of treatment with the extract showed a value of 78.6 µg/mL. Pereira et al. (Citation2018) also reported that an Achillea millefolium hydroethanolic extract presented an IC50 value of 70.8 µg/mL using HCT-15 cells (human colorectal adenocarcinoma cells). This antiproliferative activity has been attributed to the presence of chlorogenic acid and DCQAs in the extracts (Amigo-Benavent et al., Citation2017; Gupta et al., Citation2022).
3.2. Ionic gelation: particles formation and characterization
3.2.1. Particles formation
Since CH and TPP concentrations affected the formation of CH particles by ionic gelation, previous experiments were carried out in order to determine the most suitable CH:TPP ratio for particle formation. In this work, for LCH and MCH, the CH:TPP ratios essayed were 4:1, 5:1 and 6:1 in presence of 0.5 mg/mL of extract. The results showed that using the ratio 4:1 no particles were obtained. Taking into account that particles formation is produced by the intermolecular crosslinking of CH amino groups positively charged and TPP negative charged phosphate group (Cerchiara et al., Citation2015), the ratio 4:1 could employed a small amount of CH in comparison with TPP quantity.
Preliminary essays also included testing the influence of different yarrow extract concentrations (2, 1, 0.5 mg/mL) in the particles formation (CH:TPP ratios 5:1 and 6:1). When employing 2 mg/mL, particles were not produced and with 1 mg/mL the yield obtained was very small. This result could be related to an excessive amount of extract, since Da Silva et al. (Citation2015) reported a competitive interaction between phenolic -OH and phosphate groups of TPP for chitosan protonated amino groups.
After these results, for both LCH and MCH, two CH:TPP ratios (5:1 and 6:1) and 0.5 mg/mL extract concentration were selected for further assays.
3.2.2. Particles characterization
showed the yield, particle size, zeta potential, polydispersity index (PDI) and the encapsulation efficiency (EE) for all the developed formulations. The yields values were higher when using MCH. However, no significant differences were obtained between the two CH:TPP ratios used for any of the CHs tested.
Table 2. Characterization of formulations obtained by ionic gelation (mean ± SD, n = 3).
The particle sizes, ranged from 646.0 to 831.2 nm, showing that LCH particles had a lower size compared to MCH particles (for the same CH:TPP ratio). Other authors (Kunjachan et al., Citation2014) also reported that rising the molecular weight of CH, generally the particle size increased. In addition, for LCH and MCH, when the ratio CH:TPP raised form 5:1 to 6:1, the particle size also increased.
The zeta potential presented positive values (from 22.13 to 23.57 mV), indicating the stability of the dispersions due to electrostatic repulsion. Zeta potential values around 20–30 mV mean that the formulated colloidal system is stable and that CH amino groups are on the particle surface (Da Silva et al., Citation2016). The PDI values of the samples, ranged between 0.43 and 0.59, indicating an uniform particle distribution (Hesami et al., Citation2021).
Regarding the encapsulation efficiency (EE), the EE values obtained were similar for all the formulations, being slightly higher when a CH:TPP ratio of 5:1 was used for both types of CH. The determination of the individual phenolics EE () was developed to evaluate the EE of compounds previously described as potential agents against colorectal cancer (chlorogenic acid, DCQAs, luteolin, apigenin and their derivatives). The results showed that the EE of the phenolic compounds studied was closely related to its polarity. Moreover, for all formulations, the most polar compounds such as chlorogenic acid presented the lowest percentage of encapsulation (from 5.30 to 14.36%). Nallamuthu et al. (Citation2015) described a higher EE (45%) for chlorogenic acid (0.5 mg/mL) in CH nanoparticles obtained by ionic gelation, although they encapsulated only chlorogenic acid and not a plant extract. However, Chignola et al. (Citation2022) also reported an EE of 16.1 ± 1.3% for chlorogenic acid in CH beads crosslinked with TPP. By decreasing the phenolic compound polarity, its percentage of encapsulation increased, up to 100% for the most nonpolar phenolics (apigenin and luteolin). DCQAs encapsulation ranged from 42.43% to 84%, presenting 4,5-DCQA the highest value. The nanoparticles obtained with a CH:TPP ratio 5:1 showed a higher EE for chlorogenic acid, although for the rest of the compounds no significant differences were observed among the different formulations.
Table 3. Encapsulation efficiency (%) of different phenolic compounds in formulations obtained by ionic gelation (mean ± SD, n = 3).
Considering these results, nanoparticles formulated with a LCH:TPP ratio 5:1 were chosen for controlled release experiments, since this formulation presented, within the CH:TPP 5:1 ratio, the lowest particle size values.
3.3. Spray-drying: particles formation and characterization
3.3.1. Particles formation
In order to determine the optimal suspension viscosity, previous assays with different LCH and MCH (1, 0.75 and 0.5% (w/v)) and acetic acid (1, 0.5 and 0.4% (v/v)) concentrations were developed. Suspensions with a high viscosity may block the atomizer and decrease the encapsulation yield (Akbari-Alavijeh et al., Citation2020). 0.75% of LCH dissolved in 0.4% of acetic acid presented the best viscosity conditions for further studies.
Two yarrow extract concentrations, expressed as LCH: extract ratios (4:1 and 6:1), were also tested to optimize formulations. The amount of extract included in these two formulations was 1.88 and 1.25 mg/mL for 4:1 and 6:1, respectively.
3.3.2. Particles characterization
All the parameters used to characterize spray-drying particles are shown in . As can be observed, an increment of the polymer in the polymer:extract ratio produced an important increase in the yield values, from 18.45 to 34.0%. Cabral et al. (Citation2018) also obtained a yield value of 35.12% in the encapsulation process of a jabuticaba peel extract using a 6:1 CH:extract ratio. CH microparticles prepared by the spray-drying method in laboratorial scale frequently presented relative low yields. This fact could be due both to the small amount of material employed and the loss of the smallest particles during the process (Endo et al., Citation2012; Casanova et al., Citation2016). However, as larger volumes of solids are used in the industrial production of CH microparticles, the obtained yields could be improved (Gelfuso et al., Citation2011).
Table 4. Particle characterization of formulations obtained by spray-drying (mean ± SD, n = 3).
As rising the quantity of extract in the formulations, the particle size increased. Thus, particles with a 6:1 CH:extract ratio presented the lower size. Zeta potential values showed that both formulations were stable. Regarding PDI values, microparticles with 6:1 CH: extract ratio presented a higher uniformity than those obtained with 4:1 CH: extract ratio.
EE values were similar for both formulations and in both cases higher than 94%. This value was similar to that reported by Chaumun et al. (Citation2020) for the encapsulation of a Laurus nobilis L. extract in modified CH particles. EE for individual phenolic compounds is shown in . Both formulations presented for all compounds EE percentages superior to 93%.
Table 5. Encapsulation efficiency (%) of different phenolic compounds in formulations by spray-drying (mean ± SD, n = 3).
After particles characterization, results showed that spray-drying microparticles presented higher EE (%) values with respect to particles obtained by ionic gelation, mainly for chlorogenic acid. Thus, Cutrim et al. (Citation2019) also reported that ionic gelation seemed not be an efficient method for the encapsulation of compounds with an intermediate polarity such as phenolic acids and flavonoids, resulting in lower EE values. They proposed to employ this encapsulation technique mainly to non-polar compounds. However, ionic gelation particles were smaller and had higher yields values. These results are in concordance with those reported by Di Santo et al. (Citation2021). These authors reviewed the encapsulation of several phenolic compounds using chitosan and ionic gelation method, indicating that particles obtained presented sizes ranged between 65–1030 nm. Meanwhile, when spray-drying technique was employed to encapsulate phenolic compounds, higher particle sizes, generally microparticles, were obtained (Cabral et al., Citation2018; Chaumun et al., Citation2020).
Considering these data, ionic gelation nanoparticles formulated with a LCH:TPP ratio 5:1 and spray-drying microparticles obtained with 6:1 CH:extract, were selected for the controlled release assays.
3.4. Controlled release studies at pH 2 and 7.4
The release studies show the ability of the formulated particles to deliver the entrapped phenolic compounds in a controlled way to the medium. Thus, the release profile of the different phenolic compounds from the two chosen formulations (ionic gelation nanoparticles with LCH:TPP ratio 5:1 and spray-drying microparticles with 6:1 CH: extract) was carried out in a phosphate-buffered saline (PBS) solution at pH 2 and at pH 7.4, in order to simulate gastrointestinal pHs.
The results for ionic gelation nanoparticles are showed in . At pH 2 (), chlorogenic acid presented an important initial burst (59.64%, at 5 min), that remained constant at 1, 2 and 3 h. DCQAs, except for 4,5-DCQA, presented a small release after 5 min, which slightly increased after 1 h and then remained constant throughout the study. At 3 h, 1,5-DCQA presented the highest release (20.77%.) No release of any other phenolic compounds was detected after 3 h. These results indicated that chlorogenic acid could be mainly located on or near the surface of the particles, since a high initial delivery was related to the desorption of compounds located on the surface or in the outer layers of the particle (Casanova et al., Citation2016). However, it cannot be ruled out that this behavior could be also influenced by the affinity of this phenolic for the PBS medium to develop the release experiments, since the release medium can easily penetrate into the particle and dissolves the entrapped chlorogenic acid to outside (Nallamuthu et al., Citation2015).
Figure 2. Amount (%) of phenolic compounds released after 5 min, 1, 2 and 3h from particles obtained by ionic gelation at pH 2 (A) and pH 7.4 (B) (mean ± SD, n = 3). Compounds such as luteolin derivative, luteolin 7-O-glucoside, luteolin 7-O-glucuronide, apigenin 7-O-glucoside, 4,5-DCQA, apigenin derivatives, luteolin and apigenin are not represented in the graph due to their 0% release.
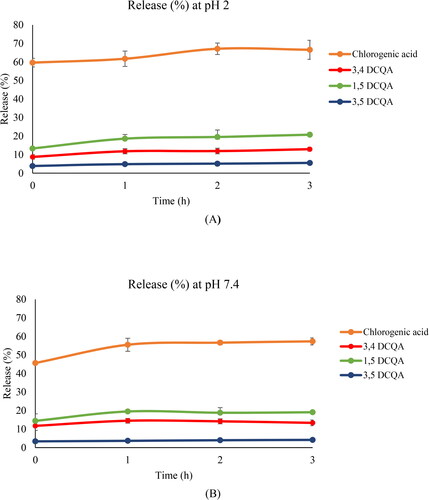
DCQAs presented a small initial release that could indicate a longer diffusional distance between their location and the receptor solution and/or a lower affinity to release medium used, compared to chlorogenic acid. In addition, the possibility of interconversions between the different DCQAs isomers due to the pH of the medium must be taken into account.
The release profiles at pH 7.4 () from this formulation were similar to those obtained at pH 2. Thus, chlorogenic acid showed an important initial burst with a slightly increase after 3 h, although its release after 3 h was lower than at pH 2. This result could be linked to the higher solubility of CH in acid pH (Harris et al., Citation2011). The DCQAs also presented, at this pH, a small initial release that increased after 3 h, with 1,5-DCQA standing out. None of the other phenolic compounds were released.
These data indicated that most phenolic compounds remained encapsulated in a high percentage within the nanoparticles after 3h, at both pHs. Thus, this formulation is therefore suitable for transporting yarrow phenolic compounds to the colon, where these particles could be degraded by the enzymes of the colonic microbiota, releasing the phenolic compounds and thus exerting their antiproliferative activity.
Regarding release profiles for spray-drying microparticles at pH 2 (), for most of phenolics a small initial release was observed, followed by an increase at 1 h, with a constant release up to 3 h. Chlorogenic acid showed the higher release values at 3 h (56.91%). DCQAs release at 3 h ranged between 9.65–36.99%, being higher for 1,5- and 3,4-DCQAs. Among luteolin and apigenin derivatives, luteolin dihexoside showed the highest release at 3 h (33.25%).
Figure 3. Amount (%) of phenolic compounds released after 5 min, 1, 2 and 3h from spray-drying particles at pH 2 (A) and pH 7.4 (B) (mean ± SD, n = 3). Compounds such as luteolin 7-O-glucoside, luteolin 7-O-glucuronide, apigenin derivatives, luteolin and apigenin are not represented in the graph due to their 0% release.
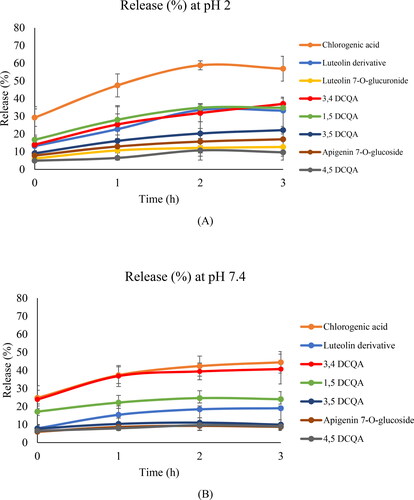
The release profiles at pH 7.4 were similar to pH 2, although for most compounds the amount released after 3 h were lower than at pH 2. As indicated previously, these results could be related to the better solubility of CH in acid pH (Harris et al., Citation2011).
These results showed that spray-drying microparticles also could be proposed as colon delivery systems for the yarrow extract. However, it can be observed that the spray-drying microparticles showed a higher release of DCQAs and luteolin derivates than those obtained by ionic gelation. This fact could be due to spray-drying microparticles presented higher EE % values in comparison to the ionic gelation nanoparticles for these phenolics.
3.5. In vitro simulated gastrointestinal digestion
The two formulations selected were also subjected to an in vitro gastrointestinal digestion to study the combined effect of pH and gastrointestinal enzymes on the formulations stability ().
Table 6. Phenolics (%) remained entrapped in particles after gastric and intestinal steps.
Regarding ionic gelation nanoparticles, the amount (%) of phenolics that remained in the nanoparticles after gastrointestinal digestion process () indicated that chlorogenic acid presented the lowest value (65.34%), meanwhile for the rest of compounds the values ranged from 80.30–97.30%. These results were similar to those obtained in the release kinetics at different pHs, although several compounds that totally remained (100%) entrapped in the particles after 3 h of release studies, after gastrointestinal process showed a small release (3–15%). These differences between the results obtained between kinetics and digestion could be related to the combined action of pH and gastrointestinal enzymes that takes place during in vitro digestion.
Since, after gastrointestinal step, most of yarrow phenolic compounds remained encapsulated in nanoparticles, this formulation enabled their application as colon specific delivery systems.
Respect to spray-drying microparticles, 67.65% of chlorogenic acid remained encapsulated after gastrointestinal digestion. Moreover, after gastric step, all DCQAs showed a similar entrapped percentage (between 71.15–79.73%) inside the microparticles. However, after intestinal step only a 42% of 3,4-DCQA remained encapsulated, meanwhile 1,5-, 3,5- and 4,5-DCQAs presented values >91%. These results could indicate that at least in part, 3,4-DCQA suffered an isomerization reaction in the digestion medium and was quantified like 1,5-, 3,5- or 4,5-DCQAs (Villalva et al., Citation2020). This phenomenon was also observed in the ionic gelation nanoparticles, although in a lesser extent. It must be noted that spray-drying microparticles contained a higher quantity of extract. The rest of phenolics remained inside the microparticles after the digestion step in a range from 78 to 95%.
These data also suggested that the designed spray-drying microparticles could be useful to allow the extract transport to the colon.
4. Conclusions
Chitosan particles loaded with a yarrow extract, which presented antiproliferative activity against adenocarcinoma cancer cells, were encapsulated using two techniques: ionic gelation and spray-drying. Ionic gelation nanoparticles were smaller and presented higher yields values than spray-drying microparticles, but spray-drying microparticles showed the best performance in terms of encapsulation efficiency (93%) and allowed the inclusion of a higher quantity of extract (1.25 mg/mL).
The release profile for the different phenolic compounds included in the two chosen formulations (ionic gelation nanoparticles with LCH:TPP ratio 5:1 and spray-drying microparticles with 6:1 CH: extract) at gastrointestinal pHs, showed an initial burst release for chlorogenic acid, followed by a constant sustained release. As reducing the polarity of the encapsulated compounds, their initial release from the particles was decreased. After gastrointestinal digestion, most of yarrow phenolic compounds remained encapsulated in both formulations, which enables their application as colon specific delivery systems.
Between the two formulations developed, spray-drying microparticles could be selected as the best formulation because the formulated microparticles allowed the encapsulation and the colon delivery of a higher amount of yarrow phenolics compounds previously described as potential agents against colorectal cancer (chlorogenic acid, DCQAs and luteolin and apigenin and its derivatives).
Authors’ contributions
María de las Nieves Siles-Sánchez: Data curation, Formal analysis, Investigation, Methodology, Writing -original draft. Irene Fernández-Jalao: Methodology. Laura Jaime De Pablo: Conceptualization, Funding acquisition, Resources, Writing- review & editing, Supervision, Project administration. Susana Santoyo: Conceptualization, Resources, Supervision, Funding acquisition, Project administration, Writing-review & editing.
Acknowledgments
M. N. Siles-Sánchez thanks Universidad Autónoma de Madrid for the grant ‘Formación de Personal Investigador (FPI) UAM 2019’.
Disclosure statement
The authors state that they have no conflict of interests to expose.
Data availability statement
Data available within the article and its supplementary materials.
Additional information
Funding
References
- Akbari-Alavijeh S, Shaddel R, Jafari SM. (2020). Encapsulation of food bioactives and nutraceuticals by various chitosan-based nanocarriers. Food Hydrocolloids 105:1. doi: 10.1016/j.foodhyd.2020.105774.
- Akram M. (2013). Minireview on Achillea millefolium Linn. J Membr Biol 246:661–12. doi: 10.1007/s00232-013-9588-x.
- Amigo-Benavent M, Wang S, Mateos R, et al. (2017). Antiproliferative and cytotoxic effects of green coffee and yerba mate extracts, their main hydroxycinnamic acids, methylxanthine and metabolites in different human cell lines. Food Chem Toxicol 106:125–38. doi: 10.1016/j.fct.2017.05.019.
- Arévalo-Pérez R, Maderuelo C, Lanao JM. (2020). Recent advances in colon drug delivery systems. J Control Release 327:703–24. doi: 10.1016/j.jconrel.2020.09.026.
- Cabral BRP, de Oliveira PM, Gelfuso GM, et al. (2018). Improving stability of antioxidant compounds from Plinia cauliflora (jabuticaba) fruit peel extract by encapsulation in chitosan microparticles. J Food Eng 238:195–201. doi: 10.1016/j.jfoodeng.2018.06.004.
- Casanova F, Estevinho BN, Santos L. (2016). Preliminary studies of rosmarinic acid microencapsulation with chitosan and modified chitosan for topical delivery. Power Technology, 297:44–9. doi: 10.1016/j.powtec.2016.04.014.
- Cerchiara T, Abruzzo A, Di Cagno M, et al. (2015). Chitosan based micro- and nanoparticles for colon-targeted delivery of vancomycin prepared by alternative processing methods. Eur J Pharm Biopharm 92:112–9. doi: 10.1016/j.ejpb.2015.03.004.
- Chaumun M, Goëlo V, Ribeiro AM, et al. (2020). In vitro evaluation of microparticles with Lauris nobilis L. extract prepared by spray-drying for application in food and pharmaceutical products. Food Bioprod Process 122:124–35. doi: 10.1016/j.fbp.2020.04.011.
- Chignola R, Mainente F, Zoccatelli G. (2022). Rheology of individual chitosan and polyphenol/chitosan microparticles for food engineering. Food Hydrocolloids 132:107869. doi: 10.1016/j.foodhyd.2022.107869.
- Cutrim CS, Alvim ID, Cortez MAS. (2019). Microencapsulation of green tea polyphenols by ionic gelation and spray chilling methods. J Food Sci Technol 56:3561–70. doi: 10.1007/s13197-019-03908-1.
- Da Silva SB, Amorim M, Fonte P, et al. (2015). Natural extracts into chitosan nanocarriers for rosmarinic acid drug delivery. Pharm Biol 53:642–52. doi: 10.3109/13880209.2014.935949.
- Da Silva SB, Ferreira D, Pintado M, Sarmento B. (2016). Chitosan-based nanoparticles for rosmarinic acid ocular delivery-In vitro tests. Int J Biol Macromol 84:112–20. doi: 10.1016/j.ijbiomac.2015.11.070.
- Da Silva SB, Oliveira A, Ferreira D, et al. (2013). Development and validation method for simultaneous quantification of phenolic compounds in natural extracts and nanosystems. Phytochem Anal 24:638–44. doi: 10.1002/pca.2446.
- Di Santo MC, D’ Antoni CL, Domínguez Rubio AP, et al. (2021). Chitosan-tripolyphosphate nanoparticles designed to encapsulate polyphenolic compounds for biomedical and pharmaceutical applications − A review. Biomed Pharmacother 142:111970. doi: 10.1016/j.biopha.2021.111970.
- Dias MI, Barros L, Dueñas M, et al. (2013). Chemical composition of wild and commercial Achillea millefolium L. and bioactivity of the methanolic extract, infusion and decoction. Food Chem 141:4152–60. doi: 10.1016/j.foodchem.2013.07.018.
- Endo EH, Ueda-Nakamura T, Nakamura CV, Filho BPD. (2012). Activity of spray-dried microparticles containing pomegranate peel extract against Candida albicans. Molecules 17:10094–107. doi: 10.3390/molecules17091009.
- Gelfuso GM, Gratieri T, Simão PS, et al. (2011). Chitosan microparticles for sustaining the topical delivery of minoxidil sulphate. J Microencapsul 28:650–8. doi: 10.3109/02652048.2011.604435.
- Goulas V, Hadjisolomou A. (2019). Dynamic changes in targeted phenolic compounds and antioxidant potency of carob fruit (Ceratonia siliqua L.) products during in vitro digestion. LWT 101:269–75. doi: 10.1016/j.lwt.2018.11.003.
- Gupta A, Atanasov AG, Li Y, et al. (2022). Chlorogenic acid for cancer prevention and therapy: Current status on efficacy and mechanisms of action. Pharmacol Res 186:106505. doi: 10.1016/j.phrs.2022.106505.
- Harris H, Lecumberri E, Mateos-Aparicio I, et al. (2011). Chitosan nanoparticles and microspheres for the encapsulation of natural antioxidants extracted from Ilex paraguariensis. Carbohydr Polym 84:803–6. doi: 10.1016/j.carbpol.2010.07.003.
- Herrera-Balandrano DD, Beta T, Chai Z, et al. (2021). Effect of in vitro gastrointestinal digestion on the phenolic composition and antioxidant capacity of Burdock roots at different harvest time. Food Chem 358:129897. doi: 10.1016/j.foodchem.2021.129897.
- Hesami G, Darvishi S, Zarei M, Hadidi M. (2021). Fabrication of chitosan nanoparticles incorporated with Pistacia atlantica subsp. kurdica hulls’ essential oil as a potential antifungal preservative against strawberry grey mold. Int J of Food Sci Tech 56:4215–23. doi: 10.1111/ijfs.15110.
- Hussein AA, Al-Ezzy RM, Abdallah MT. (2019). Biochemical, Enzymatic, and Immunological Study on Antimutagenic Achillea millefolium Methanolic Extract in vivo. J Pharm Pharmacol 7:69–74. doi: 10.17265/2328-2150/2019.02.004.
- Kunjachan S, Jose S, Lammers T. (2014). Understanding the mechanism of ionic gelation for synthesis of chitosan nanoparticles using qualitative techniques. Asian Journal of Pharmaceutics 4:148–153 doi: 10.22377/ajp.v4i2.220.
- Kurakula M, Gorityala S, Moharir K. (2021). Recent trends in design and evaluation of chitosan-based colon targeted drug delivery systems. J Drug Delivery Sci Technol 64:102579. doi: 10.1016/j.jddst.2021.102579.
- Liu S, Fang Z, Ng K. (2022). Incorporating inulin and chitosan in alginate-based microspheres for targeted delivery and release of quercetin to colon. Food Res Int 160:111749. doi: 10.1016/j.foodres.2022.111749.
- Mohammadhosseini M, Sarker SD, Akbarzadeh A. (2017). Chemical composition of essential oils and extracts of Achillea species and their biological activities: a review. J Ethnopharmacol 199:257–315. doi: 10.1016/j.jep.2017.02.010.
- Monks A, Scudiero D, Skehan P, et al. (1991). Feasibility of a high-flux anticancer drug screen using a diverse panel of cultured human tumor cell lines. J Natl Cancer Inst 83:757–66. doi: 10.1093/jnci/83.11.757.
- Murad LD, Soares NCP, Brand C, et al. (2015). Effects of Caffeic and 5-caffeoylquinic acids on viability and cellular uptake in human colon adenocarcinoma cells. Nutr Cancer 67:532–42. doi: 10.1080/01635581.2015.1004736.
- Nallamuthu I, Devi A, Khanum F. (2015). Chlorogenic acid loaded chitosan nanoparticles with sustained release property, retained antioxidant activity and chemical bioavailability. Asian J Pharm Sci 10:203–11. doi: 10.1016/j.ajps.2014.09.005.
- Pereira JM, Peixoto V, Teixeira A, et al. (2018). Achillea millefolium L. hydroethanolic extract inhibits grown of human tumor cell lines by interfering with cell cycle an inducing apoptosis. Food Chem Toxicol 118:635–44. doi: 10.1016/j.fct.2018.06.006.
- Sabra R, Billa N, Roberts CJ. (2018). An augmented delivery of the anticancer agent, curcumin, to the colon. React Funct Polym 123:54–60. doi: 10.1016/j.reactfunctpolym.2017.12.012.
- Siles-Sánchez M. d l N, Jaime L, Villalva M, Santoyo S. (2022). Chitosan based micro/nanoparticles for improving colon delivery of marjoram phenolic compounds. Foods 11:3657. doi: 10.3390/foods11223657.
- Vilas-Boas AA, Oliveira A, Jesus D, et al. (2020). Chlorogenic acids composition and the impact of the in vitro gastrointestinal digestion on espresso coffee from single-dose capsule. Food Res Int 134:109223. doi: 10.1016/j.foodres.2020.109223.
- Villalva M, Jaime L, Aguado E, et al. (2018). Anti-inflammatory and antioxidant activities from the basolateral fraction of Caco-2 cells exposed to a rosmarinic acid enriched extract. J Agric Food Chem 66:1167–74. doi: 10.1021/acs.jafc.7b06008.
- Villalva M, Jaime L, Arranz E, et al. (2020). Nanoemulsions and aciddified milk gels as a strategy for improving stability and antioxidant activity of yarrow phenolic compunds after gastrointestinal digestion. Food Res Int, 130:108922. doi: 10.1016/j.foodres.2019.108922.
- Villalva M, Santoyo S, Salas-Pérez L, et al. (2021). Sustainable extraction techniques for obtaining antioxidant and anti-Inflammatory compounds from the Lamiaceae and Asteraceae Species. Foods 10:2067. doi: 10.3390/foods10092067.
- Villalva M, Silvan JM, Alarcón-Cavero T, et al. (2022). Antioxidant, anti-inflammatory, and antibacterial properties of an Achillea millefolium L. extract and its fractions obtained by supercritical anti-solvent fractionation against Helicobacter pylori. Antioxidants (Basel) 11:1849. doi: 10.3390/antiox11101849.