Abstract
Administration of heparin during extracorporeal procedures increases the risk of haemorrhage. Various reactor designs, including the use of heparinase and poly-L-lysine. HBr hollow fiber, have been investigated for the removal of heparin prior to the blood being returned to the patient; however, none of them have been implemented clinically. In this paper it is proposed that beads made from poly-L-lysine/alginate can be used to remove the heparin. The aim of this work is to perform the necessary experiments in order to get the information required to design a heparin removal reactor that uses these beads. The experiments are aimed at measuring the removal rates of heparin by the beads, testing the efficiency of the beads to remove heparin, determining repeatability and identifying factors that could influence the removal rate. Batch rate experiments using poly-L-lysine/alginate beads in saline solutions were performed to investigate the removal rate of heparin. The results, which indicate that heparin is efficiently removed, may lead to improved bioreactor designs.
INTRODUCTION
Heparin is introduced into the blood during the use of extracorporeal devices such as renal dialysis, to prevent clotting resulting from the blood contacting foreign surfaces such as the dialyser membrane. It is important to achieve a balance between under-coagulation which could result in clotting in the device, and over-heparinisation which exposes the patient to risks of prolonged bleeding [Citation[1]].
Heparin is an anticoagulant comprised of a heterogeneous group of glycosaminoglycans.
The main sugars occurring in heparin are listed by [Citation[2]] as:
α-L-iduronic acid 2-sulphate,
2-deoxy-2-sulphamino-α-D-glucose 6-sulphate,
β-D-glucuronic acid,
2-acetamido-2-deoxy-α-D-glucose,
α-L-iduronic acid.
Heparin is strongly acidic because of its content of covalently linked sulphate and carboxylic acid groups ().
Figure 1 Chemical structure of a single unit of unfractionated heparin (from [Citation[3]]).
![Figure 1 Chemical structure of a single unit of unfractionated heparin (from [Citation[3]]).](/cms/asset/290e4a86-4914-4aa3-814f-3d6b34748c27/ianb19_a_176937_f0001_b.gif)
Heparin is heterogeneous with respect to molecular size, and pharmacokinetic properties, with only about one third of the heparin molecules having anticoagulant properties. The molecular weight of heparin ranges from 3000 to 30000 [Citation[4]].
Heparin administration is the standard therapy for the treatment of deep vein thrombi [Citation[5]]. Heparin is also used frequently in extracorporeal therapy such as dialysers and blood oxygenators [Citation[6]].
The basic analytical method to measure heparin in saline was demonstrated and described by [Citation[7]] as follows: “a 2 mL aliquot of saline, 2 mL of phosphate buffer (pH 7.3) and 1 mL of Azure A solution (100 mg% Azure A diluted to 1:8.5) was added to a given volume of heparin solution. The solution was mixed and transferred to a glass cell. The color of the cell solution was matched immediately in a lovibond tintometer using the red and blue glasses.” A lovibond tintometer is a colorimeter, which uses color measurement for analysis of substances. The heparin content of the sample was determined from the red reading to provide a standard curve of the following shape ().
Figure 2 Schematic diagram of the standard curve obtained from [Citation[7]].
![Figure 2 Schematic diagram of the standard curve obtained from [Citation[7]].](/cms/asset/e72e4b0e-882f-4565-9cea-b50574be1a41/ianb19_a_176937_f0002_b.gif)
A modification of the above method was developed by [Citation[8]] in 1999 to measure the concentrations of unfractionated heparin in saline and described as follows: “A 4.5 mL volume of Azure II dye solution (0.01 mg/mL) was added to 0.5 mL of the heparin solution to be tested. The sample was mixed and incubated at room temperature for 1 min before measuring the absorbance at 500 nm. A standard curve for this assay was prepared by using solutions of known heparin concentrations ranging from 0 to 3 U/mL. The standard curve was linear in the above range.”
Attempted solutions to anticoagulation during hemodialysis include systemic heparinization, regional heparinization, low-dose heparinization, heparin-free hemodialysis in patients with high risks of bleeding, [Citation[1]], administering protamine to neutralize heparin and administering antithrombic drugs other than heparin [Citation[9]]. However the safety and efficiency of these methods remain uncertain. “One of the major barriers to the optimal dosing of heparin arises from the difficulty of monitoring the adequacy of anticoagulation during the short (usually three- to four-hour session) period of hemodialysis” [Citation[10]]. “The use of heparin and its antagonist protamine has been associated with potentially fatal complications in high-risk patients such as those suffering from acute renal failure or those who have undergone recent surgery” [Citation[11]].
The requirement for a safe and efficient bioreactor for heparin removal remains problematic. Such a reactor would be required to permit full heparinization of blood entering the extracorporeal circuit while facilitating the elimination of the heparin prior to the blood being returned to the patient [Citation[9]]. Heparin can also be degraded by immobilized heparinase I with the formation of non-toxic products [Citation[12]]. Alternatively protein bound to the walls of a hollow fiber dialyser would enhance the whole blood compatibility of the system, however the surface area requirements would remain impractical [Citation[13]]. Porous particles such as agarose or cellulose beads have also been proposed in order to optimize the protein or adsorbent loading per volume of device [Citation[14], Citation[9]]. Additional proposals include the neutralization of heparin by the addition of polyanions, enzymes or resins to clinical samples [Citation[15]]. Immobilised protamine [Citation[16]] and poly-L-lysine ligand coupled to agarose substrate [Citation[17]] are other methods employed to remove heparin from blood. However, according to the authors, additional research is required to use these methods for clinical purposes.
In order to expand on the above possibilities, it is proposed to use poly-L-lysine beads to remove heparin from saline solutions. The poly-L-lysine beads are made using the encapsulation procedure patented by [Citation[18]], and utilized by [Citation[19]] in South Africa to encapsulate liver cells. Batch rate experiments using the poly-L-lysine/alginate beads will be performed to obtain the necessary parameters required for the design of the reactor. The experiments in this article are designed to test issues like the efficiency of the beads to remove heparin, repeatability and some of the factors that could influence the rate.
APPARATUS AND METHODS
Calibration
Concentration of unfractionated heparin was determined using an Azure II dye assay as described by [Citation[8]]. A cintra 5 UV-VIS double beam spectrometer was used to measure the absorbency of heparin. A mixture of 900 µL of Azure II dye (0.01 mg/mL) and 100 µL of the heparin solution under test was placed in a 1 mL-quartz cuvette. The absorbency was then measured at a wavelength of 520 nm. A standard curve for this assay was prepared by using solutions of known heparin concentrations ranging from 0 to 3 U/mL. The standard curve was linear for this concentration range.
Formation of Poly-L-Lysine/Alginate Beads
The standard encapsulation procedure patented by [Citation[18]] was used to produce poly-L-lysine/alginate beads.
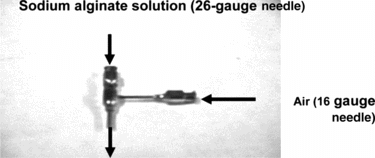
The droplet generator () allowed contact of air with sodium alginate solution and produced beads in spherical form.
Equal amounts of saline and 4% sodium alginate solution were mixed in a 10 mL syringe. The solution was extruded from the syringe by a syringe infusion pump (Harvard apparatus; Millis, MA) and pumped through the 26-gauge needle of the droplet generator. Air was allowed to flow through the 16-gauge needle of the droplet generator. The flowrate of the alginate solution was in a range of 0.1 mL/min to 0.4 mL/min, while the air from the cylinder was between 0.5 L/min and 4 L/min, depending on the required bead size. The droplets were allowed to fall into 300 mL of 100 mM calcium chloride solution and cured in the calcium chloride solution for 15 min. The beads were strained using a 0.45 µm mesh filter, washed and placed in 80-mL poly-L-lysine solution for 20 min. The beads were then strained and washed and placed in 200 mL of 0.2% sodium alginate solution for 5 min. The beads were strained and washed for a final time and placed in 200 mL of 50 mM sodium citrate solution for 6 min. The beads were then stored in saline solution until they were used in experiments.
Batch Rate Experiments
The aim of the rate experiments is to illustrate the efficiency of the poly-L-lysine beads and to fit a model to obtain the intrinsic rate. Although the rate limiting step cannot be identified, it could be expected that the magnitudes of rates measured in the batch experiments would be achieved in a well–designed reactor. The rate will depend on parameters such as concentration of heparin in the solution, time and the number of beads or the ratio of the volume of beads to the volume of solution. The experimental apparatus will be designed to reduce, and if possible eliminate, the mass transfer limitations between the beads and the solution by stirring the solutions. In this way the intrinsic removal rate that will be achieved in a reactor can be measured.
Saline solution containing a known concentration of heparin was added to a known volume of uniformly sized beads. The contents in the beaker were then stirred to ensure that the beads were in suspension and to maintain uniform exposure of heparin to the beads. Samples of 300 µL of the supernatant solution were taken out at time intervals from 0 seconds to 1.5 hours. The samples were centrifuged to separate the fragments of beads from the supernatant solution. The supernatant samples were then analyzed using the spectrometer.
As the experiments are aimed at measuring data that would be needed for the reactor design, the experimental programme is set up so that the measurements, analysis and interpretation are iterative. This approach is called process synthesis and the advantage of it is that one can gain relevant data for the design more quickly and efficiently.
RESULTS
Initial Measurement of Rate of Removal of Heparin
A fixed number of beads were used in a fixed volume of saline containing heparin. The aim of this experiment was to get an estimate of the magnitude of the removal rate of heparin by the beads and thereby establish whether the beads can be used for the purpose of removing heparin from a reactor. Approximately 8000±1000 poly-L-lysine/alginate beads of size 900 µm±100 µm were placed in 40-mL saline solution with a heparin concentration of 3 U/mL, which was stirred continuously at room temperature. Aliquots of 300 µL of the heparin solution were pipetted out at intervals from zero seconds to one and half hours. The absorbency of the samples was analyzed at a wavelength of 520 nm using the spectrometer. The results obtained from this experiment are shown in .
Figure 4 Graph of heparin concentrations during the rate experiment using 8000 beads and 40 ml of 3 U/mL heparin solution.
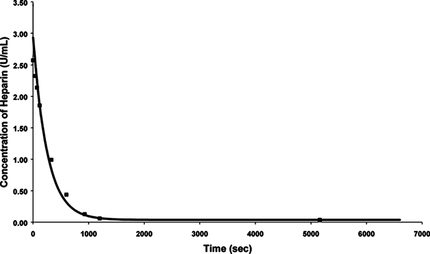
The results indicate that the beads can efficiently remove the heparin from the saline solution. The concentration of heparin in solution was reduced by half in about 100 seconds, which implies that the removal rate is fast enough for a practical design. Equilibrium was attained after approximately 1000 seconds. The average standard deviation for the results obtained was less than 2%.
The next set of experiments were performed to test the consistency of the results The rate experiments were repeated using constant variables, such as the number of beads (850±100 beads), volume of the heparin solution (23-mL), concentration of the heparin in the solution (3 U/mL), and the size of the beads (900 µm±100 µm). The number of beads used in this set of experiments was decreased from 8000 (used in the previous experiment) to 850 in order to try and saturate the beads. The experiments were repeated at room temperature. The results are shown in .
Figure 5 Repeat experiments for 850 beads of 900 µm diameter and 23 mL of 3 U/mL of heparin solution.
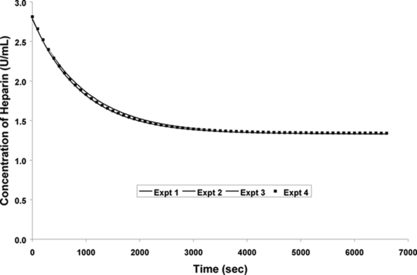
indicated that the results were consistent and repeatable. The standard deviation for the results was less than 2%, which was similar to the previous experiment.
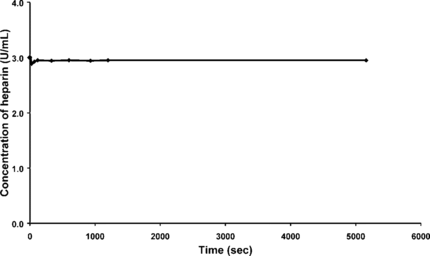
A control experiment to prove that heparin was not adsorbed onto the glass surface of the cuvettes and the beakers was performed. A saline solution of 40 mL with 3 U/mL of heparin, containing no beads, was stirred for 30 minutes. Samples of 300 µL of the solution were pipetted out from the stirring solution at different time intervals. The samples were then centrifuged as before and analyzed at 520 nm using the spectrometer ().
The results obtained from this experiment indicated that a negligible amount of heparin was adsorbed onto the glass surface. The results therefore indicate that the heparin is removed by the beads only and the rates measured are the rates of the absorption rate of heparin on the beads.
The next experiment was performed to check if any of the heparin was released back into the solution after some time. Poly-L-lysine/alginate beads that had been loaded with heparin were incubated in saline for one week at room temperature to determine if the adsorbed heparin was released back into the solution. Samples of the saline solution were taken out every day and analyzed to measure the concentration of heparin.
After analysis, no heparin was found in any of the samples, which implies that the absorbance of heparin on to the beads is an irreversible process.
Estimation of the Order of the Adsorption Process
In order to fit a model to the rate process, as a first approximation, assume that the rate can be described by a simple first order adsorption model.
For a first order adsorption process:where:x is the concentration of heparin in solution (liquid phase) in U/mL;t is the time in seconds;
K is the rate coefficient in seconds−1;xe is the concentration of heparin in U/ml in solution (liquid phase) at infinite time (equilibrium concentration).
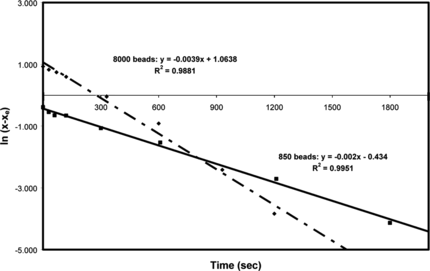
Equation (1) can be integrated and rearranged to give a linear equation.where xo is the initial concentration of heparin in the solution in U/mL.
Since the concentration of heparin towards the end of the experiment decreased very slowly, the final concentration was assumed to be the concentration of heparin at infinite time or the equilibrium concentration, which was obtained from the experiment. The initial concentration of heparin was 3 U/mL.
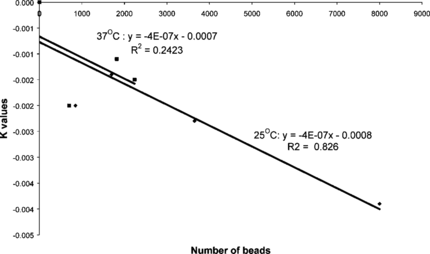
The curve of ln{x − xe} versus time t was plotted using the data given in and is shown in . The resultant straight line curve implies that the rate model is a simple first order adsorption process and the rate constant K = 0.0039 s−1. The data measured for the 800 beads () is also plotted in . It can be seen that this data, too, follows a straight line, but the rate constant K has a value of − 0.002 s−1, which is different to that for the large number of beads. This is not that surprising and the next step is the need to investigate the relationship between the number of beads and the rate constant.
Relation of Adsorption Rate to the Number of Beads
In order to design a reactor, it is essential to know the impact that the quantity of the beads would have on the adsorption process. It would be useful if a correlation could be obtained between the number of beads and the amount of heparin that can be adsorbed by the beads.
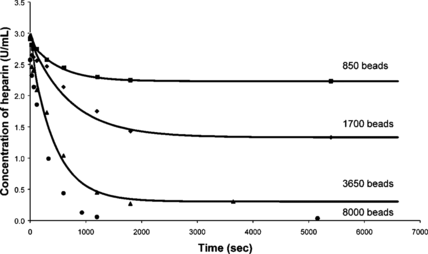
Rate experiments in saline solution were performed by varying the number of beads. The previous results together with the new data are presented in .
The final concentration obtained was assumed to be the concentration at the infinite time or the equilibrium concentration, since very little change was observed between the last two points. It can be seen that the initial slope depends on the number of beads and hence the rate constant K depends, as observed previously, on the number of beads. The data shown in was fitted to Equation (2) and all the data sets fitted the first order rate model. The rate constants for experiments at 25°C and 37°C are plotted versus the number of beads in .
It can be seen that the rate of absorption of heparin by the beads is linearly dependent on the number of beads.
Fitting an Isotherm to the Equilibrium Concentration Data Points
A classical isotherm for a heterogeneous flat surface is the Freundlich Isotherm, which is defined as follows:where:mi is a constant, which is positive and generally not an integer; ki is a constant;xe is the fluid phase concentration at equilibrium (concentration of heparin in saline solution at infinite time) in U/ml;qi is the adsorbed phase concentration in U/mL;
The amount of heparin adsorbed by the beads is equal to the initial amount of heparin in saline solution minus the final amount of heparin in the saline solution.
The assumptions for these equations are:
The volume of saline solution removed during the rate experiments is less than 10% of the initial volume of saline solution and is therefore assumed to be negligible. The final volume of the saline solution is thus approximately equal to the initial volume, which is equal to 40 mL.
The membrane thickness of the beads is negligible when compared to the radius of the beads (450 nm) and can therefore be ignored.
Equation (3) therefore becomes:where Nb is the number of beads and r is the radius of the beads in m.
Equation (5) can be rearranged as follows:
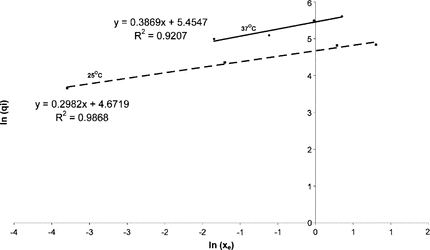
The data points were used to obtain the values of qi and the results were plotted on the graph in .
The results indicate that the equilibrium data points obtained from the rate experiments can be modeled using the Freundlich Isotherm. The gradient (mi) is positive and not an integer; however the values differ for the different temperatures. This difference could be attributed to experimental error. The Freundlich Isotherm can therefore be used to predict the equilibrium parameters that are essential for the reactor design.
DISCUSSION
The results indicate that heparin can be efficiently removed using poly-L-lysine/alginate beads with no heparinase. illustrated that the results obtained from the experiments were consistent and repeatable. The experiment performed in the absence of beads demonstrated that very little of the heparin was adsorbed onto the glass surface (). Results from the incubation experiment indicated that heparin adsorbed by the beads was not released back into the solution. If heparin removal was a diffusion process only, heparin would have been released into the saline solution to attain a new equilibrium concentration. Therefore, it was concluded that the removal was an adsorption process. The data obtained from the rate experiments showed an excellent fit to the first order adsorption model (). Increasing the number of beads, as illustrated in , increased the amount of heparin removed from the saline solution, while the rate constants decreased (). The results obtained from indicated that the Freundlich Isotherm could be used to correlate the data for the equilibrium concentrations.
CONCLUSION
The present study demonstrates that heparin can be efficiently removed from a saline solution using poly-L-lysine/alginate beads. The removal of heparin from these solutions is a first order adsorption process and depends on the number of beads. The rate is fast enough, as the half life is approximately 100 seconds for the initial experiments, thus this method appears to be a feasible method that can be used to remove heparin. The adsorption process at a particular temperature can be predicted using the Freundlich Isotherm. These results will ultimately provide some of the required parameters for the bioreactor design using poly-L-lysine/alginate beads. Further research is required to study the effect of these beads on the constituents of blood, the correlation between the volume and size of the beads and the adsorption rate.
REFERENCES
- Swartz, R.D. (1990). Clinical Dialysis (Appleton & Lange, East Norwalk) 2nd ed., Anticoagulation in Patients on Hemodialysis.
- http://www.drugs.com/PDR/Hep_Lock__Heparin_Lock_Flush_Solution__USP_.html. Prescription Drug Information for Consumers & Professionals, 2004, Heparin Lock Flush (Elkins Sinn), 06/2004. [CSA]
- Quader, A.M., Stump, L.S., Sumpio, B.E. (1998). J. Am. Coll. Surg. 187: 641–658. [INFOTRIEVE], [CSA], [CROSSREF]
- Hirsh, J., Anand, S.S., Halperin, J.L., Fuster, V. (2001). Circulation 103: 2994. [INFOTRIEVE], [CSA]
- http://medicine.ucsf.edu/htc/patient/patients.heparin.html. Hemostasis & Thrombosis Center, (2002). Heparin, University of California San Francisco: Hemostasis & Thrombosis Center, 06/2004. [CSA]
- http://www.rxmed.com/b.main/b2.pharmaceutical/b2.1.monographs/CPS-%20Monographs/CPS-%20(General%20Monographs-%20H)/HEPARIN.html. Rxmed. (2004). Heparin: Unfractionated, The Comprehensive Resource for Physicians, Drug and Illness Information, 06/2004. [CSA]
- Jaques, L.B., Monkhouse, F.C., Stewart, M. (1949). J. Physiol. 109: 41–48. [INFOTRIEVE], [CSA]
- Ameer, G.A., Harmon, W., Sasisekharan, R., Langer, R. (1999a). Biotechnol. Bioeng. 62(5): 602–608. [INFOTRIEVE], [CSA], [CROSSREF]
- Langer, R., Linhardt, R.J., Hoffberg, S., Larsen, A.K., Cooney, C.L., Tapper, D., Klein, M. (1982). Science 217: 261–263. [INFOTRIEVE], [CSA]
- Low, C.L., Bailie, G., Morgan, S., Eisele, G. (1996). Clinical Nephrology 45(2): 120–124. [INFOTRIEVE], [CSA]
- Broyer, M., Brunner, F.P., Brynger, H., Fassbinder, W., Guillou, P.J., Oules, R. (1986). Nephrol Dial. Transplant 1: 1–3. [CSA]
- Larsen, A.K., Newborne, P.M., Langer, R. (1986). Fundam. Appl. Toxicol. 7: 86–93. [INFOTRIEVE], [CSA], [CROSSREF]
- Vallar, L., Rivat, C. (1996). Artif Organs. 20(1): 8–11. [INFOTRIEVE], [CSA]
- Gejyo, F., Homma, N., Hasegawa, S., Arakawa, M. (1993). Artif Organs. 17(4): 240–243. [INFOTRIEVE], [CSA]
- Wenz, B., Burns, E.R. (1991) Am. J. Clin. Pathol. 96(3): 385–390. [INFOTRIEVE], [CSA]
- Yang, V.C., Port, F.K., Kim, J.S., Teng, C.L., Till, G.O., Wakefield, T.W. (1991). Anesthesiology 75(2): 288–297. [INFOTRIEVE], [CSA]
- Vertrees R.A., , et al. (1994). ASAIO Journal Poster Session M560–M564. [CSA]
- Chang, Thomas, M.S., Wong, Harry. (1992). US Patent No: 5084350., , [CSA]
- Vally, T. (2005). A Study Towards the Synthesis of a Hybrid Bioartificial Liver, PhD thesis, University of the Witwatersrand.
