Abstract
The development of β-lactam antibiotics has been a continious battle of the design of new compounds to withstand inactivation by the ever-increasing diversity of β-lactamases. Semisynthetic cephalosporins like cephalothin were synthesized from 7-Amino cephalosporanic acid (7-ACA), and thiophene-2-actetic acid using cephalosporin-C acylase enzyme was studied. The production of cephalosporin-C acylase by Pseudomonas diminuta was used and the growth kinetics studied. The optimum condition of enzyme activity was determined by using response surface methodology. A 23 full-factorial composite design was employed for experimental design and the result analyzed. The pH value and temperature for optimum activity were 6.5 and 32°C, respectively. The structural analog compound similar to the side-chain of semisynthetic cephalosporins, e.g., thiophene-2-actetic acid, was added. HPLC data analysis indicate that the concentration of cephalothin was 1.6 mg/mL.
INTRODUCTION
The 7-aminocephalosporanic acid (ACA) is the key intermediate for the production of semisynthetic cephalosporins [Citation[1]]. It is usually produced from cephalosporin-C (CPC) by the enzyme cephalosporin acylases [EC.3.5.1.11]. These enzymes are the groups of β-lactam acylases, highly specialized peptidases that are capable of cleaving the amide bond between a β-lactam nucleus and a side chain without damaging the β-lactam ring. Semisynthetic cephalosporins are the most widely used antibiotics. The total world-wide market value for cephalosporin antibiotics is fifth among the leading therapeutic agents worldwide. The industrial production of semisynthetic cephalosporins can be obtained either by chemical deacylation of CPC using toxic compounds, such as iminoether [Citation[2]] nitrosyl chloride [Citation[3]], or by enzymatic method. The chemical method of 7-ACA production involves cost-intensive multiple steps, complicated techniques that are time consuming and pollute the environment. To overcome the shortcomings of the chemical route, the bulk of 7-ACA produced today is by enzymatic deacylation of CPC [Citation[4]]. The cephalosporin-C is directly converted to 7-ACA by cephalosporin-C acylase enzyme [Citation[5], Citation[6]]. It was also found that the enzyme has the ability to catalyze the acylation of 7-ACA with corresponding organic acid [Citation[7]]. The effect of different organic compounds on the biosynthesis of CPC-acylase [Citation[8]] and batch production of 7-ACA by different microorganisms had also been conducted [Citation[9]]. Optimization of physiochemical parameters by the classical method involves changing one independent variable while keeping the other factors constant. The conventional methods for multifactor experiment design are time-consuming and incapable of detecting the true optimum, due especially to the interactions among factors. The limitation of a single factor optimization process can be eliminated by different techniques. One of the techniques is response surface methodology (RSM), which is used to explain the combined effect of all the factors. RSM is a collection of experimental strategies, mathematical model and statistical interference [Citation[10]]. The operational variables interact and influence each other; it is essential that the optimization method for these interactions can be determined [Citation[11]]. In the present studies, the conversion of CPC to 7-ACA and thiophene-2-acetic acid and 7-ACA to cephalothin were conducted and the optimization of the physiochemical parameters using response surface methodology for the processing strategies were established.
MATERIALS AND METHODS
Strain and Media
Pseudomonas diminuta NCIM 2865, obtained from National Collection of Industrial Microorganism, N.C.L., Pune, India, was used in the studies. The growth media composition was kept as: peptone 1.0%, beef extract 1.0%, sodium chloride 0.5%, glucose 2.0%. The pH and temperature for the growth for Pseudomonas diminuta were maintained at 7.0 and 28°C, respectively. The incubation time for the growth was 18 hrs. The composition of production media for cephalosporin acylase enzyme was: peptone 1.0%, yeast extract 1.0%, sodium chloride 0.5%, mono sodium glutamate 0.5%, glucose 0.05% [Citation[12]]. The pH and temperature for production was adjusted as 7.0 and 28°C. The inoculum level was maintained at 5% (V/V). The production time was allowed to follow up to 40 hrs.
Cell Wall Disruption
The cell wall lysis was done by Lysozyme-HCl treatment. An aqueous solution containing lysozyme HCl (5.0 mg) was added in 5.0 mL of activated cell suspension and was mixed well. This was then incubated at 37°C for one hour. Complete cell lysis was confirmed spectrophotometrically by measuring absorbance at 520 nm. It was then clarified by centrifugation at 8000 rpm for 10 minutes. The clarified lysate was used for the purification of enzyme.
Purification of Enzyme
The crude enzyme extract was subjected to 2.0% streptomycin sulfate to remove the nucleic acid. The resulting precipitates were centrifuged at 8,000 rpm for 15 minutes. The enzyme solution was saturated to 20% with ammonium sulfate and centrifuged at 10,000 rpm for 10 minutes. The supernatant was again saturated to 30% with ammonium sulfate. After centrifugation, the precipitates were collected and dissolved in 0.01 M phosphate buffer (pH 6.2). This enzyme solution was dialyzed for 24 hr at 4°C against 1.0 mM phosphate buffer (pH 6.2). The dialysis buffer was changed after 6 hr. The dialyzed solution was centrifuged at 10,000 rpm for 20 minutes to obtain the clear supernatant solution containing the desired enzyme.
Enzyme Assay
A reproducible colorimetric methods as described by Marrelli was used for estimation of 7-ACA [Citation[13]]. The enzymatic activity was expressed in terms of number of micro-moles of 7-ACA produced per mL of enzyme sample per minute as Units/mL.
Glucose Estimation
Glucose estimation was determined by DNS method for reducing sugar quantification [Citation[14]].
Biomass Quantification
Biomass was estimated as dry cell weight by the method proposed by Nigam et al. [Citation[6]].
Experimental Design and Optimization by RSM
Response surface methodology (RSM) is a collection of mathematical and statistical techniques widely used to determine effects of several variables and to optimize different biotechnological processes [Citation[15-18]]. Optimization of cephalosporin-C acylase was done by central composite experimental design (CCD), where a 23 factorial design was employed with 20 experiments. Three parameters like pH, temperature and agitation were considered as three independent variables for optimization.
The variable levels Xi were coded as xi according to the following equation such that X0 correspond to the central value:where xi is the dimensionless value of an independent variable, Xi the real value of an independent variable, X0 the real value of an independent variable at the center point, and ΔXi is the step change.
The experimental plan and levels of independent variables are shown in . X1 (pH) had a lower limit of 5.0 and a upper limit of 8.0, X2 (temperature) was varied between 21.0°C and 48.0°C. The lower and upper limits of X3 (agitation) were 60 and 110 rpm, respectively.
Table 1. CCD (central composite design) experimental plan for enzyme characterization
The response surface methodology was used to analyze the experimental design. The response variable was fitted by a second order model in order to correlate the response variable to the independent variables. The general form of the second degree polynomial equation is:where Yi is the predicted response; xixj are input variables that influence response variable Y; β0 is the offset term; βi is the ith linear coefficient; βii the ith quadratic coefficient and βij the ijth interaction coefficient.
The second order polynomial coefficients were calculated by MINITAB statistical software package. The statistical analysis of the model was preformed in the form of analysis of variance (ANOVA). This analysis included the Fisher's F test (overall model significance), its associated probability P (F), determination coefficient R2, which measures the goodness of fit of regression model. For each variable, the quadratic models were represented as contour plots. The optimal combination was determined from the contour plots.
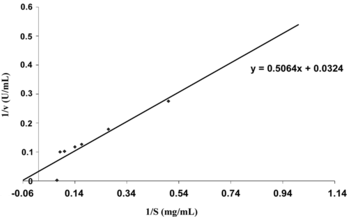
Determination of Km and Vmax
Km and Vmax values were determined by Lineweaver-Burk plot by measuring the initial rates of reaction of cephalosporin-C acylase with cephalosporin-C (2.0–14.0 mg/mL) in phosphate buffer (pH-6.2) at 32°C.
Synthesis of New Generation Cephalosporins (Cephalothin)
10 mg of cephalosporin-C was dissolved 5.0 mL of distilled water and 1.0 mL of enzyme solution was added. After 10 minutes of incubation, 0.01% (w/v) of Thiophene-2-acetic acid was added. Solution was kept for 20 minutes and reaction mixture was analyzed by HPLC method.
Analytical Methods
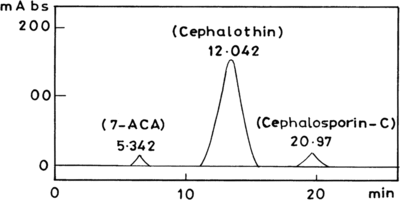
The concentrations of cephalosporin-C, 7-aminocephalosporanic acid (7-ACA) and cephalothin in the reaction mixture were determined by high performance liquid chromatography (HPLC). The column (C-18) size was 25 cm × 5 µm and packed with amino (μNH2). The mobile phase consisted of formic acid, methanol and water with a volume ratio of 0.5:0.5:99. The flow rate was set to 1.0 mL/min. The detection was carried out at a wavelength of 254 nm. The retention times for cephalosporin-C, 7-ACA and cephalothin were 20.97, 5.34 and 12.04 min., respectively.
RESULTS AND DISCUSSION
Growth Study of Microorganism
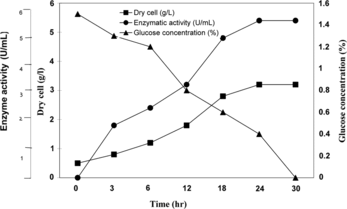
In order to achieve the maximum synthesis of CPC acylase enzyme, the growth study was carried out in production medium using Erlenmeyer flasks of various capacities (0.25–1.0 L) and in a 7.5 L environmentally controlled bioreactor (INFORS, A.G.). The pH of the production media was adjusted to 7.0. These were inoculated with suitable amount of respective seed media and incubated at 28°C. The samples were withdrawn aseptically at different time intervals and analyzed for dry cell mass, glucose concentration and enzyme activity. The growth profile is shown in , after six hours where significant increase in cell mass were observed. A rapid growth was noticed afterwards, where the cell mass increased exponentially with time. Due to exhaustion of limiting nutrients by microorganism, the exponential phase lead to the stationary phase in which cells can not multiply. At the stationary phase, the number of newly formed cells is equal to the number of dying cells. Maximum dry cell mass was obtained during the end of exponential phase, i.e., 3.2 g/L. The enzyme activity increases with time and after 24 hrs the activity become constant and it was observed as 5.4 U/mL. The glucose concentration decreases with time and there is rapid decrease after 6 hrs ().
Figure 1 Growth profile and enzyme activity.
Optimization of Physiochemical Parameters for the Production of 7-ACA
In order to search for the optimum condition of pH, temperature and agitation to enhance the 7-ACA productions were performed according to the CCD experimental plan (). The mathematical model relating the production of 7-ACA with independent process variables X1, X2 and X3 is given in second order polynomial equation:where Y is the response variable, acylase activity (U/mL) and X1, X2 and X3 the value of independent variables, pH, temperature (°C) and agitation (rpm), respectively. The results of predicted response are shown in . For testing the goodness of fit of the regression equation, the determination coefficient R2 was evaluated. The coefficient of determination (R2) was calculated to be 87.8% (). The R2 value provides the measure of how much variability is in the observed value.
Table 2. CCD plan and measured response
Table 3. Result of regression analysis of the 23 factorial design
The p-values are used as a tool to check the significance of each coefficient, which also indicates the interaction strength between each independent variable. The variable with lower probability levels contributes to the model, whereas the other can be neglected and eliminated from the model. The p-values for the linear, quadratic and interactive terms were as follows: 0.330, 0.944, 0.082, 0.00, 0.00, 0.104, 0.081, 0.857 and 0.857 for X1, X2 and X3, ,
,
, X1X2, X2X3 and X1X3, respectively. The p-value suggests that the coefficient for linear effect of agitation (X1) with a value of 0.082 is most significant.
The statistical significance of the ratio of mean square variation due to regression and mean square residual error was tested using analysis of variance (ANOVA). ANOVA is a statistical technique that subdivides the total variation in a set of data into component parts associated with specific sources of variation for the purpose of testing hypothesis on the parameters of the model. The corresponding analysis of variance is presented in . The F-value is a measure of variation of the data about the mean. Generally, the calculated F-value should be several times greater than tabulated value, if the model is a good prediction of the experimental results and the estimated factors are real. Here the computed F-value is greater than tabulated F-value (F9,10) at 5% level so that the null hypothesis (H0) is rejected. Having rejected the null hypothesis, it can be inferred that treatment differences are highly significant. Also, the high F-value and a very low probability indicates that the present model is a good prediction of the experimental result.
Table 4. Analysis of variance for characterization of cephalosporin-C acylase by Pseudomonas diminuta using central composite design criterion
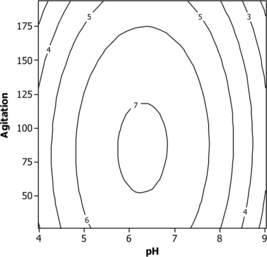
The contour plots to estimate activity surface over independent variables X1, X2 and X3 are shown in . The stationary point or centriod point is the point at which the space of response is zero, corresponding to all directions. The coordinates of this point are called coordinates of the stationary point. All of the contour plots are elliptical in nature and maximum optimum point is attained at center as moving along the major and minor axis of the ellipse. An elliptical nature of contour plots indicates that the interaction between the independent variable is significant. The optimum values of pH, temperature and agitation speed were 6.5, 32°C and 80, respectively.
Figure 2 Contour plot of enzyme activity vs temperature, pH.
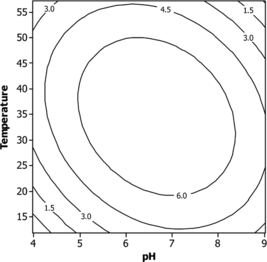
Figure 3 Contour plot of enzyme activity vs temperature, agitation.
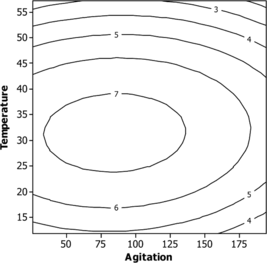
Figure 4 Contour plot of enzyme activity vs agitation, pH.
Determination of Kinetic Constant
shows the Lineweaver-Burk plot for the enzyme; the Km and Vmax for the enzyme is 15.62 mg/mL and 30.86 U/mL, respectively.
Figure 5 Lineweaver-Burk plot for determination of Km and Vmax for cephalosporin-c acylase enzyme.
Development of Semisynthetic Cephalosporins
The assessment of these enzymes has not been explored so far to convert or modify the cephalosporin-C into semisynthetic/new generation cephalosporins. Hence, efforts are being made to explore the possibility of identifying the appropriate enzymes for the conversion of semisynthetic cephalosporins. Experiments were performed with prior addition of structural analogue similar to the side-chain of semisynthetic cephalosporins, e.g., Thiophene-2-actetic. Results indicate (HPLC data analysis) the formation of cephalothin (). The concentration of semisynthetic cephalosporin was computed from the standard chromatogram of cephalothin in comparison with the experimental results of HPLC data of cephalothin antibiotic developed in the present studies. It indicated that the concentration of cephalothin was 1.6 mg/mL.
Figure 6 Chromatogram of semisynthetic cephalosporin (Cephalothin).
CONCLUSION
Production of 7-aminocephalosporanic acid (7-ACA) using cephalosporin-C acylase enzyme involved in single step conversion of cephalosporin-C (CPC) to 7-ACA from microorganisms (Pseudomonas diminuta) is a potentially important process. Many antibiotics, such as cephalosporins and penicillins, have been modified to produce semisynthetic cephalosporins and semisynthetic penicillins, respectively, with improved antibacterial activity, and are resistant to β-lactamases. 7-ACA is an important intermediate essential for the production of clinically used cephem antibiotics. Using the method of experimental factorial design and response surface analysis, it was possible to determine optimal condition to obtain high yield of 7-ACA. The validity of the model was proved by fitting the values of the variables in the model equation. These processing strategies could be useful for the development of new generation cephalosporins (cephalothin) by addition of structural analog compounds, which impart increased antibacterial activity and are resistant to β-lactamase.
Prof. Subir Kundu is grateful to University Grants Commission, India, for financial assistance received as a Research Grant. The authors wish to acknowledge the technical help/assistance provided by Dr. V.K. Nigam, BISR, Jaipur, India.
REFERENCES
- Zhang, Q.J., Xu, W.X. (1993). Morphological and enzymatic characteristic of cephalosporin acylase-producing Arthobacter strain 45-8A. Arch Microbiol. 159(4): 392–395.
- Fechting, B., Peter, H., Bickel, H., Vischer, E. (1968). Modification of antibiotics II. Preparation of 7-aminocephalosporanic acid. Helv. Chem. Acta. 51: 1100–l120.
- Morin, R.B., Jackson, B.G., Flynn, E.H., Roeske, R.W., Andrews, S.L. (1969). Chemistry of cephalosporin antibiotics.XV.transformation of penicillin sulfoxide. A synthesis of cephalosporins compounds. J. Am. Chem. Soc. 91: 1401–1407.
- Tisher, W., Wedekind, F. (1992). Biocatalytic 7-aminocephalosporanic acid production. Ann. N. Y. Acad. Sci. 672: 502–509.
- Kumar, K.K., Sudhakaran, V., Deshpande, B.S., Ambedkar, S.S., Shewale, J.G. (1993). Cephalosporin acylase: Enzyme production, structure and application in the production of 7-ACA. Hind. Antibiot. Bull. 35: 111–125.
- Nigam, V.K., Kundu, S., Ghosh, P. (2005). Single-step conversion of cephalosporin-C to 7-aminocephalosporanic acid by free and immobilized cells of Pseudomonas diminuta. Appl. Biochem. Biotechnol. 126(1): 13–21.
- Takahashi, T., Yamazaki, Y., Kato, K., and Isono, M. (1972). Enzymatic synthesis of cephalosporins. J. Am. Chem. Soc. 94: 4035–4037.
- Nigam, V.K., Kundu, S. (1997). Effect of organic compounds on the biosynthesis of cephalosporin-C. Ind. J. Microbiol. 37: 201–203.
- Nigam, V.K., Kundu, S. (1999). Batch production of 7-ACA by different microorganisms—a comprative study. Ind. Chemical Engg. 41(1): 5–9.
- Elibol, M. (2004). Optimization of medium composition for actinorphodin production by Streptomyces coelicolor A 3 (2) with response surface methodology. Process Biochem. 39: 1057–1062.
- Sen, R., Swaminathan, T.S. (1997). Application of response surface methodology to evaluate conditions for enhanced production of surfactin. Appl. Microbiol. Biotechnol. 47: 358–363.
- Shimizu, M., Masuike, T., Fujita, H., Kimura, K., Okachi, R., Nara, T. (1975). Search for microorganisms producing cephalosporin acylase and enzymatic synthesis of cephalosporins. Agric. Biol. Chem. 39: 1225–1232.
- Marrelli, L.P. (1968). Colorimetric method for determination of 7-aminocephalosporanic acid (7-ACA) and related compounds. J. Pharm. Sci. 12: 2172–2173.
- Miller, G.L. (1959). Use of dinitrosalicylic acid reagent for determination of reducing sugars. Anal. Chem. 31: 426–428.
- Rao, K.J., Kim, C.H., Rhee, S.K. (2000). Statistical optimization of medium for the production of recombinant hirudin from Saccharomyces cerevisiae using response surface methodology. Process Biochem. 35(7): 639–647.
- Dasu, W., Panda, T. (2000). Optimization of microbial parameters for enhanced griseofulvin production using response surface methodology. Bioprocess Engg. 22(1): 45–49.
- Souza, M.C.D., Roberto, I.C., Milagres, A.M.F. (1999). Solid state fermentation for xylanse production by Thermoascus aurantiacus using response surface methodology. Appl. Microbiol. Biotechnol. 52(6): 768–772.
- Hasmann, F.A., Pessoa, A., Jr., Roberto, I.C. (1999). Optimization of pH and temperature for betaxylosidase recovery by reverse micelles. Biotechnol. Tech. 13(4): 239–242.