Abstract
The present work aims at the development of a novel, diagnostic biosensor for monitoring asparagine levels in leukemia. Various immobilization strategies have been applied to improve the stability of the biocomponent (asparaginase). Response time studies have been carried out for different immobilization methods. Phenol Red indicator has been coimmobilized with asparaginase and color visualization approach has been optimized for various asparagine ranges. The detection limit of asparagine achieved with nitrocellulose membrane is 10−1 M, with silicon gel is 10−10–10−1 M, and with calcium alginate beads is 10−9–10−1 M. Furthermore, the calcium alginate bead system of immobilization has been applied for the asparagine range detection in normal and leukemia serum samples.
INTRODUCTION
L-asparaginase is an enzyme widely used on the clinical level as an antitumoral agent for the treatment of acute lymphoblastic leukemia and lymphosarcoma [Citation[1]]. Whereas the growth of normal cells is independent of its requirement, L-asparagine is an essential amino acid for the growth of tumor cells because these cells lack the enzyme asparagine synthetase that synthesizes L-asparagine [Citation[2]]. In the presence of L-asparaginase, the tumor cells get deprived of an important growth factor and cannot survive [Citation[3]].
The major proposed application of L-asparaginase as an injectable drug and elimination of L-asparagine in blood involves the monitoring of L-asparagine in blood of treated cancer patients (especially ALL patients) to avoid recurrence [Citation[4]]. Biosensors can be an alternative promising technology to detect L-asparagine in physiological fluids at levels as low as nanolevels. For the direct measurement of L-asparagine in human plasma samples through the use of E. coli L-asparaginase in the soluble form, an online gas dializer for automated enzymatic analysis with potentiometer ammonia detection having an ammonia electrode incorporated in conjunction with a predialysis unit has been used by Fraticelli and Meyerhoff [Citation[5]]. A three enzyme system consisting of urease, asparaginase and creatininase for determining urea, L-asparagine and creatinine respectively and a multi-analyte miniature conductance biosensor using enzymes such as urease and L-asparaginase has been described by Cullen, Sethi and Lowe [Citation[6]]. Based upon the deamination of L-asparagine by L-asparaginase from E. coli resulting in the formation of ammonia, an enzymatic method has been developed for the kinetic measurement of L-asparaginase activity and L-asparagine with an ammonia gas-sensing electrode by Tagami and Mastsuda [Citation[7]]. Kim-Sung-Jin et al. have reported the use of garlic tissue electrode for the determination of L-asparagine where garlic tissue cells were employed for conversion of L-asparagine into ammonia and ammonium gas electrode (ISE) was used as detector [Citation[8]]. A thermostable recombinant asparaginase from Archaeoglobus fulgidus was cloned and expressed in E.coli as a fusion protein. The enzyme was immobilized and used with an ammonium selective electrode (ISE) to develop a biosensor for L-asparaginase [Citation[9]]. The current study presents the development of a novel, diagnostic and cost-effective L-asparaginase based biosensor for leukemia blood samples. Color visualization approach has been optimized to monitor asparagine levels.
MATERIALS AND METHODS
The enzyme L-asparaginase produced from E. coli K-12 (MTCC-1302, Institute of Microbial Technology, Chandigarh, India) was coimmobilized with phenol red indicator (HiMedia Laboratories Pvt. Ltd., India) that changes color from red to violet when in contact with ions produced due to the deamination of asparagine into aspartic acid by L-asparaginase. Asparagine concentrations ranging from 10−9–10−1 M were studied and asparagine levels in blood serum samples of normal healthy patients and leukemia patients were monitored through change in color by visualization approach. L-asparaginase was coimmobilized with phenol red indicator on nitrocellulose membrane, silicon gel and in calcium alginate beads. Storage stability of the biocomponent was studied as well. Immobilization techniques include the following:
a) Nitrocellulose membrane: 20 µl of the enzyme (0.16 U) was coimmobilised with 10 µl of phenol red indicator on nitrocellulose membrane (Whatman membrane filters, Japan) covering a diameter of 13 mm and later 100 µl of varied concentrations of asparagine solution ranging from 10−9–10−1 M were put on it to see the change in color and the response time for color change was noted.
b) Silicon gel: Silicon gel was coated on glass slides. Then 20 µl of enzyme (0.16 U) was coated on it and kept for 10 minutes in freezer, then 10 µl of phenol red was put on the slide and later 100 µl of varied concentrations of asparagine solution ranging from 10−9–10−1 M were introduced on the slide to see change in color and the response time for change in color was noted [Citation[10]].
c) Calcium alginate beads: Sodium alginate (3%) was mixed with 20 µl of the enzyme (0.16 U) solution and 10 µl of phenol red indicator were added to this solution. This solution was then poured drop-wise through a glass syringe with needle into a beaker containing 0.075 M chilled CaCl2 with gentle stirring [Citation[11]]. Partly orange color beads (color of the beads was due to phenol red indicator) were made by 2.5 ml syringe (Dispovan, Canada). 5 beads were put into varying concentrations of 5 ml L-asparagine (10−9–10−1 M) solutions and the response time for change in color of beads from partly orange to bright purple was noted.
d) Monitoring of asparagine levels in normal and leukemia blood serum samples: 5 beads were put into normal and leukemia blood samples. Response time for color change of beads till purple color appears was noted. The asparagine levels in both the samples was judged by relating the response time for change in color of beads of both the samples with the response time for change in color of beads with concentration levels from 10−9–10−1 M of asparagine.
e) Storage stability: To know the storage stability of the biocomponent, calcium alginate beads were wrapped in a Whatman filter paper soaked in CaCl2 and kept in refrigerator at 4°C. Using these beads for further experiments, the activity of the biocomponent was checked.
RESULTS AND DISCUSSION
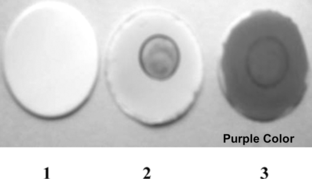
a) Nitrocellulose membranes: Asparagine level of 10−1 M was detected and for it the response was found to be 5–10 seconds. The results can be seen in and .
Figure 1 Covalent binding of enzyme on nitrocellulose membrane. (1) Nitrocellulose membrane. (2) Enzyme + Phenol red on nitrocellulose membrane. (3) Enzyme + Phenol red + Asparagine (10−1 M) → Purple Color.

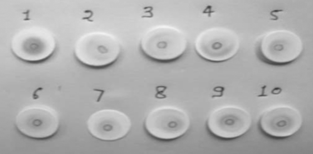
Figure 2 Detection of asparagine levels of 10−10–10−1 M (arranged in deceasing order of molar concentration in the figure) was not achieved on nitrocellulose membrane.

b) Silicon gel: The response time for change in color was found to be inversely proportional to the asparagine concentration levels. With decrease in concentration of asparagine, the response time for color change increases. Asparagine levels of 10−10–10−1 M concentration were detected. The results can be seen in and .
Table 1. The response time at various concentrations of asparagine solution on silicon gel plates
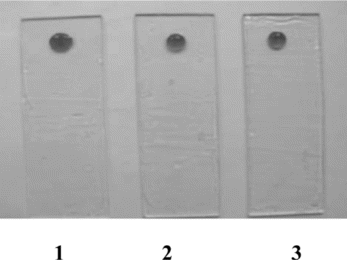
Figure 3 Immobilization of enzyme on silicon gel and reaction with varying concentration of asparagine (1) 10−1 M (2) 10−5 M (3) 10−10 M.

On comparing the time taken for the color change on nitrocellulose membrane and silicon gel, it has been observed that color on nitrocellulose membrane and silicon gel changes very fast for asparagine concentration of 10−1 M and detection is very fast with just 100 µl of the substrate.
c) Calcium alginate beads: A reverse trend of decrease in response time with decrease in asparagine concentration during detection by the calcium alginate bead system of immobilization has been observed. Due to a considerably large volume of substrate solution (5 ml L-asparagine) used in the calcium alginate bead system of immobilization in comparison to the other two immobilization strategies i.e., on nitrocellulose membrane and silicon gel (that use 100 µl of asparagine solution), a longer time is required for equilibrium to be attained between the calcium alginate beads and asparagine solution of varying concentrations, which is followed by the diffusion of ions. Thus, it takes time for steady state kinetics to be achieved. shows comparison of color of beads before and after the reaction. Response time for color change in different asparagine concentrations has been given in . For the study of detection of asparagine concentrations from 10−9–10−1 M, lesser difference has been obtained in the response time for change in color of beads for the concentrations ranging from 10−9–10−6 M. Thus, less accuracy has been achieved for the concentrations ranging from 10−9–10−6 M and detection of concentration range till 10−5M has been found to be more reliable.
Table 2. The response time for color change of beads
d) Testing asparagine levels in normal and leukemia blood serum samples: Response time for change in color of the beads was 2 min 35 seconds for the normal blood serum sample and the asparagine concentration level was in the range of 10−4 M. Response time for change in color of the beads was 3 min 10 seconds for the leukemia blood serum sample and the asparagine concentration level was 10−2 M. Thus, asparagine levels were found to be higher in leukemia blood than normal blood.
e) Storage stability of the biocomponent: The biocomponent was found to be active. Calcium alginate beads were found to be stable for 25–30 days.
CONCLUSION
The developed biosensor was able to monitor asparagine levels from 10−9–10−1 M and was also functional for the detection of asparagine levels in normal and leukemia blood serum (32–56 µM and 160–172 µM, respectively [Citation[12]]) samples. In comparison with the asparagine biosensors developed by Fraticelli and Meyerhoff (1983) and Wang et al. (2002), asparagine range of 10−9 M could be detected while the earlier efforts could detect levels up to only 10−5 M. Moreover, the amount of enzyme used for the detection of asparagine levels is about 20 µl. Thus, rapid detection of asparagine concentrations by minute quantities of enzyme is possible that makes the biosensor extremely cost-effective. The developed biosensor, apart from being novel and diagnostic, is also very rapid, easy to use, inexpensive, portable and capable of nanolevel asparagine range detection.
REFERENCES
- Schemer, G., Holcenberg, J.S. (1981). Enzyme as Drugs, J.S. Holcenberg, J. Roberts, Eds., New York: Wiley Inter Science, pp. 455–473.
- Asselin, B.L. (1999). The three asparaginases. Comparative pharmacology and optimal use in childhood leukemia. Adv. Exp. Med. Biol. 457: 621–629.
- Muller, H.J., Boos, J. (1998). Use of L-asparaginase in childhood ALL. Crit. Rev. Oncol./Hematol. 28: 97–113.
- Masao, N. (1986). Process for producing immobilized L-asparaginase from E.coli. Arch. Biochem. 105: 450–458.
- Fraticelli, Y.M., Meyerhoff, M.E. (1983). Online gas analyser for automated enzymatic analysis with potentiometric ammonia detection. Analytical Chemistry 55(2): 359–364.
- Cullen, D.C., Sethi, R.S., Lowe, C.R. (1990). Multi-analyte miniature conductance biosensor. Analytica Chimica Acta. 231(1): 33–40.
- Tagami, S., Mastsuda, K. (1990). An enzymatic method for the kinetic measurement of L-asparaginase activity and L-asparagine with an ammonia gas-sensing electrode. Chemical and Pharmaceutical Bulletin 38(1): 153–155.
- Kim, S.J., Kim, G.M., Bae, You Jin, Lee, Eun Yup, Hur, Moon Hye, Ahn, Moon Kyu. (1995). Determination of L-asparagine using a garlic tissue electrode. Yakhak Hoeji. 39(2): 113–117.
- Wang, J., Li, J., Bachas, L. G. (2002). Biosensor for asparagines using a thermostable recombinant asparaginase from Archaeoglobus fulgidus. Anal. Chem. 74(14): 3336–3341.
- Subramanium, A., Kennel, J., Oden, I., Jacobson, K., Woodward, J., Mitchel, J. (1999). Comparison of techniques for enzyme immobilization on silicon supports. Enzy. Microbiol. Tech. 24: 26–34.
- Palmieri, G., Giardina, P., Desidero, M.L., Giamberini, M., Sannia, G. (1994). New enzyme immobilization procedure using calcium alginate gel, application to a fungal phenol oxidase. Enzy. Technol. 16: 151–158.
- Miller, D., Laszlo, J., Lyon, G., Kelso, H., McCarty, S. (1972). Reduction of human blood asparagine by hemodialysis. Cancer 29: 1347–1351.
