Abstract
Introduction: In this report, we tested the ability of HEPES-buffered culture medium to reduce acidotic cell death in hypoxic monolayer cell cultures and in a diffusion-limited model of engineered heart tissue (EHT). Methods: Neonatal rat cardiomyocytes were either plated (monolayers) or suspended in a hydrogel disc containing HEPES. Results: Monolayers cultured in 0% oxygen exhibited a pH drop to 5.46 ± 0.27 after 4 days with no HEPES, or 7.11 ± 0.09 with 50 mM HEPES. The lowest observed pH in EHTs was estimated as 6.2 with no HEPES and 7.1 with 50 mM HEPES, which were endpoints of noticeably different pH gradients across the EHTs. Addition of HEPES to hypoxic monolayers corresponded with fewer propidium iodide-positive cells and TUNEL-positive cells; addition of HEPES to EHTs resulted in greater calcein staining and less LDH release. Conclusion: Effective pH buffering reduces cell death by attenuating the acidosis that accompanies anaerobic metabolism.
Keywords:
INTRODUCTION
The treatment of heart disease is frequently impeded by a limited availability of donated organs. Cardiac tissue engineering is a promising approach that aims to construct myocardial grafts for clinical use Citation[1], Citation[2], Citation[3], Citation[4], which may eventually offer new treatment options for many cardiac pathologies. In several experimental models of engineered heart tissue, investigators have reported trouble in producing cardiac tissue constructs with maximum-dimension length scales greater than approximately 1 mm, which seems to be highly dependent on the type of in vitro culture apparatus and cell scaffold used in the study Citation[5], Citation[6], Citation[7]. For the neonatal cardiomyocytes used in these models, oxygen is almost certainly the most important metabolic substrate for maintenance of normal function and viability Citation[8], so it is expected that this molecule plays a major role in the mass transport problem of cardiac tissue engineering.
In circumstances where adequate oxygen is not available, the less efficient anaerobic glycolytic pathway supersedes oxidative phosphorylation to become the dominant source of ATP synthesis. Although acidification of the extracellular environment has traditionally been attributed to an overproduction and subsequent dissociation of lactic acid Citation[9], a number of investigators have stressed the contribution of glycolysis and especially ATP hydrolysis as the primary sources of protons generated during anaerobic metabolism (see ref Citation[10] for review).
The ensuing acidosis is a potent signal for cell death, either alone or in conjunction with hypoxia. Data from more than one laboratory suggests that reduced oxygen by itself does not cause hypoxia-induced cell death, and that acidosis is required to initiate cell death signaling Citation[11], Citation[12], Citation[13]. Acidosis is known to occur because of oxygen limitations in engineered heart tissue as well, although the extent of its contribution to cell death is unknown. Carrier et al. observed a pH drop in cardiac tissue constructs based on poly(glycolic acid) (PGA) scaffolds, which effect could be reduced by bioreactor cultivation Citation[1], Citation[7]. Although various forms of convective culture were shown to improve cell distribution and viability in these studies, the role of specific metabolites (e.g. O2, glucose) or waste products (CO2, H+) is not known.
A clinically relevant cardiac tissue construct will require a significant enhancement of the current 1-mm length scale, which mandates an efficient mass transport system analogous in function, if not form, to the coronary vasculature. Designing an efficient mass transport for EHTs is a difficult challenge, given the microscopic scale and material in question. Viscoelastic hydrogels such as the collagen-Matrigel composite offer an attractive system for 3-D cell reconstitution in that they can suspend a large number of cells evenly and are quite permeable to solutes Citation[14], although they suffer in the capacity to engineer microscale features Citation[15]. While some investigators have made progress in this limitation by microfluidic molding of the gel Citation[16], Citation[17] or photopatterning Citation[18], solid materials may always hold an advantage in relative ease of complex structure fabrication. Chemical strategies to address the mass transport problem could include those that prevent or reduce cell death, facilitate metabolite diffusion, intervene metabolically, or remove damaging metabolic by-products.
Many tissue engineering and cell transplantation strategies rely upon the delivery of a hearty population of functional cells to the graft site. Efforts to compact a relatively large number of cells into a small volume are invariably challenged by transport limitations of critical nutrients to the inner cells. If hypoxia-induced acidosis is a contributor to cell death inside cardiac tissue constructs, it should be possible to reduce the harmful effects of transport limitations by providing a pH buffer to sequester excess protons generated by anaerobic metabolism. In this report, we tested the hypothesis that supplementation of culture medium with a common pH buffer (HEPES) reduces transport-limited cell death in a one-dimensional, diffusion-limited model of engineered heart tissue.
METHODS AND MATERIALS
Cell Culture
Neonatal rat ventricular myocytes (NRVM) were isolated as described elsewhere Citation[19]. Cells were plated in wells of tissue culture polystyrene 24-well plates (Fisher, PA) coated with 0.02% gelatin. Cells were plated at an initial density of 7 (high density), 5 (medium density), or 3 (low density) × 104 cells/cm2 in 350 μ L plating medium. The plating medium consisted of DMEM with 10% horse serum (Fisher, PA), 2% embryonic chick extract (USBiological, MA), and 1% penicillin-streptomycin. Cells were allowed to attach for 18 hrs in a standard tissue culture incubator (37°C, 5% CO2 in humidified air) after plating. At this point, which defined the zero time, media was replaced in all samples with the specified serum-free HEPES formulations (). Normoxic samples were replaced in the tissue culture incubator, while hypoxic samples were transferred to sealed modular chambers (Billups-Rothenberg, Del Mar, CA) placed in a similar incubator without CO2. The modular chambers, which contained a small dish of water for humidity, were purged for 5 min at 20 L/min with medical-grade gases comprised of 0% or 10% oxygen, 5% CO2, and balanced with nitrogen. At each time point, the modular chambers were opened briefly to remove well plates to be assayed and the chambers re-gassed. To prevent reperfusion injury to the hypoxic cells, media was not changed during the course of these experiments.
Engineered Heart Tissue Formulation
Formulation and culture of radial diffusion-limited engineered heart tissue (EHT) constructs followed the method of Eschenhagen et al. Citation[2], Citation[5], Citation[20], Citation[21], Citation[22] with some modifications, as described elsewhere Citation[23]. The freshly-formulated, liquid EHTs were transferred to a cell culture incubator immediately after casting for 30 min to gel, then placed in 24-well plates containing the specified media formulations (). All EHTs were cultured in a standard 5% CO2 incubator.
TABLE 1 Composition and properties of serum-free media formulations used in experiments. ITS: insulin-transferrin-selenium supplement. Medium pH and osmolarity are expressed as the average ± standard deviation of three samples equilibrated for several hours in a 37 °C incubator with 5% CO2
pH Measurements
The pH levels of culture medium in monolayer cell cultures were measured with an Orion pH electrode (Fisher, PA). The pH levels inside EHT constructs were estimated indirectly with phenol red coloration by the following method. Samples were removed from culture media, dabbed briefly to remove excess liquid, and placed on a white surface with a Canon PowerShot SD300 digital camera mounted 10 cm above. Four-megapixel images were captured of the entire sample under room lighting conditions. For calibration, cell-free EHTs were formulated and soaked in culture media that had been acidified to known pH values (by electrode measurement), and then photographed alongside cell-containing EHTs. Images were analyzed in BioQuant Nova (BioQuant, TN), in which spatial histograms of three color channels (red, green, and blue) were generated for each picture in arbitrary units. From pilot experiments, it was found that blue channel values followed the trend of red-to-yellow phenol red coloration, while the green channel values followed the inverse trend. The “red” channel values did not significantly change with phenol red coloration. Therefore, a “coloration index” of the blue channel value divided by the green channel value was calculated for each pixel, and calibrated to the pH values of the cell-free standards with the best-fit trendline. Two radius-wise histograms were generated of each image (vertical and horizontal), producing four pH gradient histograms toward the center of the sample. Histogram values at each point on the radius (6 μ m resolution) were averaged for each sample. Small variations persisted in the photo-to-photo brightness, which would introduce error into the measurements if uncorrected. Therefore, trends were normalized by assigning the highest value of the coloration index as pH 7.5, and all other values corrected equally. Three or four EHTs samples were photographed for each condition in the study.
Cell Viability Assays
Two stains were used to assess cell viability in monolayer cell cultures: calcein/propidium iodide (PI) staining and TUNEL. To assess membrane integrity, live cell cultures were double-stained with 2 μ M calcein-AM and 5 μ M PI (both dyes from Molecular Probes, OR) for 15 min in warm DMEM. The numbers of calcein-positive and PI-positive cells were counted in each of three 100× magnification images with BioQuant Nova image analysis software (BioQuant, TN) under fluorescent light, and the data expressed as number of PI-positive cells per total stained cells (n = 6 images). The total numbers of cells assessed in each sample group averaged 1,464.
To assess the degree of DNA fragmentation in monolayer cultures, paraformaldehyde-fixed cells were stained with the TUNEL assay for DNA strand breaks (ApopTag Fluorescein, Chemicon, CA). The TUNEL assay was then carried out according to the manufacturer's instructions, including ethanol/acetic acid postfixation, proteinase K digestion, and the use of nuclease-treated samples as a positive control. Cell cultures were coverslipped with VectaShield mounting medium containing the nuclear stain DAPI (Vector Labs, CA) and incubated in the dark for 30 min before analysis. The numbers of TUNEL-positive and DAPI-positive cells were counted in 3 images of 2 monolayer cultures (n = 6) with BioQuant Nova, and the data expressed as percent TUNEL-positive cells per total (DAPI-positive) cells.
Two methods were used to assess cell viability in EHTs: calcein staining and lactate dehydrogenase (LDH) release. For calcein staining in EHTs, the plastic discs lining the top and bottom surfaces of the gels were carefully removed with forceps to allow axial diffusion. Gels were dipped briefly in PBS, and then stained for 20 min in warm DMEM containing 2 μ M calcein. Low magnification (25× total) digital images were captured in the periphery region in the tissue constructs. Two images of 3 gels from each sample group were captured with green filters for equal exposure times. At low magnification, all cells inside the gel are visible in one focal plane, and only slight variations in emitted light intensity from stained cells are observed with focal adjustments. Note that calcein-positive cells were distinct and easily discernable, although pilot experiments with PI exhibited significant background staining in the gel, and thus PI was used not used as a cell viability assay in EHTs. For relative quantitation of images, histograms of the staining intensity of calcein were generated with BioQuant Nova. The data is expressed as the mean intensity values at each radius point in 6 histograms from 3 different gels.
LDH release into the culture medium indicates compromised membrane integrity of dead or dying cells Citation[24], Citation[25]. Aliquots of culture medium were removed from EHT cultures and assessed for LDH activity with a colorimetric assay (Sigma, MO). Due to the interference of phenol red (λmax≈ 550 nm) with the coloration of the LDH assay (λmax≈ 490 nm), phenol red-free DMEM was used in EHT cultures assayed for LDH release. LDH assay absorbance values of culture medium were normalized to the value of cell lysates containing an equal number of starting cells as were entrapped in the EHT gels (0.5 × 10⁶). Data are expressed as percent LDH released of all LDH in the cell population (n = 6).
Histological Sectioning & Staining
After 4 hrs, EHTs were removed from the incubator and processed for histology via OCT embedding and cryosectioning, as described previously Citation[23]. Slides were kept at −25°C during sectioning, followed by fixation in 70% ethanol at −20°C for 1 hr before staining.
Pimonidazole Staining
Cell cultures and regions of EHT sections below a specific cellular oxygen concentration were detected indirectly with a pimonidazole conjugation assay (Hypoxyprobe, Chemicon, CA) as described previously Citation[23]. Briefly, 2-nitroimidazole compounds such as pimonidazole have been shown to form adducts with thiol groups in proteins in the absence of oxygen (less than ≈ 14 μ M or 11 Torr in culture medium) Citation[26], which may be subsequently detected with antibodies raised against pimonidazole Citation[27]. The distance from the edge at which pimonidazole staining was first visible on the gel section was measured with BioQuant Nova image analysis software (BioQuant, TN) and recorded. Sections were coverslipped with VectaShield mounting medium containing the nuclear stain DAPI (Vector Labs, CA) and visualized under fluorescence microscopy. For presentation of representative images, images captured through filters specific for DAPI and pimonidazole stains were overlain with Adobe Photoshop 6.0.
RESULTS
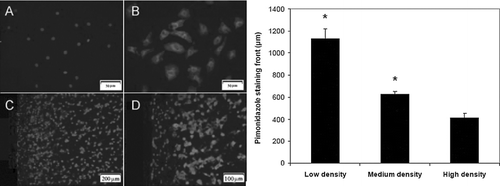
To test for the condition of hypoxia (< 14 μ M O2) in cellular monolayers and EHTs, staining for adducts of pimonidazole was performed. Immunostaining for pimonidazole was absent in NRVM monolayers cultured in standard incubator conditions (), though clearly visible in samples cultured in 0% oxygen gas (). Positive staining for pimonidazole occurred within a few hundred microns inside the periphery of EHT gels ( & ), which was dependent on the initial cell density. EHTs formulated with a lower density of cells (5× 10⁶ cells/mL) exhibited a staining front more depressed into the gel after 4 hrs (1,128 ± 92 μ m) than in medium cell density (630 ± 22 μ m) or higher cell density EHTs (412 ± 43 μ m). The maximum value of the pimonidazole staining front (630 ± 22 μ m) was measured at the earliest time point of 4 hrs in medium cell density EHTs, indicating less hypoxic tissue construct than at later time points, when this value dropped to 499 ± 39 μ m at 18 hrs and 472 ± 58 μm at 36 hrs.
Figure 1 Composite images of immunofluorescent staining for pimonidazole adducts, counterstained with DAPI. (A) NRVM monolayers cultured in a standard incubator, 400× mag; (B) NRVM monolayers cultured in 0% oxygen gas, 400× mag; periphery region of EHT gel shown at (C) 100× mag and (D) 200× mag. Bars represent pimonidazole staining front after 4 hrs, as measured from edge of section between EHTs formulated with 5 (low), 10 (medium), or 15× 106 cells/mL (high) initially (* p < 0.05 vs. other samples, n = 12).
In a reduced oxygen environment, the NRVM's culture media became acidic (), presumably as a result of anaerobic metabolism. NRVMs cultured in ambient air did not significantly acidify the culture medium, while the medium of cells cultured in 10% oxygen reached pH 7.26 ± 0.09 after 4 days, and that of 0% oxygen reached pH 5.71 ± 0.02. Cell density also had an effect on the acidification of the culture medium (). In relatively high-density NRVM cultures (7× 10⁴ cells/cm2) in 0% oxygen, medium pH dropped to 5.36 ± 0.16, while in low density cultures (3× 10⁴ cells/cm2), medium pH dropped less drastically to 6.49 ± 0.42. A slight pH drop was also noticed in high-density normoxic (20% oxygen) cultures, which attained a pH value of 7.53 ± 0.02 after 4 days.
Figure 2 Acidosis is a function of oxygen concentration in NRVM monolayer cultures. Culture media pH was measured over time in NRVMs (n = 3) plated at medium density (5× 10⁴ cells/cm2) in 0%, 10%, and ambient air (20%) dry gas O2 fractions. Error bars represent mean ± standard deviation of three cell cultures for each condition.
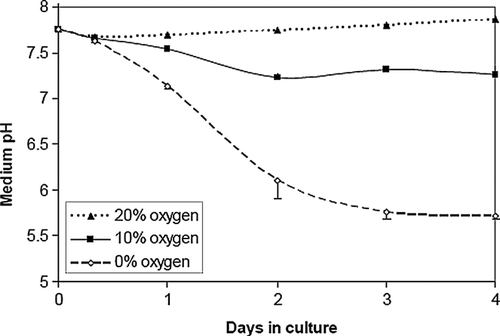
Figure 3 Acidosis is a function of cell density in NRVM monolayers. Culture media pH was measured over time in NRVMs plated at 3 initial densities (3, 5 or 7 × 10⁴ cells/cm2) in 0% and ambient air (20%) dry gas oxygen fractions. Error bars represent mean ± standard deviation of three cell cultures for each condition.

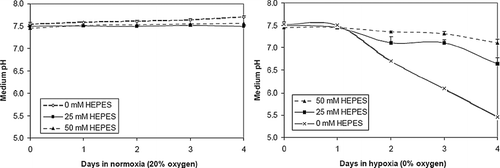
To reduce the degree of acidosis, we added HEPES buffer to the culture medium. Under ambient air conditions, the addition of HEPES did not significantly change the pH of the culture medium after 4 days (7.72 ± 0.02 for 0 mM HEPES versus 7.56 ± 0.05 for 50 mM HEPES). Under hypoxic conditions, the addition of increasing concentration of HEPES was associated with a decreasing degree of acidosis (). Monolayers cultured in 0% oxygen exhibited a pH drop to 5.46 ± 0.27 after 4 days with no HEPES, or 7.11 ± 0.09 with 50 mM HEPES.
Figure 4 HEPES buffering reduces acidosis in NRVM monolayers. Culture media pH was measured over time in NRVM monolayers plated at low density (3 × 10 4 cells/cm2) and cultured in three different HEPES concentrations (0, 25, 50 mM) in 0% and ambient air (20%) dry gas oxygen fractions. Error bars represent mean ± standard deviation of three cell cultures for each condition.
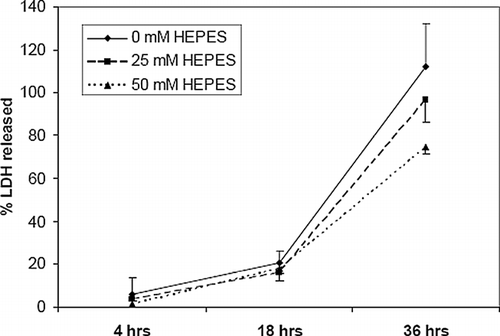
Acidosis is associated with a marked difference in cell viability, as demonstrated with the percentage of PI-positive and TUNEL-positive cells between cultures ( and ). Fewer numbers of dead cells were evident in both assays after 3 days with higher concentrations of HEPES buffer (25 and 50 mM). Significantly more cells were PI-positive in all hypoxic cultures than in normoxic cultures, although the differences in TUNEL staining between unbuffered normoxic and buffered hypoxic cultures were insignificant. Approximately 3.0 ± 1.1% and 13.9 ± 4.7% of cells in unbuffered normoxic cultures were PI- and TUNEL-positive, respectively, compared with 99.7 ± 0.6% and 47.6 ± 24.3% in unbuffered hypoxic cultures. No significant differences between viable cell numbers were evident after 1 culture day in either assay.pH gradients inside EHTs were estimated with phenol red absorbance, which was calibrated to cell-free standards with a best-fit trendline (). Addition of HEPES at 25 mM and 50 mM to serum-free culture media decreased the pH gradients (or increased the pH) inside corresponding EHTs (). The lowest pH measured in the 50 mM HEPES formulation was 7.1, while pH 6.8 was observed in the 25 mM formulation, and pH 6.2 in the 0 mM formulation. Greater pH buffering by the higher HEPES concentration translated to an improvement in cell viability inside the EHTs. More calcein-positive cells were visible in 50 mM and 25 mM formulations than in 0 mM, which seemed to affect the cell viability at both the periphery and the interior of the EHT (). A similar decrease in LDH release was also observed in buffered EHTs (). In the 0 mM formulation, approximately all of the LDH from the initial number of entrapped cells (112 ± 20%) was released into the culture medium after 36 hrs, while 97 ± 11% was released from EHTs in the 25 mM formulations, and 75 ± 3% for the 50 mM formulation. The greatest differences in LDH release between the groups were seen between 18 and 36 hrs.
Figure 5 HEPES reduces propidium-iodide (PI) staining in hypoxic (0% oxygen) monolayer cultures. Cells were stained with the viability marker calcein-AM and the membrane-permeant death marker PI. Data shown is percent PI-positive cells in NRVM monolayers plated at low density (3 × 10⁴ cells/cm2) in 0% oxygen at three different HEPES concentrations: 0 mM (A), 25 mM (B), and 50 mM (C). Normoxic (20% oxygen) cultures with 0 mM HEPES (D) were used as a control. Error bars represent mean ± standard deviation of 6 measurements from 2 cell cultures for each condition (* p < 0.05 vs all other samples, † p < 0.10 vs. each other).
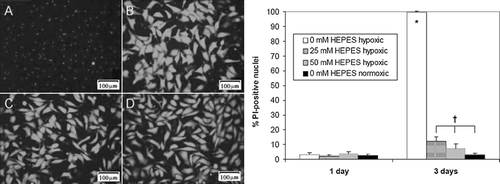
Figure 6 HEPES reduces TUNEL staining in hypoxic (0%) monolayer cultures. Data shown is percent TUNEL-positive cells in NRVM monolayers plated at low density (3 × 10⁴ cells/cm2) in 0% oxygen at three different HEPES concentrations: 0 mM (A), 25 mM (B), and 50 mM (C). Normoxic (20% oxygen) cultures with 0 mM HEPES (D) were used as a positive control. Error bars represent mean ± standard deviation of 6 measurements from 2 cell cultures for each condition (* p < 0.05 vs. all other samples).
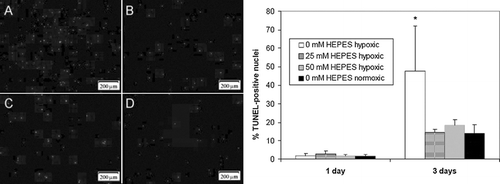
Figure 7 Radial pH gradients in EHTs cultured in media containing three different concentrations of HEPES after 4 hrs: 50 mM (A), 25 mM (B), and 0 mM (C). Images of EHTs were captured with a digital camera and analyzed with image analysis software to generate phenol red coloration gradients. Phenol red color was calibrated to known pH values with cell-free gels equilibrated in acidified media (see methods).
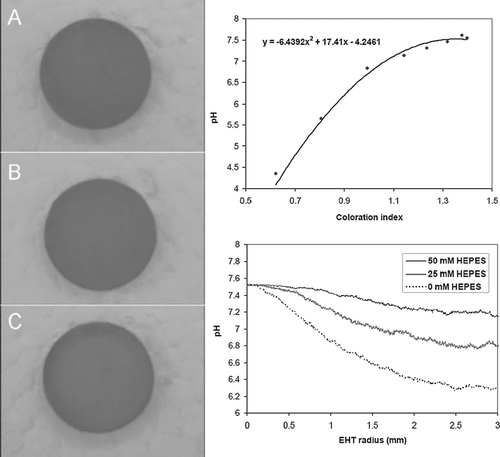
Figure 8 HEPES increases calcein staining in EHTs. Images shown are calcein-positive cells in the edge region of EHTs cultured in three different concentrations of HEPES: 0 mM after 4 hrs (A); 0 mM at 36 hrs (B), 25 mM at 36 hrs (C), and 50 mM at 36 hrs (D). Graph shows histogram of calcein-positive cell density in EHTs after 36 hrs.
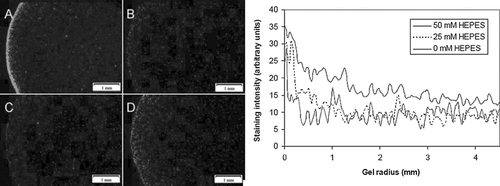
Figure 9 HEPES reduces lactate dehydrogenase (LDH) release from EHTs. EHTs were cultured in three different concentration of HEPES over 36 hrs and culture media assayed for LDH. Data is expressed as a fraction of LDH from a lysate of the original number of entrapped cells. Error bars represents mean ± standard deviation of 3 measurements for each time point.
DISCUSSION
Hypoxia was present in the gassed incubator chambers as well as inside EHTs, as demonstrated with the hypoxia-sensitive pimonidazole stain (). Furthermore, a significant pH drop occurs in cultures of neonatal cardiomyocytes subjected to hypoxia. The degree of acidosis appears to be in proportion to the degree of hypoxia, indicated by the lower pH attained in 0% oxygen cultures compared with 10% oxygen cultures (). A cell density effect is also noticed in hypoxic cultures (). Excess protons accumulate in higher density cultures because of two compounding effects. The first is that a greater number of hypoxic cells produce more protons, which in the same volume of culture medium will translate to a lower pH. However, cell density has a greater-than-linear effect on the number of protons. This is because higher density cultures experience lower oxygen concentrations at the culture surface, and thus will increase proton production in inverse proportion to oxygen tension. The mechanism is likely due to both proton export through the various transporters in living cells (lactate/H+ symporter Citation[28], Na+/H+ exchanger, Na+/HCO3− cotransporter, and the vacuolar proton ATPase Citation[13] as well as intracellular protons released from lysis Citation[29]. The cumulative effect is a pH approximating 6, which is consistent with previous studies with these cells in hypoxic environments Citation[13].
The ability of HEPES to attenuate the pH drop occurring in hypoxia was tested. NRVMs cultured at the same initial densities and within the same gas environment exhibited remarkably different levels of cell death depending on the concentration of HEPES in the culture medium ( and ). The degree of acidosis is quite severe in unbuffered cultures (< pH 6), and hence it is not surprising that virtually all cells stained positive with PI after 3 days. It should be noted that the lower density cultures chosen for this study showed a greater difference between HEPES concentrations than higher density cultures, in which the effects of HEPES were not as apparent (data not shown). This is attributed to the higher production of protons overwhelming the ability of HEPES to effectively buffer in the 0–50 mM range.
The ability of HEPES to reduce cell death in a model of engineered heart tissue was observed in this study. The cell-preserving effects of HEPES are credited to the attenuation in pH drop inside the gels, which was estimated by phenol red coloration. However, the effects of HEPES on cell viability were not as pronounced as in the 2-D system, which is attributed to the severity of the 3-D model employed for these experiments. Because of the high cell density coupled with the inability for convection to provide mass transport inside the hydrogel Citation[14], Citation[30], the EHT model in this study should be considered extremely caustic to the residing cardiomyocytes, regardless of the type of culture medium used. Extensive DNA laddering is evident in EHTs after one day (data not shown), as is LDH release and TUNEL staining, which is shown in the present study. Thus, the cell-preserving effects of HEPES were somewhat overshadowed by the toxicity of the EHT, which causes much more cell death through more severe transport limitations than is imparted by the 2-D experimental system.
The initial pH of standard cell culture medium in this study is fairly basic (7.72), owing to the use of serum-free DMEM in 5% CO2. Although the alkaline pH may not be optimal for culture of NRVMs, this medium formulation is used routinely among investigators studying these cells Citation[31], Citation[32], Citation[33]. The trends in pH are not expected to differ in NRVMs cultures beginning at physiological pH (7.40), which is supported by the same trends occurring in HEPES-containing culture media beginning at pH 7.46–7.53 (). Although efforts were made at formulating isotonic HEPES media, the high osmolarity of HEPES presented a challenge in balancing the media formulations with an ample amount of DMEM. The media formulations used in this study were measured at around 360 mOsm, or Ω = 1.32 in reference to Ca2 +-Tyrode solution (273 mOsm). A nominal degree of cell death occurs in normoxic cultures sustained for 4 days at this osmolarity ( and ), perhaps due to the hypertonic culture medium.
Zwitterion buffers such as HEPES, also known as 4-(2-hydroxyethyyl-1)-1-piperazineethanesulfonic acid, were originally developed to avoid the use of bicarbonate ion/carbon dioxide (HCO3−/CO2) for buffering cell culture media Citation[34]. Both buffers are commonly used in cell culture, and each has particular advantages. The bicarbonate system (pKa 6.1 at 37 °C) is an effective buffer under acidic conditions because it physically removes excess protons from media through the association of carbonic acid (H2CO3) and subsequent CO2 outgassing. A disadvantage of the CO2 system lies in the inherent fluctuations of dissolved CO2 during in vitro culture Citation[35], in addition to biological effects of the bicarbonate ions themselves Citation[36], Citation[37]. HEPES is advantageous in that it has a stronger buffering capacity at physiological pH (pKa 7.31 at 37°C), which is not subject to variation from dissolved gases. However, a number of studies have noted adverse effects on cultured cells Citation[38], Citation[39], Citation[40], Citation[41], Citation[42]. These findings have been attributed to free radical generation Citation[43], Citation[44], ion channel interference Citation[41], Citation[45], Citation[46], and phototoxicity Citation[47], Citation[48], Citation[49]. Despite these concerns, HEPES is widely used in a number of standard media formulations (MEM, RPMI-1640, and some formulations of DMEM). In situations where the greatest threat to cells is the acidic environment, such as in engineered tissues, buffers such as HEPES could be justifiably used.
While a number of adaptive mechanisms are in place within the cardiomyocyte to cope with a lack of oxygen, an overly acidic extracellular milieu will be a direct stimulus for cell death Citation[11], Citation[12], Citation[13]. Thus, for applications in tissue engineering where it is critical to preserve inner cell viability, it is imperative that the pH within the tissue construct is carefully regulated within tolerable limits. This may be achieved by four conceivable strategies: (1) improving mass transport (both oxygen influx and proton efflux); (2) inhibiting metabolic processes that generate free protons; (3) buffering excess protons in the culture medium; or (4) improving the resilience of cells to acidosis. In the context of acidosis, improved mass transport can have at least three beneficial effects on the cell: (1) a greater availability of oxygen to prevent a glycolytic switch in metabolism; (2) removal of waste gases that share the total gas pressure with oxygen; and (3) removal or chemical confiscation of free protons. A substantial fraction of cell death inside engineered tissues is probably due to the unavailability of critical substrates such as oxygen, so a direct improvement in mass transport should translate to higher cell viability. This has been demonstrated in engineered heart tissue with perfused flow bioreactor cultivation Citation[6], Citation[7], in which greater proportions of viable cells were observed in perfused tissue constructs with higher concentrations of oxygen. Delivering oxygen can also be chemically enhanced with molecules that facilitate the diffusion of oxygen, such as heme-containing proteins or fluorocarbon-based synthetic compounds. This strategy has been recently implemented in a model of perfluorocarbon-supplemented culture medium for engineered heart tissue Citation[50], Citation[51], which resulted in improved viability of the residing cells.
The concept of reducing hypoxic cell death through buffered media is not new. Two notable studies with neonatal cardiomyocytes Citation[11] and embryonic rat fibroblasts Citation[52] have shown the same effect. Although the present study is the first to demonstrate that this effect is present in both gas-imposed hypoxia and diffusion-imposed hypoxia, the principle remains the same: by attenuating the acidotic component of in vitro ischemia, it is possible to reduce the overall cell death associated with hypoxia. It is entirely plausible that the results of these studies could be reproduced with other common pH buffers such as Tris, MOPS, MES, Bicine, PIPES, or imidazole.
CONCLUSIONS
In this report, we have demonstrated that supplementation of culture medium with a common pH buffer (HEPES) improves cell viability in hypoxic cell cultures and in a diffusion-limited model of engineered heart tissue. This effect is attributed to the reduction of extracellular acidosis secondary to proton production by anaerobic cells. A number of phenomena contribute to the mass transport problem in tissue engineering, including critical nutrient transport, waste product transport, and acidosis. By controlling acidosis, cell death in hypoxic tissue constructs can be reduced to some extent. The results of this study suggest that investigators seeking to improve cell viability within potentially hypoxic tissue constructs should consider the use of stronger buffers in culture media.
Supplemental methods
Note: Full descriptions are in another manuscript in press, as cited in main text.
Engineered heart tissue formulation
Formulation and culture of engineered heart tissue (EHT) constructs followed the method of the Eschenhagen2with some modifications. An acidic solution of rat tail collagen (3.2 mg/mL, BD Biosciences, CA) was neutralized with 1N NaOH and 4× plating medium (described above). Matrigel soluble basement membrane extract (BD Biosciences, CA) was added to the cold, neutralized collagen at 10% (V/V). Neonatal cardiomyocytes were pelleted in a centrifuge tube and resuspended in the collagen-Matrigel mixture. All formulation steps were carried out in a cold room (4°C). A one-dimensional radial-diffusion EHT model was used for quantitative studies of mass transport. Circular plastic discs (diameter 7.2 mm) were made from overhead transparencies with a standard office hole-puncher and chilled in the cold room. 50 μ L of the liquid collagen-Matrigel mixture containing cells were pipetted atop each disc in the cold room, which formed a semispherical droplet due to the surface tension of the liquid. A second disc was placed on the droplet, which was then guided by surface tension into a position parallel to the bottom disc, which occurred reliably without external influence. The height of the resulting cylindrical gels was measured by digital micro-calipers as 1.22 ± 0.15 mm (n = 12). This configuration allows mass exchange with the culture medium to occur only radially, since the plastic discs lining the top and bottom of the gel are impermeable to solutes. The freshly-formulated, liquid EHTs were transferred to a cell culture incubator immediately after casting for 30 min to gel, then placed in 24-well plates containing the specified media formulations (). Because the plastics discs were of a lower density than the culture medium, the EHTs naturally submerged up to the top disc, where they floated for the duration of the experiment. All EHTs were cultured in a standard 5% CO2 incubator.
Histological sectioning
After 4 hrs, EHTs were removed from the incubator and placed in disposable plastic embedding molds (Fisher, PA) on ice. Gels were covered with ample OCT embedding medium (Fisher, PA) and immediately snap-frozen in a bath of dry ice and acetone, then stored at −80°C. The freezing procedure was performed less than 2 min after removing samples from the incubator to prevent changes in pimonidazole conjugation (described below). Frozen blocks were cryosectioned at 5 μ m thickness on a Reichert-Jung Frigocut 2800 cryostat (Pacific Southwest Lab Equipment, CA) at −14°C and mounted on acid-treated Superfrost Plus glass slides (Fisher, PA). Slides were kept at −25°C during sectioning, followed by fixation in 70% ethanol at −20°C for 1 hr before staining.
Pimonidazole staining
Cell cultures and regions of EHT sections below a specific cellular oxygen concentration were detected indirectly with a pimonidazole conjugation assay (Hypoxyprobe, Chemicon, CA). 2-nitroimidazole compounds such as pimonidazole have been shown to form adducts with thiol groups in proteins in the absence of oxygen (less than ≈ 14 μ M or 11 Torr in culture medium)25, which may be subsequently detected with antibodies raised against pimonidazole 26. In these experiments, 0.2 μ M pimonidazole hydrochloride (1:10,000 dilution) was added to the cell culture media at the start of experiments with the radial-diffusion model, and 4 hrs before freezing in the ring-shaped EHTs. Primary detection was done with a 1:50 dilution of the mouse monoclonal anti-pimonidazole IgG included in the Hypoxyprobe kit; and secondary detection with a 1:200 dilution of goat anti-mouse F(ab')2 Alexa Fluor 594 antibody (Molecular Probes, OR). The blocking solution and antibody diluent consisted of PBS containing 5% goat serum, 1% bovine serum albumin (Calbiochem, CA), and 0.1% Triton X-100. Blocking and antibody incubations were carried out for 1 hr each at room temperature. Sections were coverslipped with VectaShield mounting medium containing the nuclear stain DAPI (Vector Labs, CA) and visualized under fluorescence microscopy. The distance from the edge at which pimonidazole staining was first visible on the gel section was measured with BioQuant Nova image analysis software (BioQuant, TN) and recorded. For presentation of representative images, DAPI and pimonidazole images were overlain with Adobe Photoshop 6.0.
The authors wish to thank Mrs. Jane Chen of the Department of Medicine for harvesting the neonatal cardiomyocytes. This work was supported by the Fubon Foundation.
REFERENCES
- Carrier R. L., Papadaki M., Rupnick M., Schoen F. J., Bursac N., Langer R., Freed L. E., Vunjak-Novakovic G. Cardiac tissue engineering:cell seeding, cultivation parameters, and tissue construct characterization. Biotechnol Bioeng 1999; 64: 580–589
- Zimmermann W. H., Schneiderbanger K., Schubert P., Didie M., Munzel F., Heubach J. F., Kostin S., Neuhuber W. L., Eschenhagen T. Tissue engineering of a differentiated cardiac muscle construct. Circ Res 2002; 90: 223–230
- Leor J., Aboulafia-Etzion S., Dar A., Shapiro L., Barbash I. M., Battler A., Granot Y., Cohen S. Bioengineered cardiac grafts: A new approach to repair the infarcted myocardium?. Circulation 2000; 102: III56–61
- Shimizu T., Yamato M., Isoi Y., Akutsu T., Setomaru T., Abe K., Kikuchi A., Umezu M., Okano T. Fabrication of pulsatile cardiac tissue grafts using a novel 3-dimensional cell sheet manipulation technique and temperature-responsive cell culture surfaces. Circ Res 2002; 90: e40
- Zimmermann W. H., Fink C., Kralisch D., Remmers U., Weil J., Eschenhagen T. Three-dimensional engineered heart tissue from neonatal rat cardiac myocytes. Biotechnol Bioeng 2000; 68: 106–114
- Carrier R. L., Rupnick M., Langer R., Schoen F. J., Freed L. E., Vunjak-Novakovic G. Effects of oxygen on engineered cardiac muscle. Biotechnol Bioeng 2002; 78: 617–625
- Carrier R. L., Rupnick M., Langer R., Schoen F. J., Freed L. E., Vunjak-Novakovic G. Perfusion improves tissue architecture of engineered cardiac muscle. Tissue Eng 2002; 8: 175–188
- Malhotra R., Brosius F. C., 3rd. Glucose uptake and glycolysis reduce hypoxia-induced apoptosis in cultured neonatal rat cardiac myocytes. J Biol Chem 1999; 274: 12567–12575
- Nelson D. L., Cox M. M. Lehninger Principles of Biochemistry. Worth Publishers, New York 2000
- Robergs R. A., Ghiasvand F., Parker D. Biochemistry of exercise-induced metabolic acidosis. Am J Physiol Regul Integr Comp Physiol 2004; 287: R502–516
- Aki T., Mizukami Y., Oka Y., Yamaguchi K., Uemura K., Fujimiya T., Yoshida K. Phosphoinositide 3-kinase accelerates necrotic cell death during hypoxia. Biochem J 2001; 358: 481–487
- Webster K. A., Bishopric N. Molecular regulation of cardiac myocyte adaptation to chronic hypoxia. J Mol Cell Cardiol 1992; 24: 741–751
- Webster K. A., Discher D. J., Kaiser S., Hernandez O., Sato B., Bishopric N. H. Hypoxia-activated apoptosis of cardiac myocytes requires reoxygenation or a pH shift and is independent of p53. J Clin Invest 1999; 104: 239–252
- Ramanujan S., Pluen A., McKee T. D., Brown E. B., Boucher Y., Jain R. K. Diffusion and convection in collagen gels: implications for transport in the tumor interstitium. Biophys J 2002; 83: 1650–1660
- Tsang V. L., Bhatia S. N. Three-dimensional tissue fabrication. Adv Drug Deliv Rev 2004; 56: 1635–1647
- Tan W., Desai T. A. Layer-by-layer microfluidics for biomimetic three-dimensional structures. Biomaterials 2004; 25: 1355–1364
- Tan W., Desai T. A. Microfluidic patterning of cells in extracellular matrix biopolymers: effects of channel size, cell type, and matrix composition on pattern integrity. Tissue Eng 2003; 9: 255–267
- Albrecht D. R., Tsang V. L., Sah R. L., Bhatia S. N. Photo- and electropatterning of hydrogel-encapsulated living cell arrays. Lab Chip 2005; 5: 111–118
- Ross R. S., Pham C., Shai S. Y., Goldhaber J. I., Fenczik C., Glembotski C. C., Ginsberg M. H., Loftus J. C. Beta1 integrins participate in the hypertrophic response of rat ventricular myocytes. Circ Res 1998; 82: 1160–1172
- Eschenhagen T., Didie M., Heubach J., Ravens U., Zimmermann W. H. Cardiac tissue engineering. Transpl Immunol 2002; 9: 315–321
- Eschenhagen T., Fink C., Remmers U., Scholz H., Wattchow J., Weil J., Zimmermann W., Dohmen H. H., Schafer H., Bishopric N., Wakatsuki T., Elson E. L. Three-dimensional reconstitution of embryonic cardiomyocytes in a collagen matrix: a new heart muscle model system. Faseb J 1997; 11: 683–694
- Zimmermann W. H., Didie M., Wasmeier G. H., Nixdorff U., Hess A., Melnychenko I., Boy O., Neuhuber W. L., Weyand M., Eschenhagen T. Cardiac grafting of engineered heart tissue in syngenic rats. Circulation 2002; 106: I151–157
- Brown D. A., MacLellan W. R., Dunn J. C. Y., Wu B. M., Beygui R. E. Analysis of oxygen transport in a diffusion-limited model of engineered heart tissue. Biotech Bioeng 2007; 97: 962–975
- Decker T., Lohmann-Matthes M. L. A quick and simple method for the quantitation of lactate dehydrogenase release in measurements of cellular cytotoxicity and tumor necrosis factor (TNF) activity. J Immunol Methods 1988; 115: 61–69
- Legrand C., Bour J. M., Jacob C., Capiaumont J., Martial A., Marc A., Wudtke M., Kretzmer G., Demangel C., Duval D., et al. Lactate dehydrogenase (LDH) activity of the cultured eukaryotic cells as marker of the number of dead cells in the medium [corrected]. J Biotechnol 1992; 25: 231–243
- Arteel G. E., Thurman R. G., Raleigh J. A. Reductive metabolism of the hypoxia marker pimonidazole is regulated by oxygen tension independent of the pyridine nucleotide redox state. Eur J Biochem 1998; 253: 743–750
- Raleigh J. A., Miller G. G., Franko A. J., Koch C. J., Fuciarelli A. F., Kelly D. A. Fluorescence immunohistochemical detection of hypoxic cells in spheroids and tumours. Br J Cancer 1987; 56: 395–400
- Dennis S. C., Gevers W., Opie L. H. Protons in ischemia: where do they come from, where do they go?. J Mol Cell Cardiol 1991; 23: 1077–1086
- Lazdunski M., Frelin C., Vigne P. The sodium/hydrogen exchange system in cardiac cells: its biochemical and pharmacological properties and its role in regulating internal concentrations of sodium and internal pH. J Mol Cell Cardiol 1985; 17: 1029–1042
- Netti P. A., Berk D. A., Swartz A., Grodzinsky A. J., Jain R. K. Role of extracellular matrix assembly in interstitial transport in solid tumors. Cancer Res 2000; 60: 2497–2503
- Ding B., Abe J., Wei H., Xu H., Che W., Aizawa T., Liu W., Molina C. A., Sadoshima J., Blaxall B. C., Berk B. C., Yan C. A positive feedback loop of phosphodiesterase 3 (PDE3) and inducible cAMP early repressor (ICER) leads to cardiomyocyte apoptosis. Proc Natl Acad Sci USA 2005; 102: 14771–14776
- Slodzinski M. K., Blaustein M. P. Na+/Ca2+ exchange in neonatal rat heart cells:antisense inhibition and protein half-life. Am J Physiol 1998; 275: C459–467
- Nakamura T., Mizuno S., Matsumoto K., Sawa Y., Matsuda H. Myocardial protection from ischemia/reperfusion injury by endogenous and exogenous HGF. J Clin Invest 2000; 106: 1511–1519
- Good N. E., Winget G. D., Winter W., Connolly T. N., Izawa S., Singh R. M. Hydrogen ion buffers for biological research. Biochemistry 1966; 5: 467–477
- Lelong I. H., Rebel G. pH drift of “physiological buffers” and culture media used for cell incubation during in vitro studies. J Pharmacol Toxicol Methods 1998; 39: 203–210
- Ferguson W. J., Braunschweiger K. I., Braunschweiger W. R., Smith J. R., McCormick J. J., Wasmann C. C., Jarvis N. P., Bell D. H., Good N. E. Hydrogen ion buffers for biological research. Anal Biochem 1980; 104: 300–310
- Good N. E., Izawa S. Hydrogen ion buffers. Methods Enzymol 1972; 24: 53–68
- Poole C. A., Reilly H. C., Flint M. H. The adverse effects of HEPES, TES, and BES zwitterion buffers on the ultrastructure of cultured chick embryo epiphyseal chondrocytes. In Vitro 1982; 18: 755–765
- Daniel P. F., Wolf G. Incorporation of labeled glucosamines into glycoproteins by organ cultures of hamster trachea: adverse effects of HEPES buffer. In Vitro 1975; 11: 347–353
- Altura B. M., Altura B. T., Carella A., Turlapaty P. D. Adverse effects of artificial buffers on contractile responses of arterial and venous smooth muscle. Br J Pharmacol 1980; 69: 207–214
- Altura B. M., Altura B. T., Carella A., Turlapaty P. D. Ca2+ coupling in vascular smooth muscle: Mg2+ and buffer effects on contractility and membrane Ca2+ movements. Can J Physiol Pharmacol 1982; 60: 459–482
- Altura B. M., Carella A., Altura B. T. Adverse effects of Tris. HEPES and MOPS buffers on contractile responses of arterial and venous smooth muscle induced by prostaglandins. Prostaglandins Med 1980; 5: 123–130
- Grady J. K., Chasteen N. D., Harris D. C. Radicals from “Good's” buffers. Anal Biochem 1988; 173: 111–115
- Simpson J. A., Cheeseman K. H., Smith S. E., Dean R. T. Free-radical generation by copper ions and hydrogen peroxide. Stimulation by Hepes buffer. Biochem J 1988; 254: 519–523
- Yamamoto D., Suzuki N. Blockage of chloride channels by HEPES buffer. Proc R Soc Lond B Biol Sci 1987; 230: 93–100
- Kane J., Macdonald R. L., Zhang J., Sima B. HEPES inhibits contractile responses of canine basilar artery. Neurol Res 1997; 19: 527–533
- Lepe-Zuniga J. L., Zigler J. S., Jr., Gery I. Toxicity of light-exposed Hepes media. J Immunol Methods 1987; 103: 145
- Zigler J. S., Jr., Lepe-Zuniga J. L., Vistica B., Gery I. Analysis of the cytotoxic effects of light-exposed HEPES-containing culture medium. In Vitro Cell Dev Biol 1985; 21: 282–287
- Spierenburg G. T., Oerlemans F. T., van Laarhoven J. P., de Bruyn C. H. Phototoxicity of N-2-hydroxyethylpiperazine-N'-2-ethanesulfonic acid-buffered culture media for human leukemic cell lines. Cancer Res 1984; 44: 2253–2254
- Radisic M., Deen W., Langer R., Vunjak-Novakovic G. Mathematical model of oxygen distribution in engineered cardiac tissue with parallel channel array perfused with culture medium containing oxygen carriers. Am J Physiol Heart Circ Physiol 2005; 288: H1278–H1289
- Radisic M., Park H., Chen F., Salazar-Lazzaro J. E., Wang Y., Dennis R., Langer R., Freed L. E., Vunjak-Novakovic G. Biomimetic approach to cardiac tissue engineering: oxygen carriers and channeled scaffolds. Tissue Eng 2006; 12: 2077–2091
- Schmaltz C., Hardenbergh P. H., Wells A., Fisher D. E. Regulation of proliferation-survival decisions during tumor cell hypoxia. Mol Cell Biol 1998; 18: 2845–2854