Abstract
During extracorporeal procedures like hemodialysis, heparin is administered to patients to prevent clotting. Unfractionated heparin has side effects such as excessive bleeding. It would be advantageous if the blood could be deheparinased before it returns to the patient. Previous work has indicated that poly-L-lysine/alginate beads can efficiently remove heparin from saline solutions Citation. Heparin is irreversibly absorbed onto the beads. This article explores ways of optimizing the absorption process by performing in vitro rate experiments with varying physical parameters of the beads. Fetal calf serum and blood are also used in experiments to investigate the possibility of designing a safe and efficient reactor to absorb heparin. All the experiments were performed to obtain the required parameters for optimal reactor design. The results indicate that the absorption could be optimized by controlling the membrane thickness of the beads. The beads also showed efficient removal of heparin from whole blood.
INTRODUCTION
Heparin has been used for anticoagulation procedures for more than 80 years Citation[2]. It reduces clotting during extracorporeal procedures such as hemodialysis and blocks the cascade of proteins that work with the platelets to form a clot. It enhances the activity of antithrombin III, thus limiting clotting Citation[3]. The complex formed with antithrombin III inhibits several activated blood coagulation factors: XIIa, XIa, IXa, Xa and thrombin Citation[4].
In routine hemodialysis, a standard bolus dose of heparin is given initially. This is followed by an additional dose of heparin halfway through the dialysis procedure. Alternatively, an initial bolus can be given with a constant infusion of heparin, which maintains an activated clotting time (a measure of the anticoagulation effects of heparin) of 200 to 250 seconds, where the normal time is 90 to 140 seconds Citation[5].
However, the side effects of heparin include excessive bleeding or bruising, blood loss in the urine or stools, abdominal or back pain, heavy menses and skin irritation Citation[3]. Heparin is not prescribed to patients with low platelet counts or with bleeding disorders. Patients who have undergone recent surgery, suffered some form of mechanical injury, or have ulcers are also in danger of excess bleeding when heparin is administered. Osteoporosis is another serious but uncommon side effect associated with high dose heparin administration over a prolonged period Citation[4]. Alternatives to anticoagulation include extreme hemodilution, low molecular weight heparins, danaparoid, ancrod, r-hirudin, abciximab, tirofiban, argatoban and others. In the presence of heparin-induced thrombocytopenia (HIT) and thrombosis, the use of r-hirudin seems to be an acceptable solution; however, difficulty in monitoring r-hirudin's activity have been experienced Citation[6]. A number of alternatives for patients with a high risk of bleeding have been described; however, these options also have potential risks and disadvantages Citation[5]. It would therefore be useful to have a system that would eliminate unfractionated heparin after the standard anticoagulation procedure is administered.
It has been demonstrated that poly-L-lysine/alginate beads can efficiently remove heparin from saline solutions Citation[1]. The absorption process was a first order process and the Freundlich isotherm best fitted the experimental data. This article explores methods of optimizing the conditions to design an efficient reactor.
APPARATUS AND METHODS
Calibration
The concentration of unfractionated heparin was determined using an Azure II dye assay as described by Ameer et al. Citation[7]. A Cintra 5 UV-VIS double beam spectrometer was used to measure the absorbency of heparin. A standard linear curve for this assay was prepared by using solutions of known heparin concentrations ranging from 0 to 3U/mL.
Formation of Poly-L-lysine/alginate Beads
The standard encapsulation procedure patented by Chang Citation[8] in 1992 was used to produce poly-L-lysine/alginate beads Citation[1].
Standard poly-L-lysine/alginate beads were formed using a 26-gauge needle attached to a droplet generator. The beads were then stored in saline solution for two hours at room temperature until they were used in experiments.
Batch Rate Experiments
Previous work Citation[1] has indicated that the extraction of heparin from the saline solution by the poly-L-lysine/alginate beads is an irreversible first order absorption process, and the equilibrium data can be modeled by using a Freundlich isotherm. For the reactor design, it is essential to determine the absorption capacity of the beads and whether the data obtained using heparin in saline is representative of heparin absorption from blood. The aim of this study is to determine whether the absorption process is rate controlling, to determine the rate controlling step, the absorption capacity of the beads, and to analyse the absorption process in fetal calf serum and human blood.
The batch rate experiments were performed using a saline solution containing a known concentration of heparin and a known volume of uniformly sized beads. This mixture was stirred to ensure that the beads were in suspension and to maintain uniform exposure of heparin to the beads. Samples of 300 µL of the supernatant solution were taken out at time intervals from 0 seconds to 1.5 hours. The samples were centrifuged to separate the fragments of beads from the supernatant solution. The heparin content of the supernatant samples was then measured.
RESULTS
The first step in determining the absorption capacity of the beads is to determine the bead characteristics that modulate the absorption process. Experiments were planned to identify whether the absorption process was influenced by the ratio of the volume of the beads to the solution, the surface area of the beads or the bead membrane volume.
Absorption Dependence on the Ratio of Bead to Solution Volume
This experiment was performed to check whether the ratio of bead to solution volume had an effect on the absorption process. Two batch rate experiments were performed in which the ratio of the total bead volume to the solution volume was kept constant. If the absorption process is affected by this ratio then the results of both the experiments would be similar to each other.
Poly-L-lysine/alginate beads were placed in a fixed volume of saline solution with a heparin concentration of 3 U/mL, which was stirred continuously at room temperature. The beads of approximate diameters 900 µm±100 µm and 2 mm±100 µm were used. The number of beads and the volume of the solution used were adjusted such that the ratio of the total volume of the beads to the volume of solution was kept constant. Aliquots of 300 µL of the heparin solution were pipetted out at different time intervals from zero seconds to one and half-hours. The heparin content of the samples was determined by measuring the absorbance of the aliquots at a wavelength of 520 nm using the UV-VIS spectrometer.
The relative membrane thickness was measured using the programme Scion Image and was determined to be 0.3% of the bead diameter (2mm) and 1.56% of the bead diameter (900 µm). Since the bead membrane thickness was so small when compared to the diameter of the bead, it was neglected:1
2 where:
N is the total number of beads used for the experiment;
r is the radius of the beads;
N1 is the number of beads used in the 900 µm beads experiment = 8000;
r1 is the radius of beads in the 900 µm beads experiment = 450 µm;
V1 is the total volume of 3 U/mL heparin solution in mL used for the 900 µm beads experiment;
N2 is the number of beads used in the 2 mm beads experiment = 848;
r2 is the radius of beads in the 2 mm beads experiment = 1 mm;
V2 is the total volume of 3 U/mL heparin solution in mL used for the 2 mm beads experiment.
Table 1. Parameters of beads and solutions used in the total volume ratio experiments
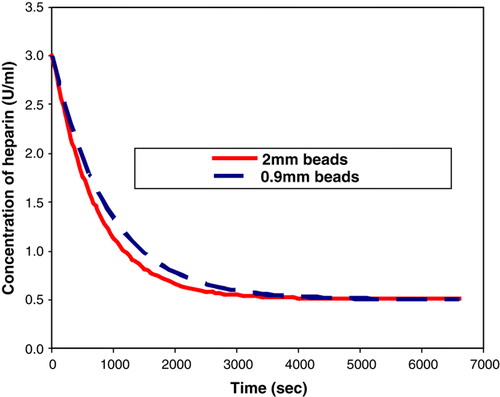
A rate experiment was performed to obtain the absorption results using the 2 mm beads and the results were plotted on the same axes for purposes of comparison in .
Figure 1. Fitted curves comparing heparin absorption rates under conditions where ratio of bead to solution volume is kept constant.
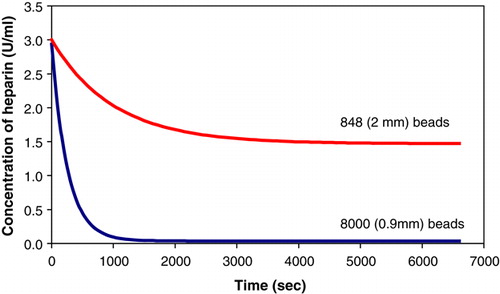
The results clearly indicate that the ratio of the total volume of beads to the volume of the solution have no influence on the absorption process.
Absorption Dependence on Total Surface Area of Beads
This experiment was performed to check whether the ratio of the total surface area of beads to the volume of solution had an effect on the absorption process. Two batch rate experiments were performed in which the ratio of the total surface area of beads to the volume of solution was kept constant. If the absorption process is affected by the ratio of the total surface area of the beads to the volume of the solution, then the results of both the experiments would be similar to each other.
The rate experiments were performed for 900 µm beads and 2mm beads. The number of beads and the volume of the solution used were adjusted such that the ratio of the surface area of the beads to the solution volume was kept constant.
Neglecting the membrane dimension:4
5 For the surface area ratio to be constant:
6
A batch of 3650 beads of diameter 900 µm was made. A batch rate experiment was performed using 40 mL of saline. Equation 6 was then used to obtain the number of 2 mm beads and the volume of saline that was required such that the ratio of the total surface area of the beads to the volume of solution remained constant. The obtained values are tabulated in .
Table 2. Parameters of beads and solutions used in the surface area ratio experiments.
The results obtained from the rate experiments were plotted on the same axes for purposes of comparison ().
Figure 2. Fitted curves comparing heparin absorption rates under conditions where the ratio of the total surface area of the beads to the volume of the solution is kept constant.
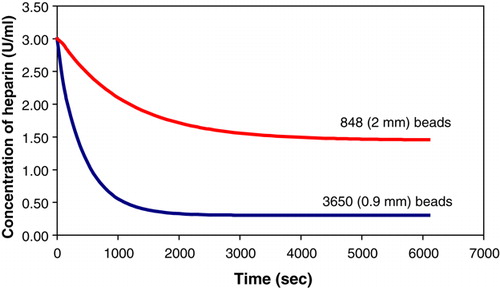
The results clearly indicate that the surface area of the beads does not influence the absorption rate.
Effects of the Bead Membrane on the Absorption of Heparin
The above experiments indicated that the absorption process does not depend on the volume or surface area of the beads. During the formation of beads, the poly-L-lysine is contained in the membrane of the beads. The following set of experiments were planned to check if the membrane of the beads had an influence on the absorption process.
It is essential to determine if any of the other constituents of the membrane apart from poly-L-lysine affects the absorption process. The following experiment was performed to confirm that the sodium alginate in the membrane had no effect on the absorption process. The sodium alginate used initially to form the beads was expected to have no part in the absorption, as it diffuses out in the final stage of the bead formation Citation[8]. A rate experiment involving variation of the sodium alginate concentration was performed to investigate the effect of sodium alginate on the absorption process.
Two sets of poly-L-lysine/alginate beads (8000 beads) of size 900 µm were made using the procedure described above. One set of beads was produced using a concentration of sodium alginate of 5%, while the other set was made using 2.5% sodium alginate. Rate experiments were performed for both sets of beads. The results obtained from the experiments are presented in .
Figure 3. Comparison of the adsorption of heparin by beads with varying concentrations of sodium alginate. The two curves are not easily distinguishable due to being superimposed.
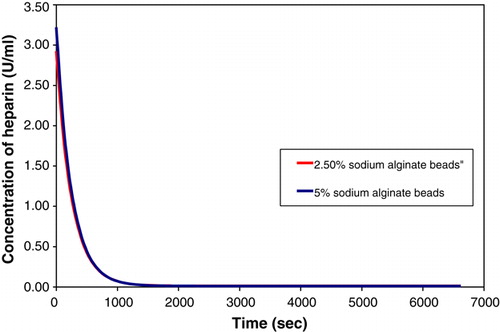
The results clearly indicate that sodium alginate has no effect on the absorption process, as varying the concentration of the sodium alginate does not alter the absorption process.
The following experiment was planned to confirm whether the membrane (poly-L-lysine) was the only factor to consider when determining the absorption capacity of the beads. Beads with no membrane were used in a rate experiment to determine the effect on the absorption process.
Approximately 8000 beads of size 900 µm were produced. Equal amounts of saline and 5% sodium alginate were mixed in a syringe. The droplets were allowed to fall into the calcium chloride solution, thereby forming beads with calcium alginate (gel structure with no membrane). All the other stages were excluded from the formation of the beads. A rate experiment was performed using the beads with no membrane.
The results obtained from the experiment are shown in .
Figure 4. Adsorption of heparin by beads with no membrane.
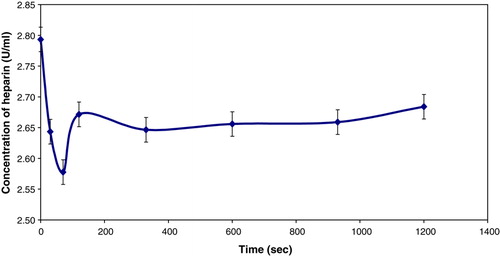
The results indicate that some of the heparin can be taken up by the calcium alginate; however, some of it is released back into the solution to obtain a new equilibrium concentration of 2.66 U/mL, which is much higher than 0.028 U/mL obtained using beads with a membrane. This leads to the conclusion that although calcium alginate absorbs heparin, the majority of the absorption is due to the poly-L-lysine.
As part of the experiments, it was vital to check if the membrane of the smaller beads was different from that of the larger beads and what effects, if any, the difference in membrane thickness would have on the absorption process.
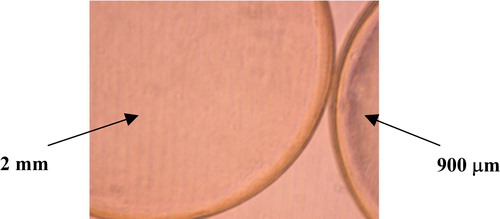
Upon microscopic observation, the smaller beads were found to have a thicker membrane than the larger beads (). The ratio of the membrane thickness was estimated using the programme Scion Image. The thickness of the 2 mm beads was estimated to be 0.006 mm, while the thickness of the 900 µm beads was 0.014 mm. After observing the noticeable difference in the membrane thickness, batch rate experiments were performed to check if the volume of the membrane of the beads influenced the absorption process.
Figure 5. Microscopic photograph of the 900 µm and 2 mm beads illustrating the different membrane thickness.
The ratio of the membrane thickness of the beads is as follows:7 where:
δ2 is the membrane thickness of the 2 mm beads in mm;
δ1 is the membrane thickness of the 900 µm beads in mm.
The above equation was used to obtain the parameters () that were used for the rate experiments at 37°C (normal human body temperature), such that the ratio of the membrane volume of the beads remained the same.
Table 3. Parameters used in the bead membrane volume ratio experiments.
The results obtained from the rate experiment are illustrated in .
Figure 6. Comparison of heparin absorption rate under conditions where the ratio of the membrane volume of the beads remains constant.
The above results clearly indicate that the absorption process is dependent on the volume of the membrane of the beads. The absorption capacity of the beads thus depends on the volume of the membrane, which implies that the reactor design must be based on the volume of the membrane of the beads and not on the volume or the surface area of the beads. Previously, the experimental data was fitted to a first order absorption model and the Freundlich Isotherm; however, the volume of the membrane of the beads was neglected. From the above process, it is evident that the membrane of the beads influences the absorption process, thus this parameter cannot be ignored. The effect of the volume of the membrane of the beads needs to be incorporated into both the constants for the First order model and the Freundlich Isotherm. It is essential to check if the models fit the above results in order to obtain a method of determining the constants irrespective of the conditions under which the experiments were performed. This would be beneficial for the reactor design as the value of the constants for a particular number of beads can be easily estimated.
From the previous article Citation[1], the experimental data fitted the following first order absorption model:11 where:
Csoln is the concentration of heparin in solution in U/mL;
t is the time in seconds;
K is the rate coefficient in seconds−1;
Cinf is the concentration of heparin U/ml at infinite time (equilibrium
concentration)
Figure 7. K-values for various membrane volumes of the beads.
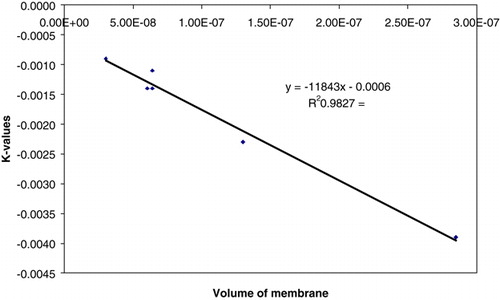
From , the K value obtained from the 2mm and the 900 µm beads is directly proportional to the volume of the membrane of the beads. Therefore if the volume of the membrane of the beads is known, the value of K can be obtained, irrespective of the size of the beads.
The Freundlich Isotherm in the previous article was obtained using the volume of the beads. The Freundlich isotherm is as follows:12 where:
mi is a constant which is positive and generally not an integer;
Ki is a constant;
Ceqm is the fluid phase concentration at equilibrium (concentration of heparin in saline solution at infinite time) in U/ml;
qi is the absorbed phase concentration in U/mL;
Figure 8. Data points fitted to Freundlich Isotherm using the volume of membrane of the beads.
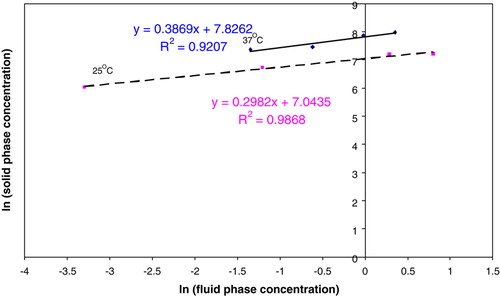
The above graph indicates that the data obtained still follows the Freundlich isotherm, and the gradient remains the same as that obtained in [1].
Relation of Absorption Rate to the Membrane Thickness of the Beads
Since poly-L-Lysine is known to absorb heparin Citation[9] and since the absorption of heparin is directly related to the membrane volume of the beads (), it would be beneficial if the membrane thickness of the beads could be controlled in order to obtain the optimum absorption conditions. Three sets of 2mm beads were produced, and the membrane thickness was altered by changing the time that the beads were kept in the poly-L-lysine solution. The first set of beads was produced by placing them in the poly-L-lysine solution for 20 minutes a second batch was produced by placing them in poly-L-lysine for 40 minutes whilst a third batch was obtained after a 60-minute incubation. The membrane thickness of the beads was then compared under light microscopy and photographed ( and ).
Figure 9. Microscopic photograph of 2 mm beads placed in poly-L-lysine solution for 20 minutes and 40 minutes, respectively.
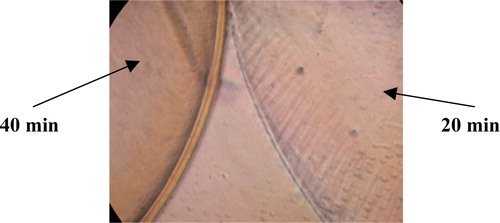
Figure 10. Microscopic photograph of 2 mm beads placed in poly-L-lysine solution for 20 minutes and 60 minutes, respectively.
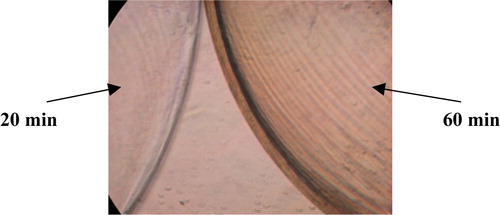
The ratio of the membrane thickness of the beads was determined, using the programme Scion Image, to be approximately14 where the subscript of δ represents the time in minutes that the beads were placed in the poly-L-lysine solution.
Rate Experiment for Beads with Varying Poly-l-lysine Content
Since poly-L-lysine is the main constituent that affects the absorption process, it would be beneficial to determine the effect of increasing the content of poly-L-lysine on the absorption process.
A batch of 850 beads of size 900 µm were produced using Chang's procedure Citation[8]; however, the last two steps were omitted in order to produce beads with a poly-L-lysine coating. Three sets of beads were produced. One set was incubated in saline overnight, one set was incubated in poly-L-lysine solution overnight, while the remaining set of beads were used immediately for a rate experiment. Another set of standard beads (containing poly-L-lysine membrane) were made by using the full procedure as described by Chang Citation[8]. The incubated beads were used for rate experiments using 23 mL of saline solution with 3U/mL of heparin. The results are as shown in .
Figure 11. Rates of heparin removal using beads with varying poly-L-lysine content.
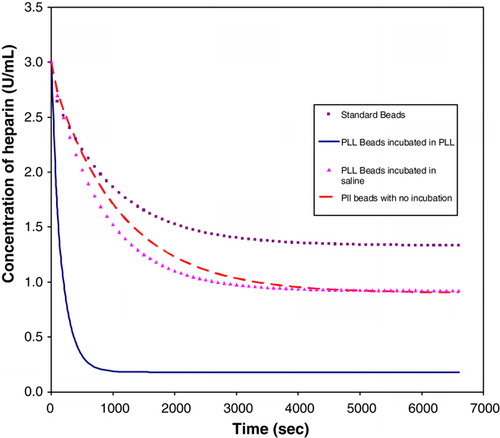
The rate coefficients for the first order model for the above data points are tabulated in .
Table 4. Rate coefficients for the beads with varying poly-L-lysine (PLL) content
The results clearly indicate that increasing the poly-L-lysine content of the beads increases the amount of heparin absorbed. This finding creates the possibility of using solid poly-L-lysine beads to improve the efficiency of the reactor.
Heparin Absorption in Fetal Calf Serum (FCS) Using Beads
The above experiments have indicated that the beads can efficiently absorb heparin from saline solutions. However, if the beads are to be used in extracorporeal procedures, then the feasibility of using the beads for heparin absorption from human blood must be tested. As an initial test, fetal calf serum was used. The properties of fetal calf serum are similar to that of blood, thus a rate experiment using the beads in heparinised fetal calf serum would give a clear indication as to whether the beads are able to absorb heparin from blood.
Rate experiments were performed in fetal calf serum to verify the efficiency of the beads at absorbing heparin. Two sets of approximately 1700 beads of size 900 µm were produced. One set was used in a rate experiment using fetal calf serum that contained 3U/ml of heparin. The other set was incubated in fetal calf serum for a day, and a rate experiment was performed in the same volume of saline solution, containing 3U/mL of heparin. Another experiment was performed with no beads to determine whether any of the heparin was absorbed by FCS. The results are presented in .
Figure 12. Comparison of the rate of heparin adsorption in fetal calf serum (FCS) and saline.
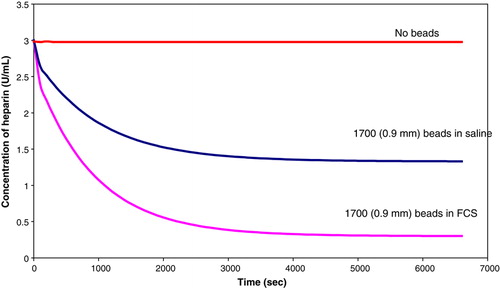
The rate coefficient for the first order model for the beads in FCS is -0.0011 sec−1. The results indicate that the beads are more efficient in fetal calf serum.
Heparin Absorption in Human Blood Using Beads
The efficiency of the beads for heparin absorption in human blood was tested by performing rate experiments in blood, FCS and saline. Each experiment used 3U/mL of heparin and 850 (2mm) beads. Fresh samples of blood were taken in citrate tubes and mixed. The samples, taken at time intervals ranging from 0 to 5400 seconds, were centrifuged for 20 minutes to separate the blood. The plasma was then centrifuged as before to remove any cellular debris from the samples. The results are shown in .
Figure 13. Comparison of the rate of heparin adsorption in blood, fetal calf serum and saline.
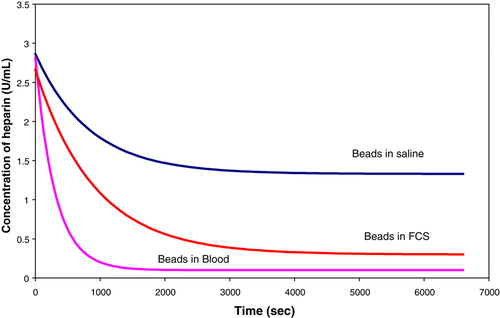
The rate coefficients for the first order model for the above data points are tabulated in .
Table 5. Rate coefficients for blood, FCS and saline
The results indicate that the beads are more efficient in blood and follow the same trend as the absorption process in saline.
Effect of pH on the absorption process
The above results indicate that the absorption process in blood is more efficient. One of the reasons for this may be pH. This experiment was performed to obtain the trends, if any, when the pH value is changed.
The effects of pH were observed by performing rate experiments using saline, FCS and blood solutions with varying pH. The volume of the beads and solution were kept constant 850 (2mm) beads were used in 3U/ml heparin solutions for the experiments. The results obtained from the experiments are illustrated in .
Figure 14. Comparison of the rate of heparin using different pH solutions.
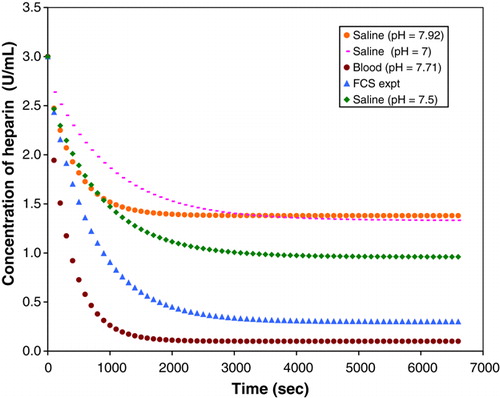
The rate coefficients for the first order model for the above data points are tabulated in .
Table 6. Rate Coefficients for the first order adsorption model
The results indicate that the pH has an effect on the absorption process. In the final design of the reactor, one would need to determine the optimum pH for the blood in order to ensure efficient absorption of heparin.
DISCUSSION
The absorption of heparin is not dependent on the total volume () or on the total surface area () of the beads. indicated that fewer larger sized beads absorbed less heparin than the smaller sized beads. The concentration of sodium aliginate did not have an effect on the absorption rate as illustrated in . Beads with no membrane or poly-L-lysine absorbed heparin initially. However, the heparin was released back into the solution until an equilibrium concentration of heparin was attained. The equilibrium concentration of heparin, 2.66 U/mL (), is much higher than 0.028 U/mL obtained using beads with a membrane.
Large beads have thinner membranes, while the small beads have thicker membranes (). The results obtained from the rate experiments implied that the absorption of heparin was affected by the membrane thickness (). The absorption of heparin is solely dependent on the poly-L-lysine content in the beads.
If the volume of the membrane of the beads is known, the value of the rate coefficient for a first order absorption model can be estimated using . The Freundlich Isotherm model () can also be used to estimate the amount of heparin that can be absorbed from the solution.
The membrane thickness definitely increased as the time of exposure of the beads in poly-L-lysine solution was increased ( and ). The results obtained from this experiment implied that the thickness of the membrane is directly related to the poly-L-lysine and can therefore be controlled by varying the time in which the beads are kept in the poly-L-lysine solution.
The results from indicated that the beads with more poly-L-lysine coating absorbed more heparin than the standard beads. The poly-L-lysine coated beads that were incubated in saline and the beads with no incubation absorbed almost the same amount of heparin. The beads that were incubated in poly-L-lysine removed much more heparin, in comparison to the other sets of beads. Controlling the amount of poly-L-lysine in the beads can optimize the absorption of heparin from the saline solution. Therefore the membrane thickness of the beads can be altered to absorb more heparin.
The beads are efficient at removing heparin from both FCS and human blood ( and 13). More heparin is absorbed in blood when compared to saline using the same number and volume of beads. The absorption rate is affected by pH (), and there seems to be an optimum pH; however, this value has not been identified.
CONCLUSION
Poly-L-lysine/alginate beads can efficiently absorb heparin from saline, fetal calf serum and blood. The thickness of the membrane of the beads can be adjusted to optimise the absorption process. Heparin absorbs onto the poly-L-lysine in the membrane of the beads, therefore increasing the poly-L-lysine content in the beads will improve the amount of absorption. Smaller sized beads have relatively thicker membranes and therefore absorb more heparin than the larger sized beads. Poly-L-lysine/alginate beads can therefore be used in a reactor to absorb heparin during extracorporeal procedures. It is anticipated that the findings of this article will be beneficial for the design of the reactor.
References
- Varghese M., Hildebrandt D., Glasser D., Rubin D.M., Crowther N.J. Efficiency of polymer beads in the removal of heparin: Toward the development of a novel reactor. Artif. Cells Blood Substit. Biotechnol. 2006; 34(4)419–432
- www.health.uab.edu (Nielsen, V. 2003. UAB Health System. Preventing Coagulopathies During Complex Cardiac Surgery, 09/3003).
- http://www.medicine.ucsf.edu/htc/patient/patients.heparin.shtml (Patients. Heparin, 2003, 08/2003).
- http://www.tigc.org/eguidelines/heparinchild.htm (Heparin in Children, 2003, 08/2003).
- www.uptodate.com (Kovalik, E.C. 2000. Hemiodialysis anticoagulation. Up to Date. 8(2)).
- Von Segesser L.K., Mueller X., Marty B., Horisberger J., Corno A. Perfusion. 2001; 16(5)411–416
- Ameer G.A., Harmon W., Sasisekharan R., Langer R. Biotechnol and Bioeng. 1999a; 62(5)602–608
- Chang, Thomas M.S., Wong, Harry (1992). US Patent No: 5084350.
- Vertrees, R.A., , et al 1994. ASAIO Journal Poster Session M560-M564.