Abstract
Objective
To undertake a cost-utility analysis comparing virtual illusion (VI) and transcranial direct current stimulation (tDCS) combination therapy, tDCS alone and standard pharmacological care in Ontario, Canada from a societal perspective over a three-month time horizon.
Design
Cost-utility analysis using Markov model methods
Setting
Community setting in Ontario, Canada.
Participants
Individuals with spinal cord injury and neuropathic pain (NP) resistant to pharmacological therapy.
Interventions
Virtual illusion and transcranial direct current stimulation, transcranial direct current stimulation alone and standard pharmacological therapy.
Outcome Measures
Incremental costs, quality adjusted life years (QALY) and incremental cost effectiveness ratio
Results
The incremental cost effectiveness ratio of VI and tDCS therapy cost is $3,396 per QALY (2020 Canadian dollars) when compared to standard care. The incremental cost per QALY of tDCS therapy alone is $33,167. VI and tDCS therapy had lower incremental costs (−$519) and higher incremental QALYs (0.026) compared to tDCS alone. From a public healthcare payer perspective, there is a 74% probability that VI and tDCS therapy and 54% probability that tDCS alone would be cost effective at a $50,000 per QALY willingness-to-pay threshold. Our findings remained relatively robust in various scenario analyses.
Conclusion
Our findings suggest that at three-months after therapy, VI and tDCS combination therapy may be more cost effective than tDCS therapy alone. Based on conventional health technology funding thresholds, VI and tDCS combination therapy merits consideration for the treatment of NP in adults with spinal cord injuries.
Background
In Canada, there are over 85,000 individuals living with spinal cord injury (SCI) in the community.Citation1 Eighty percent of these cases experience some level of neuropathic pain (NP).Citation2 NP is defined by the International Association of the Study of Pain (IASP) as “pain caused by a lesion or disease of the somatosensory nervous system”.Citation3
The most common treatment for NP are pharmacological, with gabapentinoids, tricyclic antidepressants and serotonin–norepinephrine reuptake inhibitors recommended as first line treatments.Citation4,Citation5 However, most individuals receiving these treatments do not achieve clinically significant pain reduction long-term which may have a large impact on the health-related quality of life and costs associated with NP.Citation6 For example, individuals receiving pharmacological treatments to reduce NP severity may experience adverse events including difficulty concentrating, drowsiness, lack of appetite, dizziness, and/or issues urinating.Citation7 These adverse events may lead to poor health-related quality of life, decreased productivity, and a high frequency of healthcare utilization, which may result in with high healthcare and societal costs associated with NP despite pharmacological therapy.Citation8–10
As a result, alternative non-pharmacological interventions may be considered for adjuvant therapy. Transcranial direct current stimulation (tDCS) is a non-invasive brain stimulation therapy used to treat various conditions including NP. tDCS involves the non-invasive transfer of a low intensity electrical current to an individual’s head, typically delivered via two large electrodes, operated by a small battery-powered device.Citation11 Placement of electrodes are intended to regulate current flow to specific regions of the brain associated with pain relief. In most studies, the duration of tDCS sessions was 20 min, with an intensity ranging from 1–2 mA, and repeated daily from between five to 10 sessions.Citation12 A recent systematic review pooled NP treatment effect from clinical studies using standardized mean differences because of the heterogeneity in pain intensity, depression and anxiety assessment scales.Citation13 The synthesis of the data observed no statistically significant reduction in pain reduction. However, the power of the pooled pain reduction estimates was limited by the small number of included studies and the small sample sizes of these studies. Additionally, the studies included in the review involved predominantly male participants so the pooled pain reduction estimates may not be generalizable across gender. Current clinical evidence has observed that the inclusion of Virtual Illusion (VI) to tDCS has shown improved outcomes compared to tDCS alone.Citation14 VI therapy is a non-immersive virtual reality therapy that can be used to reduce NP in individuals living with SCI.Citation14 Non-immersive virtual reality does not require head mount equipment, allowing participants to maintain connection to the real world environment.Citation14 VI therapy involves the use of cognitive techniques such as guided images and videos to modify behaviors and alter tactical perceptions.Citation15–17 VI therapy for individuals with SCI involves individuals sitting approximately 2.5 m in front of a screen that projects a video of a person walking.Citation15–17 A vertical mirror is placed in front of the individual on top of the screen to induce greater gait perception realism, due to the alignment of the patient’s own upper body and the video of walking legs projected onto the screen.Citation15–17 When used in conjunction with tDCS at an intensity ranging from 1-2mA, VI is usually initiated five minutes following the start of tDCS and lasts for 15 min, repeated daily for 10 sessions.
Studies have demonstrated that the simultaneous administration of tDCS and VI therapy, rather than tDCS alone, offers several advantages including a greater, significant, and maintained reduction in pain intensity perception over a 12 week period.Citation15,Citation16 However, both VI therapy and tDCS comes at additional equipment and personnel costs.Citation18,Citation19 Previous studiesCitation20,Citation21 have shown that virtual reality rehabilitation therapies involving the use of motion-sensing devices for 45–50 min sessions three days per week for seven to 12 weeks may lead to cost savings in other populations. To date, no economic evaluations have been conducted for virtual reality therapies for NP in the SCI population. Similarly, there is a lack of evidence on the cost-effectiveness of tDCS in the SCI population. Thus, this study aims to investigate the cost-utility of in-hospital VI and tDCS combination therapy and tDCS alone compared to standard care for Canadian adults with SCI experiencing NP from the perspective of the public health-care payer and the individual receiving treatment. A cost-utility analysis will provide valuable information for public payers in determining whether the implementation of tDCS and VI therapy or tDCS alone will be good value for money.
Methods
Overview
A cost-utility analysis was used to determine the cost, quality-adjusted life years (QALY) gained, and incremental cost-utility ratio (ICER) of the tDCS and VI therapy and tDCS alone versus and standard care.Citation22 This evaluation technique was chosen since QALY is a generic health outcome measure, allowing for broad comparisons across different health conditions and interventions. Standard care consists of first-line pharmaceutical intervention for NP. The analysis was carried out from a Canadian societal perspective where all interventions costs irrespective of payer are included in the analysis.Citation23 Specifically, this perspective includes all health care expenditures accrued by residents in Ontario paid for by the Ministry of Health and Long Term Care (MoHLTC). The MoHLTC covers approximately 70% of Ontario’s healthcare expenses,Citation24 providing a comprehensive picture of healthcare costs. The societal perspective incorporates the public health care payer expenditures and also includes the productivity costs due to time lost from work and non-work activities at each level of pain severity in the health states assessed.
Model structure
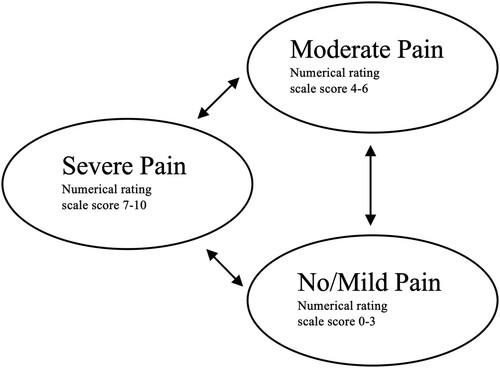
A cohort of 1000 individuals with chronic SCI experiencing NP was simulated using a probabilistic Markov model. The model structure is similar to a recent economic evaluation of a pharmacological treatment for individuals with chronic cervical NP.Citation25 The simulated model cohort could move between the three mutually exclusive health states according to NP severity. Severity was stratified using the numerical rating scale (NRS), the recommended measure for pain intensity following SCI.Citation26,Citation27 As in previous NP models,Citation28,Citation29 No/mild pain ranged from NRS 0–3, moderate pain ranged from NRS 4–6, and severe pain ranged from NRS 7–10.Citation30 All individuals started in the severe pain health state, comparable to the baseline pain intensity of participants involved in tDCS and VI therapyCitation15,Citation16 and tDCS clinical trials.Citation31,Citation32 The cycle length was two weeks, after which an individual could transition from one health state to another or remain in the same health state. This length was chosen to match the follow-up period of the primary study outcomes incorporated into the model.Citation15 A pictorial of the model is presented in . The model was developed using the “heemod” packageCitation33 in R 3.6.2.Citation34
Figure 1 Markov model describing patient transition between pain states over a three-month time horizon.
The model time frame for the primary analysis was three months in duration to match the follow-up period of the clinical trial by Soler and colleaguesCitation15 and similar to previous economic evaluations for NP.Citation25,Citation29 Since the time horizon was three months, mortality was not included in the model.
Cohort characteristics
Cohort characteristics were based on participant level demographic data from the primary clinical studies that inform the model inputs.Citation16,Citation31 Individuals in the model were adults over 18 years of age, with an SCI and severe NP (8 on the 11-point NRS) resistant to pharmaceuticals. Average age of the simulated model cohort was 46 ± 8.5 years, 66% male with an average time since SCI of 68 ± 37.7 months.
Data input
A brief literature search was conducted in PubMed and Google Scholar using search terms: virtual illusion, virtual walking, augmented reality, rehabilitation, transcranial direct current stimulation, spinal cord injury, neuropathic pain, pain, chronic pain, cost, cost-effectiveness, and cost-utility. Studies focussing on NP and SCI, studies written in English, and studies conducted in Canada were prioritized as sources of data input.
Data from four clinical trialsCitation15,Citation16,Citation31,Citation32 were used to estimate transition probabilities following treatment with tDCS alone and tDCS and VI therapy. The transition probability for the initial two-week cycle was derived from pain data before and following a two-week period of tDCS and VI or tDCS alone.Citation16,Citation31 Transition probabilities for subsequent two-week cycles were derived from observations of pain scores at subsequent two-week follow-ups.Citation15,Citation32 For tDCS and VI treatment, transition probabilities were based on observations of sustained outcomes at three months.Citation15 For tDCS alone, transition probabilities were derived from four-week follow-up data.Citation32 It is assumed that these probabilities are also representative at two weeks. Transition probability model inputs are presented in .
Table 1 Transition probability and utility (2020 Canadian dollars) model inputs.
Cost data
All source cost data were inflated to 2020 Canadian dollars using the Bank of Canada Cost Inflation Calculator.Citation35 The initial cost of the intervention and comparator were calculated using information received from a manufacturer of tDCS equipment (neuroCare Group GmbH), market costs of VI equipmentCitation36–41 and the Ontario Schedule of BenefitsCitation42,Citation43 and Canadian guidelines for personnel costs.Citation44,Citation45 Intervention cost model inputs are presented in . Additional per cycle costs were calculated based on the resource utilization associated with each health state. Resource utilization estimates for individuals with NP and SCI, including probability of a physician visit, probability of a specialist referral, probability of diagnostic test ordered referred to a specialist, and drug costs, were obtained from a previous economic evaluation of pregabalin for diabetic peripheral neuropathy and postherpetic neuralgia NP.Citation29 The probability of a physician visit, probability of a specialist referral, and cost of drugs ordered were dependent on the individual’s health state and the probability of a diagnostic test ordered was dependent on the probability of a physician visit and specialist referral.Citation29 Physician and specialist costs in addition to costs of diagnostic tests were weighed according to the probability of healthcare utilization of each healthcare service.Citation29 Detailed healthcare probabilities and costs are presented in Appendix .
Table 2 Transcranial direct current stimulation and virtual illusion intervention cost (2020 Canadian dollars) model inputs.
Productivity costs were calculated using the human capital method.Citation46 The amount of time lost per month from both paid work and unpaid work (e.g. daily activities, volunteer work) due to NP per month were obtained from a survey of Canadians suffering from NP and SCI.Citation46 The hours lost from paid and unpaid work were divided by two to fit our two-week cycles. The cost of lost productivity due to time lost from paid work were calculated by multiplying the number of hours of paid work lost by the 2020 average hourly wage from Statistics Canada.Citation46,Citation47 Lost productivity costs due to time lost from unpaid work were calculated by multiplying the number of hours of unpaid work lost by the 2020 minimum hourly wage in Ontario.Citation48 Productivity unit costs are presented in Appendix .
Utility data
To determine the QALY of tDCS and VI therapy versus tDCS alone, we used health utilities derived by Gu and colleaguesCitation49 from 2,719 adult respondents with NP. This study used an ordinary least squares regression model to map respondent NRS scores to EQ-5D utility values.Citation49 Utility model inputs are presented in . Utility values were weighed by the time spent in each health state to calculate QALY. Both costs and outcomes were not discounted given that the model length was one year.
Scenario and sensitivity analyses
The primary study outcome is the incremental cost per QALY, tDCS and VI therapy compared to standard care, and tDCS alone compared to standard care. This was calculated by dividing the incremental cost by the incremental QALY. We evaluated the impact of alternative model inputs on the incremental cost, QALYs, and ICER by conducting various scenario sensitivity analyses. Scenario analyses included are described in . Long-term direct healthcareCitation50,Citation51 and societal costsCitation46,Citation51 were estimated between three to twelve months for each health state (i.e. mild, moderate, and severe NP severity) and assigned to the proportion of individuals in each health state at the end of three months. Similar to a previous economic evaluation for NP, it was assumed that individuals did not change NP severity health states from three months to one year.Citation25 A two year time frame was also included in a separate scenario. Long-term costs are presented in Appendix . Public health-care payer perspective was examined separately as a scenario analysis. Uncertainty in the primary study outcome resulting from variability in the model inputs was assessed by conducting a probabilistic sensitivity analysis using a Monte Carlo simulation. More specifically, the study model was repeated 1,000 times. For each iteration, model inputs were extracted from random number pulls confined by a distribution assigned to each input. Cost inputs followed a gamma distribution, transition probabilities had multinomial distributions, utilities and probabilities of health care utilization were assigned a beta distribution as recommended by Briggs and colleagues.Citation52 The details of model inputs and distributions are presented in and .
Table 3 Description of scenarios for sensitivity analysis.
A cost-effectiveness acceptability curve is presented using the probabilistic sensitivity analysis results from the public healthcare payer perspective to evaluate the probability that tDCS and VI would be cost-effective for a willingness-to-pay thresholds ranging from 0 to $100,000 per QALY.
Model assumptions
We assumed similar clinical management for the tDCS and VI group and the tDCS group. The pivotal clinical trial comparing tDCS and VI with tDCS alone did not observe differences in major adverse events between the two NP treatments arms during the 12-week follow-up period.Citation15 It was assumed that this will continue to be the case at one year. Additionally, our model assumed no deaths within the time horizon applied. Finally, transition probabilities for cycles 1–6 were assumed to be the same, derived from studies with two and four week follow-up after treatment.Citation15,Citation32
Results
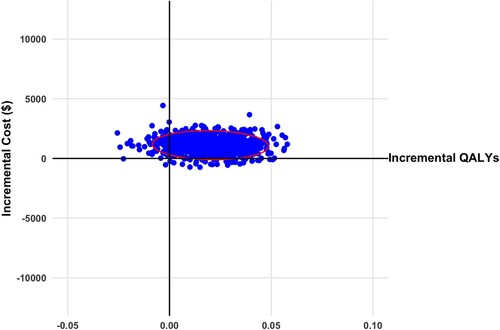
At the three-month time point, the model projected that from a cohort receiving VI and tDCS therapy, 28%, 57%, and 15% would be in the mild, moderate, and severe health states, respectively. On the other hand, for a cohort receiving tDCS therapy, none were in the mild health state, 36% were in the moderate health state, and 64% were in the severe health state at three months. The base case total cost per person for the cohort receiving VI and tDCS is more than standard care. The incremental QALY for VI and tDCS was more than standard care. Similar observations were seen for tDCS alone. However, the incremental cost effectiveness ratio is almost ten times higher for tDCS compared to standard care. This is a result of a higher incremental cost and lower incremental QALYs of tDCS versus VI and tDCS when compared to standard care. The base case results are presented in detail in . VI and tDCS dominates when compared with tDCS alone, resulting in a lower cost of −$519 and an improved incremental QALYs of 0.026. The repeated model simulations comparing VI and tDCS and tDCS alone with standard care resulted in most ICERs with a positive incremental QALY and a mix of positive and negative incremental costs. The results from a societal perspective are presented on a cost-effectiveness plane in and . The same results from a public healthcare payer perspective are presented in Appendix Figure A1 and A2. Examining the cost effectiveness acceptability curve from a public healthcare payer perspective, VI and tDCS had a 74% of being cost-effective at a willingness to pay (WTP) threshold of $50,000 per QALY gained and 90% at a WTP threshold of $100,000 per QALY (). tDCS alone at a WTP threshold of $50,000 per QALY had a 54% probability of being cost-effective, 80% at a $100,000 per QALY threshold.
Figure 2 Scatterplot of incremental cost and quality adjusted life years (QALYs) for virtual illusion and transcranial direct current stimulation versus standard care from societal perspective (2020 Canadian dollars). Ellipsis represents 95% confidence interval.
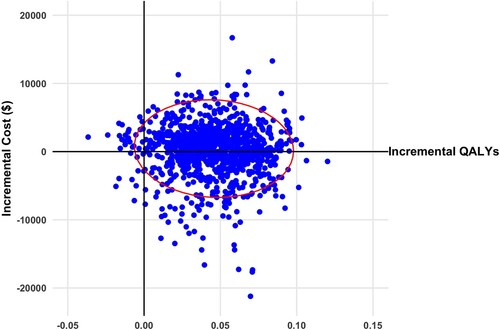
Figure 3 Scatterplot of incremental cost and quality adjusted life years (QALYs) for transcranial direct current stimulation versus standard care from societal perspective (2020 Canadian dollars). Ellipsis represents 95% confidence interval.
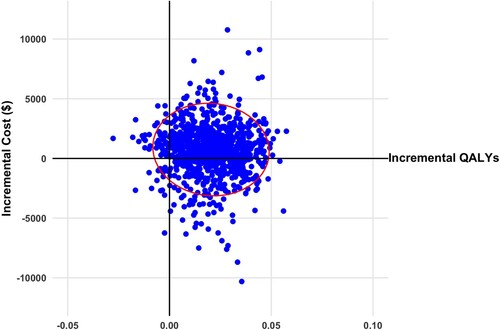
Figure 4 Cost-effectiveness acceptability curve for base case results from a public health care player perspective.
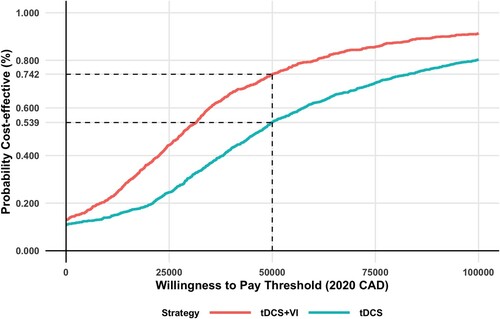
Table 4 Base care costs, quality adjusted life years (QALYs) and incremental cost and QALYs compared to standard care. Costs reported in 2020 Canadian dollars.
The total cost, QALYs and ICER for each scenario analysis conducted is presented in . Excluding the productivity costs from the analysis increased ICER values. Expanding the timeframe of the analysis resulted in VI and tDCS and tDCS dominating (lower cost and better QALY) standard care. Changes in utility and cost model inputs resulted in ICERs for VI and tDCS ranging between $1600 and $6100 per QALY. The ICER for tDCS alone was between $14,600 and $33,200.
Table 5 Results of scenario sensitivity analyses. Results reported in 2020 Canadian dollars, rounded to nearest tens.
Discussion
After three months, VI and tDCS therapy and tDCS alone are expected to result in slightly higher cumulative incremental costs and higher incremental QALYs from a societal perspective. Within three months, the initial cost of including VI to tDCS therapy is almost completely offset by reductions in health care costs resulting from improvements in NP severity. Likewise, there are improvements in health-related quality of life as a result of better NP outcomes. By one-year post-treatment, cumulative costs for the two treatments were lower than standard care. VI and tDCS therapy had larger negative incremental cost and QALY improvements compared to tDCS therapy alone. Our results remained relatively robust with alternative model inputs in the eight scenario analyses we carried out. Examining the results from the health care payer perspective there is a little over 50% probability that tDCS therapy is cost effective at a $50,000 per QALY WTP, while there is a 74% probability that VI and tDCS therapy is cost effective. The results observed in our study could not be compared to previous studies due to a lack of economic analyses evaluating treatments for NP in the SCI population and tDCS or VI therapy in general. This represents a large knowledge gap that requires further study.
Several conservative data inputs were used in the base case to bias our results to favor standard care. For example, when adding the final costs associated with being in a particular health state to extend our time horizon to one year, we used costs derived from a study by Hogan et al.Citation50 for the base case analysis. This reported on costs of a combination of various types of chronic pain, including arthritis, back and neck problems, fibromyalgia, migraine, NP, for each pain severity (mild, moderate, and severe) based on Canadian census data.Citation50 Previous studies have demonstrated that NP was more costly than other types of chronic pain,Citation8,Citation53 suggesting that our use of annual costs from Hogan et al.Citation50 was a conservative estimate. Indeed, when we used costs for NP alone derived from a US studyCitation51 in our scenario analysis, we observed a lower ICER value. However, since healthcare costs vary greatly from the US to Canada due to differences in healthcare systems, we decided to use a conservative estimate for our base case analysis. Additionally, productivity costs were derived from absenteeism data,Citation46 but not presenteeism. In our scenario analysis using absenteeism and presenteeism productivity costs from the United States,Citation51 we observed a large decrease in the total cost of the intervention resulting in a large decrease in the resulting ICER. Ultimately, our base case included various conservative cost estimates biased towards the comparator, resulting in a more conservative ICER value.
Strengths of our study included addressing uncertainties around parameter estimates through probabilistic sensitivity analysis and various scenario analyses. Additionally, the clinical trial data we used only recruited individuals with NP after SCI who were not responding to drug treatments, reflecting the anticipated population that would receive VI and tDCS therapy in a real-world clinical setting.
Our study had a number of limitations. First, our patient-level data for both the intervention and the comparator were derived from clinical trials with small sample sizes of less than 20 participants,Citation15,Citation16,Citation31,Citation32 leading to increased uncertainty around the data inputs used. Data input uncertainty was incorporated in our analysis by assigning distributions with large standard deviations to model variables in our probabilistic model. At a high WTP of $100,000 there is still only a 10% and 20% probability that VI and tDCS and tDCS alone is not cost effective. This signifies that there remains some uncertainty in the cost-effectiveness results. Another limitation is the exclusion of adverse event related costs because the frequency of these events at each NP pain severity level were not available. Clinical studies on VI and tDCS treatment have not observed any differences in adverse outcomes.Citation15 Thus, it is not expected that the inclusion of adverse event related cost would change the incremental outcomes. A third limitation was the short time horizon of our study. Although our time horizon was the same as that used in previous studies,Citation25,Citation28,Citation29 a three month time horizon may not capture future costs and benefits associated with the VI and tDCS treatment for NP. Due to the short clinical trial follow-up period and lack of long-term studies, it would be difficult to predict the effect of either VI and tDCS therapy or tDCS therapy alone on NP pain intensity over a period exceeding one year. Furthermore, there have been no studies that have followed up on the costs of a NP population over a duration of longer than a year. As such, the cost of NP may be higher or lower in comparison to our extrapolated costs over a one-year time horizon. Further studies are needed to quantify the long-term impact of the intervention on NP pain intensity and costs. Another limitation of our study was exclusion of out-of-pocket and caregiving costs. These costs are expected to increase with increasing levels of pain severity and would result in a more favorable ICER for the intervention.Citation8,Citation53,Citation54 Unfortunately, this data is unavailable and should be explored in future economic analyses. Lastly, it should be noted that our economic evaluation may not be generalizable to other non-immersive or immersive virtual reality interventions that use different equipment.Citation14
Overall, VI and tDCS therapy appears to be cost-effective at a $50 000 WTP threshold over a three-month time horizon from a Canadian public payer and societal perspective. On the other hand, whether tDCS therapy alone is cost-effective at the same threshold remains uncertain. At longer timeframes, VI and tDCS and tDCS alone are estimated to decrease costs. Comparing the results for VI and tDCS therapy to tDCS alone, the inclusion of VI to tDCS therapy resulted in a lower incremental cost and greater QALY than tDCS alone. As such, VI and tDCS therapy should be considered a viable option for treatment of NP following SCI. However, this recommendation should be treated with caution as more clinical trials with larger samples sizes investigating the long-term effects of VI and tDCS therapy on pain intensity and secondary complications in individuals with NP and SCI are needed. There are limited treatment options for individuals who continue to experience NP despite receiving pharmacological therapies. This lack of treatment alternatives results in a substantial economic burden for health care payers and individuals with NP. Our analysis suggests that based on current clinical evidence, VI and tDCS therapy may be a cost-effective option for individuals with SCI experiencing NP resistant to standard care.
Conclusion
Overall, we found that virtual illusion and tDCS combination therapy was cost-effective at a $50,000 WTP threshold over a one-year time horizon from a Canadian public payer and societal perspective. As such, public funding for virtual illusion and tDCS combination therapy should be considered for the treatment NP following SCI. However, this recommendation should be treated with caution as more clinical trials with larger samples sizes investigating the long-term effects of virtual illusion and tDCS combination therapy on pain intensity and secondary complications in individuals with NP and SCI are needed.
Disclaimer statements
Contributors None.
Funding This work was supported by the Ontario Neurotrauma Foundation and the Ontario Ministry of Health and Long Term Care. The authors had independent control over study methods, analysis and interpretation of the results.
Conflicts of interest Authors have no conflict of interests to declare.
Acknowledgments
The authors do not have any acknowledgments.
References
- Noonan VK, Fingas M, Farry A, Baxter D, Singh A, Fehlings MG, et al. Incidence and prevalence of spinal cord injury in Canada: a national perspective. Neuroepidemiology 2012;38(4):219–26.
- Burke D, Fullen BM, Stokes D, Lennon O. Neuropathic pain prevalence following spinal cord injury: a systematic review and meta-analysis. Eur J Pain 2017;21(1):29–44.
- International Association for the Study of Pain. IASP pain terminology. 2017 [cited 2020 December 9]. Available from https://www.iasp-pain.org/Education/Content.aspx?ItemNumber=1698#Neuropathicpain.
- Mu A, Weinberg E, Moulin DE, Clarke H. Pharmacologic management of chronic neuropathic pain: review of the Canadian pain society consensus statement. Can Fam Physician 2017;63(11):844–52.
- Deng Y, Luo L, Hu Y, Fang K, Liu J. Clinical practice guidelines for the management of neuropathic pain: a systematic review. BMC Anesthesiol 2016;16:12.
- Moulin DE, Clark AJ, Gordon A, Lynch M, Morley-Forster PK, Nathan H, et al. Long-term outcome of the management of chronic neuropathic pain: a prospective observational study. J Pain 2015;16(9):852–61.
- Meyer-Rosberg K, Kvarnstrom A, Kinnman E, Gordh T, Nordfors L-O, Kristofferson A. Peripheral neuropathic pain–a multidimensional burden for patients. Eur J Pain 2001;5(4):379–89.
- O'Connor AB. Neuropathic pain: quality-of-life impact, costs and cost effectiveness of therapy. Pharmacoeconomics 2009;27(2):95–112.
- Smith BH, Torrance N, Bennett MI, Lee AJ. Health and quality of life associated with chronic pain of predominantly neuropathic origin in the community. Clin J Pain 2007;23(2):143–9.
- Scott FT, Johnson RW, Leedham-Green M, Davies E, Edmunds WJ, Breuer J. The burden of Herpes Zoster: a prospective population based study. Vaccine 2006;24(9):1308–14.
- Knotkova H, Woods AJ, Bikson M, Nitsche MA. Transcranial direct current stimulation (tDCS): what pain practitioners need to know. Prac Pain Manag 2015;15(3).
- Lefaucheur J-P, Antal A, Ayache SS, Benninger DH, Brunelin J, Cogiamanian F, et al. Evidence-based guidelines on the therapeutic use of transcranial direct current stimulation (tDCS). Clin Neurophysiol 2017;128(1):56–92.
- Yu B, Qiu H, Li J, Zhong C, Li J. Noninvasive brain stimulation does not improve neuropathic pain in individuals with spinal cord injury: evidence from a meta-analysis of 11 randomized controlled trials. Am J Phys Med Rehabil 2020;99(9):811–20.
- Chi B, Chau B, Yeo E, Ta P. Virtual reality for spinal cord injury-associated neuropathic pain: systematic review. Ann Phys Rehabil Med 2019;62(1):49–57.
- Soler MD, Kumru H, Pelayo R, Vidal J, Tormos JM, Fregni F, et al. Effectiveness of transcranial direct current stimulation and visual illusion on neuropathic pain in spinal cord injury. Brain 2010;133(9):2565–77.
- Kumru H, Soler D, Vidal J, Navarro X, Tormos JM, Pascual-Leone A, et al. The effects of transcranial direct current stimulation with visual illusion in neuropathic pain due to spinal cord injury: an evoked potentials and quantitative thermal testing study. Eur J Pain 2013;17(1):55–66.
- Moseley GL. Using visual illusion to reduce at-level neuropathic pain in paraplegia. Pain 2007;130(3):294–8.
- Islam MK, Brunner I. Cost-analysis of virtual reality training based on the virtual reality for upper extremity in subacute stroke (VIRTUES) trial. Int J Technol Assess Health Care 2019;35(5):373–8.
- Sauvaget A, Tostivint A, Etcheverrigaray F, Pichot A, Dert C, Schirr-Bonnais S, et al. Hospital production cost of transcranial direct current stimulation (tDCS) in the treatment of depression. Neurophysiol Clin 2019;49(1):11–18.
- Gandolfi M, Geroin C, Dimitrova E, Boldrini P, Waldner A, Bonadiman S, et al. Virtual reality telerehabilitation for postural instability in Parkinson’s disease: a multicenter, single-blind, randomized, controlled trial. Biomed Res Int 2017;2017:7962826.
- Llorens R, Noe E, Colomer C, Alcaniz M. Effectiveness, usability, and cost-benefit of a virtual reality-based telerehabilitation program for balance recovery after stroke: a randomized controlled trial. Arch Phys Med Rehabil 2015;96(3):418–425.e2.
- Jakubiak-Lasocka J, Jakubczyk M. Cost-effectiveness versus cost-utility analyses: what are the motives behind using each and how do their results differ?—A Polish example. Value Health Reg Issues 2014;4:66–74.
- CADTH. Guidelines for the economic evaluation of health technologies. 4th ed. March 2017.
- Ontario Ministry of Health and Long Term Care. Health system funding reform. 2018 [cited 2020 November 29]. Available from http://www.health.gov.on.ca/en/pro/programs/ecfa/funding/hs_funding.aspx.
- Akazawa M, Igarashi A, Ebata N, Murata T, Zeniya S, Haga Y, et al. A cost-effectiveness analysis of pregabalin for the treatment of patients with chronic cervical pain with a neuropathic component In Japan. J Pain Res 2019;12:2785–97.
- Bryce TN, Budh CN, Cardenas DD, Dijkers M, Felix ER, Finnerup NB, et al. Pain after spinal cord injury: an evidence-based review for clinical practice and research. report of the national institute on disability and rehabilitation research spinal cord injury measures meeting. J Spinal Cord Med 2007;30(5):421–40.
- Dixon S, Poole CD, Odeyemi I, Retsa P, Chambers C, Currie CJ. Deriving health state utilities for the numerical pain rating scale. Health Qual Life Outcomes 2011;9:96.
- Wang BC, Liu D, Furnback WE, Bifa F, Dong P, Xie L, et al. The cost-effectiveness of pregabalin versus gabapentin for peripheral neuropathic pain (pNeP) and postherpetic neuralgia (PHN) in China. Pain Ther 2016;5(1):81–91.
- Tarride JE, Gordon A, Vera-Llonch M, Dukes E, Rousseau C. Cost-effectiveness of pregabalin for the management of neuropathic pain associated with diabetic peripheral neuropathy and postherpetic neuralgia: a Canadian perspective. Clin Ther 2006;28(11):1922–34.
- Boonstra AM, Stewart RE, Koke AJ, Oosterwijk RF, Swaan JL, Schreurs KM, et al. Cut-off points for mild, moderate, and severe pain on the numeric rating scale for pain in patients with chronic musculoskeletal pain: variability and influence of sex and catastrophizing. Front Psychol 2016;7:1466.
- Yoon EJ, Kim YK, Kim H-R, Kim SE, Lee Y, Shin HI. Transcranial direct current stimulation to lessen neuropathic pain after spinal cord injury: a mechanistic PET study. Neurorehabil Neural Repair 2014;28(3):250–9.
- Wrigley PJ, Gustin SM, McIndoe LN, Chakiath RJ, Henderson LA, Siddall PJ. Longstanding neuropathic pain after spinal cord injury is refractory to transcranial direct current stimulation: a randomized controlled trial. Pain 2013;154(10):2178–84.
- Filipović-Pierucci A, Zarca K, Durand-Zaleski I. Markov models for health economic evaluation: the R Package heemod. ArXiv e-prints R package version 0 8, 1702 03252.
- R Core Team. R: A language and environment for statistical computing. Vienna: R Foundation for Statistical Computing; 2019; [cited 2020 November 29]. Available from https://www.R-project.org/.
- Bank of Canada. Inflation calculator [cited 2020 November 29]. Available from https://www.bankofcanada.ca/rates/related/inflation-calculator/.
- CostHelper. How much does a home theater projector cost? [cited 2020 December 11]. Available from https://electronics.costhelper.com/home-theater-projector.html.
- Base Two Media. How much does video production cost? [cited 2020 December 11]. Available from https://videoforbusiness.ca/how-much-does-video-production-cost/.
- Staples Inc. Projector screens. [cited 2020 December 11]. Available from https://www.staples.ca/collections/projector-screens-6658.
- Statista. Average computer price 2019 [cited 2020 December 11]. Available from https://www.statista.com/statistics/722992/worldwide-personal-computers-average-selling-price/.
- Fixr.com. 2020 Bathroom mirror installation cost | mirror costs. [cited 2020 December 11]. Available from https://www.fixr.com/costs/bathroom-mirror-installation#bathroom-mirror-cost-by-size.
- Costhelper. How much do speakers cost? [cited 2020 December 11]. Available from https://electronics.costhelper.com/speaker.html.
- Ontario Ministry of Health. Schedule of benefits physician services under the health insurance act Queen's Printer for Ontario 2020 Mar 19.
- Ontario Ministry of Health. Schedule of benefits for laboratory services Queen's Printer for Ontario 2020 Jul 1.
- Financial Services Commission of Ontario. Professional fees guideline – physiotherapists Queen's Printer for Ontario 1997 Nov 22.
- Ontario Nurses’ Association. Highlights of collective agreement changes as a result of the Kaplan Award and items in agreement between ONA and participating hospitals 2018 Apr 1.
- Tarride JE, Collet JP, Choinière M, Rousseau C, Gordon A. The economic burden of neuropathic pain in Canada. J Med Econ 2006;9(1-4):55–68.
- Statistics Canada. Average weekly earnings, average hourly wage rate and average usual weekly hours by union status, annual. 2020; Available from https://www150.statcan.gc.ca/t1/tbl1/en/tv.action?pid=1410013401.
- Ontario Ministry of Labour, Training and skills development. Minimum wage. 2020 [cited 2020 November 29]. Available from https://www.ontario.ca/document/your-guide-employment-standards-act-0/minimum-wage.
- Gu NY, Bell C, Botteman MF, Ji X, Carter JA, van Hout B. Estimating preference-based EQ-5D health state utilities or item responses from neuropathic pain scores. Patient 2012;5(3):185–97.
- Hogan ME, Taddio A, Katz J, Shah V, Krahn M. Incremental health care costs for chronic pain in Ontario, Canada: a population-based matched cohort study of adolescents and adults using administrative data. Pain 2016;157(8):1626–33.
- Schaefer C, Sadosky A, Mann R, Daniel S, Parsons B, Tuchman M, et al. Pain severity and the economic burden of neuropathic pain in the United States: BEAT neuropathic pain observational study. Clinicoecon Outcomes Res 2014;6:483–96.
- Briggs AH, Claxton K, Sculpher MJ. Chapter 4: making decision models probabilistic. In: Briggs AH, Claxton K, Sculpher MJ, (eds.) Decision modelling for health economic evaluation United States. New York: Oxford University Press; 2011. p. 77–120.
- McCarberg BH, Billington R. Consequences of neuropathic pain: quality-of-life issues and associated costs. Am J Manag Care 2006;12(9 Suppl):263.
- McDermott AM, Toelle TR, Rowbotham DJ, Schaefer CP, Dukes EM. The burden of neuropathic pain: results from a cross-sectional survey. Eur J Pain 2006;10(2):127–35.
- Delshad SD, Almario CV, Fuller G, Luong D, Spiegel BMR. Economic analysis of implementing virtual reality therapy for pain among hospitalized patients. NPJ Digit Med 2018;1:22.
- Canadian Institute for Health Information. Physician services benefit rates, 2018–2019 – Data Tables 2020 Oct 29.
Appendices
Table A1 Healthcare utilization probabilities, and unit cost (2020 Canadian dollars) model inputs.
Table A2 Productivity cost (2020 Canadian dollars) model inputs.
Table A3 Long-term direct healthcare and productivity cost (2020 Canadian dollars) model inputs for one and two-year scenario analyses.
Figure A1 Scatterplot of incremental cost and quality-adjusted life year (QALYs) for virtual illusion and transcranial direct current stimulation versus standard care for the public health care payer perspective (2020 Canadian dollars).

Figure A2 Scatterplot of incremental cost and quality-adjusted life years (QALYs) for transcranial direct current stimulation versus standard care base case analysis for the public health care payer perspective (2020 Canadian dollars).