
Abstract
Context
The Spinal Cord Independence Measure is a comprehensive functional rating scale for individuals with spinal cord lesion (SCL).
Objective
To validate the scores of the three subscales of SCIM IV, the fourth version of SCIM, using advanced statistical methods.
Study Design
Multi-center cohort study.
Setting
Nineteen SCL units in 11 countries.
Methods
SCIM developers created SCIM IV following comments by experts, included more accurate definitions of scoring criteria in the SCIM IV form, and adjusted it to assess specific conditions or situations that the third version, SCIM III, does not address. Professional staff members assessed 648 SCL inpatients, using SCIM IV and SCIM III, at admission to rehabilitation, and at discharge. The authors examined the validity and reliability of SCIM IV subscale scores using Rasch analysis.
Results
The study included inpatients aged 16–87 years old. SCIM IV subscale scores fit the Rasch model. All item infit and most item outfit mean-square indices were below 1.4; statistically distinct strata of abilities were 2.6–6; most categories were properly ordered; item hierarchy was stable across most clinical subgroups and countries. In a few items, however, we found misfit or category threshold disordering. We found SCIM III and SCIM IV Rasch properties to be comparable.
Conclusions
Rasch analysis suggests that the scores of each SCIM IV subscale are reliable and valid. This reinforces the justification for using SCIM IV in clinical practice and research.
Introduction
The Spinal Cord Independence Measure third version (SCIM III) has been widely used as a comprehensive functional rating scale for clinical and research purposes, for individuals with spinal cord lesions (SCL) (Citation1–3). It has been translated into many languages and was the basis for the development of several assessment tools (Citation3–5).
The validity and reliability of the subscale scores of the first three SCIM versions have been demonstrated in several publications (Citation1, Citation6–8). Two publications used Rasch analysis, which is based on a model that assumes unidimensionality (Citation8, Citation9). The model, its advantages for SCIM studies, and its limitations are discussed in the supplementary material (Appendix 1).
SCIM was intended to score independence, defined as a state in which persons living with SCL perform tasks without assistance, assistive devices, or supervision, in a manner that fits their medical and personal interests. It was intended to score performance, defined as what the examinees are actually doing, or for some items, what a clinician observed that they were doing at a certain time, in a given context (not what they need or are supposed to be able to do, or what was observed at another time). The meaning of independence and performance in SCIM is further discussed in Appendix 1. Experts and caregivers indicated, however, that the phrasing of SCIM III items allows different interpretations of the terms “independence” and “performance” (Citation8, Citation10–12).
Experts from several countries also noted the need to clarify the phrasing of certain categories and proposed adapting the scoring for conditions or situations that SCIM III did not address (e.g. while showering, using a c-pap, or transferring for those who can walk). Studies have also revealed concerns with the generally acceptable psychometric properties of SCIM III subscale scores (Citation1, Citation8).
Consequently, despite the demonstrated validity and reliability of SCIM III subscale scores, the original development team created a new version, SCIM IV, to eliminate misleading phrasings, improve scale clarity, and adapt it to additional potential conditions, incorporating many of the suggested changes but retaining the advantages of the SCIM format. The authors demonstrated the validity, inter-rater reliability, and responsiveness of SCIM IV subscale scores, using conventional statistical methods, in a previous study, showing that SCIM IV and SCIM III mean values, in all subscales, were very close (Citation13).
The present study aimed to evaluate the psychometric properties of SCIM IV subscale scores, using an item-response theory (IRT) analytical approach, which makes stronger assumptions than does classical test theory approach, as explained in Appendix 1.
Methods
The development of SCIM IV
After reviewing the correspondence with users and studies addressing SCIM III, the developers prepared the first draft of SCIM IV, collected comments from SCL experts, piloted the revised tool, and created a second draft (Appendix 2, in supplementary material) (Citation1, Citation8, Citation14) Appendix 3 (in supplementary material) details the changes made in SCIM III to create SCIM IV, and the reason for each change.
Retaining the general pattern of SCIM III, SCIM IV consists of 16 items, divided into 3 subscales: Self-care (SC), Respiration and sphincter management (RSpM), and Mobility (Mo). SCIM IV retained the relative weights of subscales and items, which is the product of the consensus of an SCL rehabilitation team, and has not been challenged over the years.
A significant change introduced in SCIM IV is the Transfers item structure and scoring (Appendix 2). This item scoring (0–7) is a result of counting the tasks that raters observed to be performed without assistance or supervision, whereas every other item is scored as one task.
Participants
Investigators enrolled SCL inpatients consecutively, in the acute, subacute, or chronic stage, from 19 spinal units in 11 countries: Brazil, Canada, China, Denmark, India, Israel, Italy, Norway, Portugal, Turkey, and the United Kingdom. Inclusion criteria were traumatic or non-traumatic SCL of American Spinal Injury Association (ASIA) impairment scale grade (AIS) A–D, and age ≥16 years (Citation15). Exclusion criteria were concomitant impairments, such as brain injury, mental illness or disorder, or any condition that might influence the participants’ everyday function, and refusal to participate.
Procedure
Raters evaluated all participants between 2016 and 2019, using SCIM III and SCIM IV (Appendix 2). For SCIM IV scoring, 16 of the 19 participating units used the original Hebrew or English versions of SCIM IV, and 3 used trans-culturally validated translations. For SCIM III scoring, 15 units used original versions, 3 trans-culturally validated translations, and 1 used an unvalidated translation. Two raters collected SCIM IV data as part of an inter-rater reliability study (Citation13). Data collected by one of the raters, selected randomly, were used for the present analysis. SCIM III data were similarly collected by one of the SCIM IV examiners or by a staff member who performed routine SCIM III scoring. Examiners who scored both scales evaluated half the patients with SCIM III first and half with SCIM IV first.
All raters scored both scales by direct observation within a week after admission to rehabilitation and during the week before discharge. In exceptional cases (e.g. bowel habits), where direct observation was difficult, raters scored tasks based on information obtained from staff members who had been observing the participants during the same week.
All raters were experienced in the care of individuals with SCL. When possible, raters were blind to the participants’ functioning before the study, and experienced in assessing at least a certain subscale, and the same staff members scored each subscale throughout the study.
In each unit, investigators entered participant data and into Excel files and e-mailed the files to the first author for pooling and analysis.
Data analysis
Because of statistical software constraints, we excluded a subscale from the analysis for a given participant if one or more scores for that data entry point were missing, but retained other subscales without missing data for that participant. We used the Rasch model (Appendix 1) for the analysis. In this model, item difficulty and person ability levels and thresholds (the ability levels at which adjacent categories are equally likely to be observed) are aligned along the same linear scale, in logit (log-odd) units, higher thresholds indicating a better condition. We used the Rasch partial credit model (PCM) because the SCIM IV dataset fits the PCM assumption that each item can have a different number of categories, allowing for distinct distributions of thresholds along the ability continuum, which the Rasch rating scale model (RSM) does not allow (Citation16, Citation17).
The analysis included investigation of the match between the distribution of the persons’ ability and item difficulty estimates (using the Rasch ruler, threshold imprinting, and comparisons of the average values of Rasch measures), and assessment of the category ordering consistency within the items (Citation18, Citation19).
Category ordering within items is graphically demonstrated by the response probability curves (RPCs) (Citation19). Analyses also included computation of the reliability and person separation indices, and of the statistically discernible levels of ability (strata) (Citation20, Citation21). It involved assessment of the fit of item scores to the Rasch model using the mean-square infit and outfit indices (Citation22, Citation23). To determine whether modifying the scale to remove misfit changes person measures, we calculated correlations between person measures when removing items and collapsing SCIM IV subscales.
Additional details on the above-mentioned analyses are reported in Appendix 1.
To assess the degree of suitability of subscales for assessing the full extent of patient ability, we calculated ceiling and floor effects, which are the proportion of patients who were rated with maximum or minimum scores, respectively, in all the items of each subscale. An extreme score rate >5% indicates a relatively too easy or too difficult subscale (Citation24).
Analysis also involved estimation of unidimensionality (Citation22) to verify that the subscales assess the participant's independence in coping with the difficulty of daily tasks, and not other properties. Although fit to the Rasch model indirectly indicates that subscales are unidimensional, we further investigated unidimensionality using Factor analysis and calculating the logit value of score variance explained by person ability and item difficulty, as a percentage of the total score variance (Citation25). In addition, we performed a principal component analysis on the residuals of the model and calculated the correlation corrected for attenuation between person abilities evaluated on each set of items, in each subscale. Correlation coefficient values >1 that reflected an algebraic artifact due to asymmetric distribution of errors were set at 1. Values close to 1 support unidimensionality (Citation25).
We used differential item functioning (DIF), i.e. the stability of the difficulty of the items across different classes of subjects, to examine subscale reliability (Citation26). To this end, we contrasted classes that were examined in previous publications on SCL (Citation8, Citation27). We also contrasted item difficulty in each country with the set of all other countries (item bias).
To examine the relative weights of the different subscale scores, we contrasted the model-expected SCIM IV weighted raw scores with the Rasch ability measure.
To support the use of SCIM IV, we compared SCIM IV Rasch measures with historic admission SCIM III measures, because they were the measures used to validate SCIM III (Citation8). We also compared the SCIM IV and SCIM III Rasch measures of the present study, contrasting their thresholds and calculating the correlations between them.
We conducted the Rasch analysis using the R software (version 3.6.1, 2019), including the eRm package (open-source package, version 0-1.0). For estimations, we used the R library privately developed by the statistician who performed the analyses for the study (RR Consulting). The equations are detailed in supplementary material, in Appendix 4. We performed a sample size calculation following available guidelines for Rasch analysis (Appendix 4) (Citation28, Citation29).
Ethical considerations
The local ethics committee of each unit approved the study. Participants signed consent forms before the start of study procedures. Participants were given written and oral information, emphasizing that they could refuse to participate at any time, without consequences for their treatment. Participating units de-identified the data before analysis.
Results
Participant data
Of 767 SCL individuals recruited for the study, 648, aged 16–87 years, who met the inclusion-exclusion criteria, were included in the study. details person and SCL characteristics. Data were missing in 0.8%−9% of participants (Table S1, Appendix 5). Sample size calculation indicated that it was borderline for the Mo subscale analyses and large enough for the analyses of the other subscales (Appendix 4).
Table 1 Patients and SCI characteristics.
Rasch ruler
The Rasch rulers (or the “person-item maps”) for each subscale are displayed in (a–c). These figures and Table S2 (Appendix 5) show that in all SCIM IV subscales, the distribution of mean item difficulty levels matched that of mean person ability measurements. The values of ability measurements were higher at discharge than at admission.
Figure 1 (A–C). Person map of items. A. Self-care (N = 644 and 624); B Respiration and sphincter management (N = 644 and 618); C. Mobility (N = 603 and 591). The numbers below the lower horizontal line are the logit values that belong to both the lower and upper horizontal lines representing the X-axis. These values illustrate item difficulty and person ability. Each horizontal line inside the figure represents the location of the difficulty levels of an item along the values on the X-axis. The black circle on each horizontal line represents the mean person ability required to cope with the task that the item represents. The empty circles on each horizontal line represent the threshold difficulties between the categories of that item, and the numbers below these circles illustrate the order of the thresholds (1 is the first threshold, 2 the second, etc.), along the values on the X-axis. When the order of the numbers is not consecutive (e.g., 3 before 2), the thresholds are said to be disordered. The “ticks” below the upper horizontal line representing the X-axis are imprinting of the empty circles on the axis, intended to highlight the distribution of the thresholds along person ability levels. Each bar above that horizontal line represents the number of persons with a given ability level.
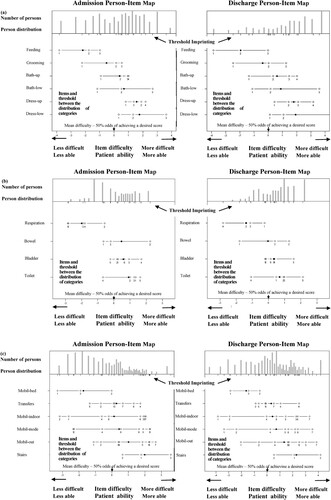
Threshold imprints
The difficulty values of the thresholds between item categories are displayed as “threshold imprinting” or the numerous “ticks,” on the upper horizontal line representing the X-axis, in (A–C).
Reliability and separability of ability estimates
Reliability index values ranged between 0.7 and 0.9. Person separation index values ranged between 1.7and 4.3, indicating that at P < .05, measurements were able to distinguish 2.6–6 strata of abilities ().
Table 2 Reliability and separation indices, and discernible strata.
Data-model fit
All subscales fit values, all individual items’ infit and admission outfit values, and 12 of 16 discharge items outfit values were lower than 1.4. Discharge outfit values above 1.4 (misfit) were found only at discharge for the Feeding, Respiration, Mo in bed, and Transfers items. A few were deviant (very high). Several infit and many outfit values were less than 0.6, indicating overfit (Tables S3a, S3b, and S3c, Appendix 5). After collapsing subscales to remove misfit, person ability highly correlated with the original person ability (Fig. S1, Supplementary material, Appendix 5, r = 0.890–0.993).
Patient ability ceiling and floor effects
At admission, the ceiling effect was 11%, 5%, and 2%, for the SC, RSpM, and Mo subscales, respectively. Floor effect was 8.54%, 0.16%, and 16.75%, respectively. The corresponding values at discharge were 17%, 11%, and 5%, and 3.04%, 0.16%, and 3.38%.
Subscale unidimensionality
The percentage of variance explained by the Rasch person ability and item difficulty, in the various subscales, was 99.0%−99.7%. The correlation coefficients corrected for attenuation were 0.880, 1.000, and 0.988, for the subscales SC, RSpM, and Mo, respectively, at admission and 0.850, 1.00, and 1.000, respectively, at discharge.
Category ordering
The RPCs show that of the 92 SCIM VI categories, 62 emerged at admission and 65 at discharge, but they also include items with disorder, and show that all Mo items exhibit some disorder ( and ).
Figure 2 Response probability curves of the item “dressing lower body” at admission and discharge (N = 644 and 624). At admission, raters scored 2 only a small group of fewer than 60 participants, choosing the adjacent scores of 1 and 3 for more participants. This made category 2 non-emergent, although it peaks between categories 1 and 3. At discharge, more persons achieved a score of 2, balancing the score distribution of the item, and category 2 became emergent (hence, thresholds became ordered).
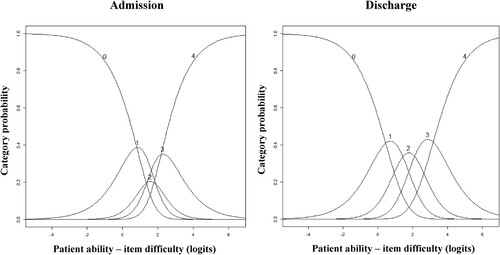
Table 3 Summary of category ordering across the SCIM IV items.
Differential item functioning (DIF)
Contrasts of subgroups of age (above or below the median of 54 years), sex (male or female), lesion etiology (traumatic or non-traumatic), and lesion level (cervical or other) showed minor DIF: For 67% of the items, category difficulty values in the X–Y plots lay within the 95% confidence bands, surrounding the identity line. DIF, however, was relatively prominent, in certain tasks, such as Dressing upper body at admission, between persons with cervical and other levels of SCL (Figs. S2A and S2B, Appendix 5). Differences in item difficulty across countries did not exceed 0.5 logit for 93% of the items. In Denmark, China, and Israel, DIF exceeded one logit for Feeding, Bathing upper body, Grooming, and Respiration, but the bias was not statistically significant for any of the items (Fig. S3, Appendix 5).
Rasch properties of SCIM IV vs. SCIM III
The main findings of the present study, compared with those of the previous SCIM III Rasch analysis, are presented in . SCIM IV thresholds match those of SCIM III, assessed in the present study (, r = 0.887–0.995).
Figure 3 Contrast of thresholds of SCIM III and SCIM IV. The contrasted assessments are of the population of the present study. We excluded from this analysis individuals with missing data and those with maximum or minimum raw scores in SCIM III or in SCIM IV. Logit values of the threholds of both SCIM III and SCIM IV align along the identity line, in all contrasts. The correlation coefficient (r) is 0.887–0.995.
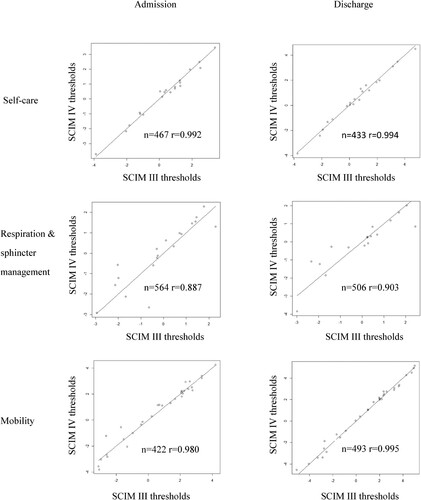
Table 4 Comparison of the main Rasch analysis findings for SCIM III and SCIM IV.
Relative weights of SCIM IV items
The weighted raw scores of SCIM IV subscales match the linear Rasch measures (Fig. S3, Table S4, Appendix 5).
Discussion
Reliability and validity of SCIM IV subscale scores
The findings of this study support the reliability and validity of SCIM IV subscale scores for assessing the daily task execution of SCL individuals.
The values of the reliability and person separation indices, the 2–6 discernible strata, and the minor DIF across the sub-groups of interest indicate that SCIM IV subscale scores are reliable (Citation10). For a minority of items, we found DIF when contrasting groups. We expected some of the differences, such as those between thoracic and cervical SCL, and others may indicate reduced reliability of those items.
The match of the distribution of item difficulty with person ability measurements, and the fit to the Rasch model indicate that individuals who are more able have a higher probability of achieving higher scores on all items. The lack of infit misfit for subscales and items indicates a good fit to the Rasch model. Although we found some outfit misfit and several overfit values, these are not an indication of a significant scale malfunctioning. Infit deserves greater attention because it reflects multiple slightly unexpected scores, whereas items and categories with outfit-type misfit are presumably strongly influenced by outliers, which may be errors. In addition, patients whose person measures are likely to be correlated, and whose scores are likely to be “on-target,” contribute more to the infit than to the outfit statistics. Overfit may indicate redundancy of certain categories, but there are overriding clinical considerations to retain such categories: they accurately reflect the execution of certain tasks by certain individuals, and their score can be important for understanding individual clinical conditions and the required treatment.
The subscales’ fit to the Rasch model and the high percentage of score variance explained by the Rasch measure of person ability and item difficulty indicate that SCIM IV subscale scores are satisfactorily unidimensional: they reflect the participant’s coping with daily task difficulty, and not other hidden participant or task properties. The values found for the coefficients of the correlations, corrected for attenuation, further support the unidimensionality of the subscales.
Of the categories, 67%−71% were emergent, which suggests the need to “collapse” categories with disordered thresholds, to satisfy the requirement for order in threshold locations between categories. This should be based, however, on substantial a priori reasons (Citation30), and in SCIM IV, as in SCIM III, we retained such categories for the same reasons that we retained categories with overfit values, although obtaining ordered categories is a desirable goal (Citation31, Citation32). We believe that the clinical benefit of using SCIM as it stands (better description of individual task execution and clinical condition, which may affect treatment) outweighs the slight inaccuracy of the overall measurement of ability. The high correlation between person measures, before and after collapsing subscales to remove misfit, provides empirical support for the rationale to maintain the integrity of SCIM IV.
Patient ability ceiling and floor effects show that all subscales are too easy and/or too difficult for certain patients. This suggests the need to add scoring criteria adjacent to the two extreme ends to increase the range of assessable person abilities. The contribution of such an addition to the length of the scale would reduce its utility, however, and its clinical and overall psychometric value is doubtful.
SCIM IV at admission and discharge
The Rasch ruler showed higher person ability at discharge, possibly because functioning improved during rehabilitation (). Overall reliability and validity, however, were similar at admission and discharge.
SCIM IV vs. SCIM III
The changes made in SCIM III to create SCIM IV (Appendix 3), clarified that the scale assesses performance and independence defined according to the intention of SCIM developers. Changes also fine-tuned the scoring, adjusting it for certain circumstances and personal statuses that SCIM III did not address. Grouping all transfer items into a restructured single item allowed focusing attention separately on each direction of the same transfer (e.g. to and from bed), with a wider range of scores (0–7 vs. 0–3). It also allowed evaluating differently the transfers of walkers and of wheelchair users, maintaining the total weight of the transfer items.
Following the changes introduced to create SCIM IV, the psychometrics of the resulting scale were as good as those of SCIM III (Citation1, Citation8). In the Rasch analysis, SCIM IV showed lower infit values, a lower percent of emergent categories, and more category and item score redundancy than did SCIM III (). But unlike for SCIM III, we found no item score infit-misfit for SCIM IV.
In the SCIM IV transfer item, in which the change from SCIM III was the most prominent, some threshold disorders and misfit could affect the accuracy of the measurement of transfer items. But the transfers DIF was not significant at either admission or discharge, attesting to the reliability of the new transfer item (Figs. S2A and S2B, Appendix 5). Five of eight transfer categories were emergent, and the fit values at admission of the item and seven of eight categories were acceptable. The only misfit we found was outfit of the item and of five categories at discharge, which may be errors ( and S3c, Appendix 5).
The comparison of the main findings of this study with those of our previous and present SCIM III Rasch analysis ( and ) shows that overall, the psychometrics of both SCIM versions are quite similar. Moreover, the SCIM IV unlike the SCIM III investigation, included data at both admission and discharge. In the SCIM IV analysis, the sample was larger, and derived from more countries and from additional cultures.
Rasch analysis of three separate SCIM subscales
We examined SCIM IV on three separate subscale scores because the domains of the subscales are partially different, and to add rigor to the testing (Appendix 1).
Further information gained from this study
The study shows that the weighted SCIM IV raw scores match its linear Rasch measures, as presented in Fig. S4, and Table S4 (Appendix 5), which supports the weighting of SCIM IV subscale scores. The study highlights the strengths and limitations of SCIM, the challenges created by using observed task execution as a measure, and the utility of Rasch theory in the development and assessment of outcome measures (Appendix 1).
Future research
To further establish the validity of SCIM IV, we suggest performing studies replicating SCIM IV studies in additional countries. We further recommend examining the match of SCIM IV scores with survival, late complications, as well as social, educational, and vocational participation, and investigating patterns of misfit and disordered thresholds. Increasing the sample may improve the estimation of the Mo subscale and diminish sampling noise, which may be the reason for the low frequency of certain non-emergent categories (Citation33, Citation34).
Study limitations
Study limitations include the scoring of a few items by report, scoring by raters who had seen participants executing tasks while treating them, and sample size, which was borderline for the Mo subscale, and may be too small for a minority of the DIF analyses, despite the large number of participants. These drawbacks, however, are likely to have had small effects, already included in the acceptable standard errors consistent with satisfactory reliability indices, and should not change the interpretation of the results.
Conclusion
SCIM IV subscale scores are reliable and valid quantitative representation of a given construct of task execution and independence in daily living after SCL. Combined with findings of previously published analyses, this finding confirms the justification for using SCIM IV in clinical practice and research.
Disclaimer statements
Conflicts of interest Authors have no conflict of interests to declare.
Supplemental Material
Download Zip (3 MB)Acknowledgements
We thank the staff members of all the units participating in this study. We express our gratitude to the staff members of the Spinal Rehabilitation Department of Loewenstein Rehabilitation Medical Center for their contribution. We would like to acknowledge Dr. Chitra Kataria, Head of the Rehabilitation Department at Indian Spinal Injuries Centre for her help in subject recruitment. We would like to express our gratitude to the OT staff of the Department of Neurological Rehabilitation at Sheba, Tel Hashomer Hospital. In Brazil, TPS was sponsored by the Coordination for the Improvement of Higher Education Personnel (CAPES). We acknowledge Priyanka, Neetu, Gaurav & Shireen our therapy staff at Rehabilitation Research Center, Jaipur, India, who helped with SCIM assessments. We would like to acknowledge Lauren Brandys, the research assistant who recruited the participants and kept track of the data at the Ottawa site. We would like to acknowledge our colleagues, Elna Waagø, Øyvind Larsen, and Randi Fjellheilm, at St. Olav University Hospital, who helped with SCIM assessments. We would like to thank and acknowledge the staff at the Research Department and the Midland Centre for Spinal Injuries at The Robert Jones and Agnes Hunt Orthopaedic Hospital. Special thanks are due to Pedro Silva FEBPRM MD, Joy Roy Chowdhury MBBS, MRCS, Naveen Kumar MBBS, D. Orth, MRCS Ed, FEBPRM (EU), FRCP (London), FRCS (Glasgow), FRCS (Edinburgh), Srinivasa Chakravarty Budithi, MBBS, MS, MRCS, FRCSEd (T&O), FEBOT, FEBPRM.
References
- Anderson KD, Acuff ME, Arp BG, Backus D, Chun S, Fisher K, Fjerstad JE, Graves DE, Greenwald K, Groah SL, et al. United States (US) multi-center study to assess the validity and reliability of the spinal cord independence measure (SCIM III). Spinal Cord. 2011;49(8):880–885.
- Kumar S K, Panwar P, Garg S, Kalra S, Yadav J. Translation and cross-cultural adaptation of spinal cord independence measure version III in Hindi language. Ann Indian Acad Neurol. 2020;23(1):98–102.
- Cho DY, Shin HI, Kim HR, Lee BS, Kim GR, Leigh JH, et al. Reliability and validity of the Korean version of the spinal cord independence measure III. Am J Phys Med Rehabil. 2020;99(4):305–309.
- Bluvshtein V, Front L, Itzkovich M, Benjamini Y, Galili T, Gelernter I, et al. A new grading for easy and concise description of functional status after spinal cord lesions. Spinal Cord. 2012;50(1):42–50.
- Scivoletto G, Glass C, Anderson KD, Galili T, Benjamin Y, Front L, et al. An international age and gender controlled model for the spinal cord injury ability realization measurement index (SCI-ARMI). Neurorehabil Neural Repair. 2015;29(1):25–32.
- Catz A, Itzkovich M, Agranov E, Ring H, Tamir A. SCIM - spinal cord independence measure: a new disability scale for patients with spinal cord lesions. Spinal Cord. 1997;35(12):850–856.
- Itzkovich M, Tripolski M, Zeilig G, Ring H, Rosentul N, Ronen J, et al. Rasch analysis of the Catz-Itzkovich spinal cord independence measure. Spinal Cord. 2002;40(8):396–407.
- Catz A, Itzkovich M, Tesio L, Biering-Sorensen F, Weeks C, Laramee MT, et al. A multi-center international study on the spinal cord independence measure, version III: Rasch psychometric validation. Spinal Cord 2007;45(4):275–291.
- Andrich D, Marais I. A course in rasch measurement theory. measuring in the educational, social and health sciences. Singapore: Springer Nature; 2019.
- Tesio L. Disability, dependence and performance: which is which? Eur Med Phys. 1997;33(2):55–57.
- Glenny C, Stolee P, Husted J, Thompson M, Berg K. Comparison of the responsiveness of the FIM and the interRAI post acute care assessment instrument in rehabilitation of older adults. Arch Phys Med Rehabil. 2010;91(7):1038–1043.
- Fernandes DS, Goncalves LHT, Ferreira AMR, Cuenca A, Corrêa AS. Functional capacity assessment of long-lived older adults from Amazonas. Rev Bras Enferm. 2019;72(suppl 2):49–55.
- Catz A, Itzkovich M, Elkayam K, Michaeli D, Gelernter I, Benjamini Y, et al. Reliability validity and responsiveness of the spinal cord independence measure 4th version in a multicultural setup. Arch Phys Med Rehabil. 2022;103(3):430–440.
- Itzkovich M, Gelernter I, Biering-Sorensen F, Weeks C, Laramee MT, Craven BC, et al. The spinal cord independence measure (SCIM) version III: reliability and validity in a multi-center international study. Disabil Rehabil. 2007;29(4):1926–1933.
- Schuld C, Franz S, Brüggemann K, Heutehaus L, Weidner N, Kirshblum SC, et al. International standards for neurological classification of spinal cord injury: impact of the revised worksheet (revision 02/13) on classification performance. J Spinal Cord Med. 2016;39(5):504–512.
- Masters G. A Rasch model for partial credit scoring. Psychometrika. 1982;47(2):149–174.
- Andrich D. A rating formulation for ordered response categories. Psychometrika. 1978;43(4):561–573.
- Bond TG, Fox CM. Applying the Rasch model. Fundamental measurement in the human sciences. New Jersey: Lawrence Erlbaum Associates, Mahwah; 2007.
- Wright BD, Masters GN. Rating scale analysis. Chicago: MESA Press; 1982.
- Fisher W. Reliability, separation, strata statistics. Rasch Measure Trans. 1992;6(3):238. https://www.rasch.org/rmt/rmt63i.htm.
- Wright BD. Reliability and separation. Rasch Measure Trans. 1996;9(4):472.
- Bond TG, Fox CM. Applying the rasch model: fundamental measurement in the human sciences. New Jersey: Lawrence Erlbaum Baum Associates, Mahwah; 2001.
- Wright BD, Linacre JM. Reasonable mean-square fit values. Rasch Measure Trans. 1994;8(3):370. https://www.rasch.org/rmt/rmt83b.htm.
- Fisher WP. Rating scale instrument quality criteria. Rasch Measure Trans. 2007;21(1):1095.
- Linacre JM. Structure in Rasch residuals: Why principal components analysis (PCA)? Rasch Measure Trans. 1998;12(2):636.
- Andersen EB. Polytomous Rasch models and their estimation. In: Fischer GH, Molenaar IW, (eds.) Rasch models. New York: Springer; 1995. p. 271–291.
- Chang FH, Ni P, Coster WJ, Whiteneck GG, Jette AM. Measurement properties of a modified measure of participation for persons with spinal cord injury. J Spinal Cord Med. 2016;39(4):476–483.
- Linacre JM. Understanding Rasch measurement: optimizing rating scale category effectiveness. J Appl Meas. 2002;3(1):85–106.
- Smith RM, Linacre JM, Smith EV. Guidelines for manuscripts. J Appl Meas. 2003;4(2):198–204.
- Adams RJ, Wu ML, Wilson M. The Rasch rating model and the disordered threshold controversy. Educ Psychol Meas. 2012;72(4):547–573. doi:10.1177/0013164411432166.
- Linacre MJ. Andrich thresholds: Disordered rating or partial credit structures. https://www.winsteps.com/winman/disorder.htm.
- Andrich D. Thresholds, steps and rating scale conceptualization 1998. https://www.rasch.org/rmt/rmt1239.htm.
- Linacre JM. Category disordering (disordered categories) vs. threshold disordering (disordered thresholds). Rasch Measure Trans. 1999;13(1):675. https://www.rasch.org/rmt/rmt131a.htm.
- Linacre JM. Comparing and choosing between “partial credit models” (PCM) and “rating scale models” (RSM). Rasch Measure Trans. 2000;14(3):768. https://www.rasch.org/rmt/rmt143k.htm.